Factorial design analysis for adsorption of dye on
activated carbon beads incorporated with calcium
alginate
Gurusamy Annadurai
a, Ruey-Shin Juang
b,U, Duu-Jong Lee
aa
Department of Chemical Engineering, National Taiwan Uni¨ersity, Taipei 106, Taiwan
b
Department of Chemical Engineering, Yuan Ze Uni¨ersity, Chung-Li 320, Taiwan
Abstract
Batch adsorption equilibrium of the dye Rhodamine 6G, using activated carbon beads incorporated with calcium
Ž .
alginate ACCA beads , was studied. The effects of several factors governing the adsorption process, such as dye
Ž . Ž . Ž .
concentration 100᎐300 mgrl , pH 7᎐9 , and temperature 30᎐60⬚C , on percent of adsorption were investigated at a
Ž .
fixed dosage of ACCA beads 1 grl . High percentages of adsorption of Rhodamine 6G were obtained using ACCA
beads. Based on the analysis of variance and the factorial design of experiments, dye concentration was the most significant factor under the experimental ranges examined.䊚 2002 Elsevier Science Ltd. All rights reserved.
Keywords: Factorial design of experiments; Dye adsorption; Activated carbon; Calcium alginate; Incorporation
1. Introduction
Textile and tannery effluents are two of the most polluting industrial wastes, and the problems of treat-ment and disposal of such wastes require much atten-tion. It is difficult to remove the dyes from the efflu-ents, since most dyes are stable to light and heat and
Ž .
are not biodegradable McKay, 1982 . Thus, the com-mon methods for color removal, including primary and secondary treatment processes applied in sewage plants,
Ž
are unsuitable McKay et al., 1986; Nassar and El-.
Geundi, 1991 . Rates of treatment of dyes are generally low, and untreated dyes may have a serious impact on
UCorresponding author. Department of Chemical Engi-neering, Yuan Ze University, Chung-Li 320, Taiwan; Tel.: q886-3-4636800 ext. 555; fax: q886-3-4559373.
Ž .
E-mail address: [email protected] R. Juang .
receiving water. The adsorption process has been con-sidered because it has the ability to treat dyes in more
Ž .
concentrated form Annadurai et al., 1999a .
Ž .
Activated carbons granular or powder are widely used adsorbents owing to their excellent adsorption abilities for a vast number of organic compounds. How-ever, steam regeneration is energy consuming and the price of the adsorbents is relatively high, which limits
Ž .
their usage El-Geundi, 1997 . In practice, many work-ers have searched for cheaper substitutes made from
Ž natural resources. Fly ash, agricultural wastes coconut
. Ž
shell, rice husk, etc. , seafood wastes chitin, chitosan, .
etc. , and natural polymers such as alginate have been Ž
tested for color removal El-Geundi, 1997; Juang et al., 1997; Khare et al., 1987; Mall and Upadhyay, 1995;
. Yang and Zall, 1984 .
On the other hand, the potential of co-immobilized systems utilizing entrapped materials such as living cells has been recognized in several water treatment
1093-0191r02r$ - see front matter 䊚 2002 Elsevier Science Ltd. All rights reserved. Ž .
( ) G. Annadurai et al.rAd¨ances in En¨ironmental Research 6 2002 191᎐198 192
Ž
and fermentation processes Lin and Chen, 1995; Mu-.
rata et al., 1993; Pai et al., 1995 . The use of such techniques in wastewater treatment offers a promising way of improving the efficiency of the adsorption process, especially in solving the problems associated
Ž
with solid-liquid separation in settling tanks Hashimoto .
and Furukawa, 1987 . In our laboratory, a series of experiments has been conducted to evaluate the per-formance of activated carbon incorporated with cal-cium alginate for adsorption of organic matter. The immobilization of living cells on activated carbons by adsorption, or in alginate by entrapment, has often
Ž
been used in biological applications Lin and Chen, .
1995; Murata et al., 1993; Pai et al., 1995 . To our best knowledge, however, little attention has been paid to the environmental applications of this type of adsor-bent. This paper first illustrates the use of variance analysis and factorial design of experiments to provide
Ž
insight into the adsorption process Jose, 1987; Liposan .
and Sheth, 1973; Yates, 1937 . That is, the significance Ž of the effect of three main experimental variables dye
.
concentration, temperature and pH on the percent of dye adsorption was identified.
2. Mathematical model
In the factorial design of experiments, when
respon-Ž .
ses and input variables factors , initial dye concentra-tion and temperature are continuous, it is useful to consider the factor᎐response relationship in terms of a mathematical model. For qualitative factors where there is no continuous link between the response and the levels of a factor, it is necessary to consider a comparison of response between two levels of a quali-tative factor. In this work, initial solution pH with two
Ž .
levels is examined Jose, 1987 . The factorial approach will result in a considerable saving of time and materi-als devoted to the experiments. First, the factor that is independent of all simple effects of a factor is equal to its main effect. The consequences of variations in the factors and the main effects are the only quantities that need to be stated. Second, each main effect in the factorial experiments is estimated with the same accu-racy as if the whole experiment had been devoted to
Ž .
the factor alone Yates, 1937 . Thus, the advantages of Ž .
this method are: 1 all experimental units are used in evaluating effects, resulting in the most efficient use of
Ž .
resources; 2 the effects are evaluated over a wider Ž . range of conditions with the minimum of resources; 3 a factorial set of treatments is optimized for estimating main effects and interactions.
In this work, factorial design experiments are used in
the analysis of adsorption of dye. Three input variables, dye concentration, temperature and pH, are con-sidered. It is useful to consider the factor response relationship in terms of a mathematical model such as the response function. The use of variance analysis and factorial design of experiments allows us to express the percent of adsorption as a polynomial model. If the levels of the factors are equally spaced, the orthogonal polynomial adopted to give a more detailed equation for the response will be:
Ysb qb Cqb Tqb Pqb C2qb T2 0 1 2 3 4 5 qb CTqb CPqb TPqb CTPqb C2T 6 7 8 9 10 qb C2Pqb CT2qb T2Pqb C2T2 11 12 13 14 2 2 2 2 Ž . qb C TPqb CT Pqb C T P15 16 17 1 Ž
where Yspredicted response percent of dye
adsorp-.
tion , biscoefficients of polynomial equation, Cs
Ž . Ž .
initial dye concentration mgrl , Tstemperature ⬚C and Psinitial pH.
The method used for calculation of the effects and their sums of squares, as we will see below, is a simple extension of the method introduced by Yates for a 2n
Ž .
factorial design Jose, 1987; Yates, 1937 . The main and interaction effects are all linear combinations of the observations. A convenient way of estimating these effects for a 33=21 factorial design is to establish a
table of the appropriate multipliers that are applied to the observations. Table 1 lists the coefficients of this design. Furthermore, the analysis of variance permits
Ž .
us to eliminate the terms in Eq. 1 that are insignifi-cant at a specified level of confidence.
3. Experimental
3.1. Materials
Sodium alginate from brown algae was purchased as
Ž .
alginic acid sodium salt Fluka Co. . Powdered acti-vated carbon was supplied by Merck Co. and used as received. It had an average particle diameter of 0.55 mm. The BET surface area, mean pore size, and total pore volume of activated carbon were measured to be 726 m2rg, 2.4 nm, and 0.435 cm3rg, respectively, from
Ž
N isotherms using a sorptiometer Porous Materials2
. Ž
Inc., BET-202A . The dye Rhodamine 6G C.I. 45160, .
Basic Red 1, and formal weight 479.0 was purchased from Sigma Co., and was used without further purifica-tion. The aqueous solution was prepared by dissolving
Ž .
dye in deionized water Millipore, Mill-Q . The initial pH value was adjusted by adding a small amount of
() et al. r Ad ¨ ances in En ¨ ironmental Research 6 2002 191 ᎐ 198 193 3 1 Ž .
Multipliers for derivation of the effects in a 3 2 factorial design Yates, 1937
a Run 1 2 3 4 5 6 7 8 9 10 11 12 13 14 15 16 17 18 DSS a M.E. C1 y1 0 1 y1 0 1 y1 0 1 y1 0 1 y1 0 1 y1 0 1 12r C2 1 y2 1 1 y2 1 1 y2 1 1 y2 1 1 y2 1 1 y2 1 36r T1 1 1 1 0 0 0 y1 y1 y1 1 1 1 0 0 0 y1 y1 y1 12r T2 1 1 1 y2 y2 y2 1 1 1 1 1 1 y2 y2 y2 1 1 1 36r P1 1 1 1 1 1 1 1 1 1 y1 y1 y1 y1 y1 y1 y1 y1 y1 18r a I.E. C T1 1 y1 0 1 0 0 0 1 0 y1 y1 0 1 0 0 0 1 0 y1 8r C P1 1 y1 0 1 y1 0 1 y1 0 1 1 0 y1 1 0 y1 1 0 y1 12r T P1 1 1 1 1 0 0 0 y1 y1 y1 y1 y1 y1 0 0 0 1 1 1 12r C T1 2 y1 0 1 2 0 y2 y1 0 1 y1 0 1 2 0 y2 y1 0 1 24r C T2 1 1 y2 1 0 0 0 y1 2 y1 1 y2 1 0 0 0 y1 2 y1 24r C P2 1 1 y2 1 1 y2 1 1 y2 1 y1 2 y1 y1 2 y1 y1 2 y1 36r C T2 2 1 y2 1 y2 4 y2 1 y2 1 1 y2 1 y2 4 y2 1 y2 1 72r T P2 1 1 1 1 y2 y2 y2 1 1 1 y1 y1 y1 2 2 2 y1 y1 y1 36r C T P1 1 1 y1 0 1 0 0 0 1 0 y1 1 0 y1 0 0 0 y1 0 1 8r C T P1 2 1 y1 0 1 2 0 y2 y1 0 1 1 0 y1 y2 0 2 1 0 y1 24r C T P2 1 1 1 y2 1 0 0 0 y1 2 y1 y1 2 y1 0 0 0 1 y2 1 24r C T P2 2 1 1 y2 1 y2 4 y2 1 y2 1 y1 2 y1 2 y4 2 y1 2 y1 72r a
( ) G. Annadurai et al.rAd¨ances in En¨ironmental Research 6 2002 191᎐198 194
3.2. Preparation of ACCA beads
Sodium alginate was dissolved in a solution contain-ing the material to be encapsulated. The final alginate
Ž . Ž .
concentration was 2% wrv , to which 1% wrv acti-vated carbon was added. The viscous solution was introduced into a 100-cm3burette and extruded through a nozzle with 0.16-mm diameter. The droplets were pulled off on 200 cm3 of a 0.05-molrl CaCl stirred
2
Ž .
solution. After allowing the beads 3 mm in size to harden for 1 h, they were rinsed with deionized water and then transferred into 75 cm3of deionized water for
storage at 4⬚C.
3.3. Batch equilibrium and design of experiments
Batch adsorption equilibrium was determined in
so-Ž .
lutions containing a dosage of ACCA beads 1 grl and
Ž .
different dye concentrations 100, 200 and 300 mgrl ,
Ž . Ž
initial pH values 7, 8 and 9 , and temperatures 30, 45 .
and 60⬚C in conical flasks. The conical flasks were shaken at 180 rev.rmin for 4 days in a water bath ŽFirstek B603, Taiwan . The final concentration of dye. in the aqueous solutions was analyzed using a Hitachi
Ž .
UVrvisible spectrophotometer Model U2000 at 528
nm. Each experiment was at least duplicated under identical conditions. Reproducibility of the equilibrium
Ž .
measurements was within 4% mostly 2% .
The ranges of the three independent variables used in the design of the experiments were the same as those used in the batch adsorption equilibrium experi-ments, except that only two levels of temperatures were
Ž .
selected 30 and 60⬚C . The dye concentration, pH and temperature used in the 18 experiments are listed in Table 2.
3.4. Scanning electron microscopy of ACCA beads
The dye adsorbed onto the ACCA beads was fixed with 2.0% wrv glutaraldehyde overnight. The sample was dehydrated by sequential immersion for 30 min by
Ž
increasing concentrations of acetone 20, 30, 60, 80 and .
90% wrv, and anhydrous acetone . The dehydrated
beads were dried and covered with a thin layer of gold. The surface structure of the beads was observed using
Ž
a scanning electron microscope JEOL Japan, Model .
JSM-5600 operated at 15 kV.
4. Results and discussion
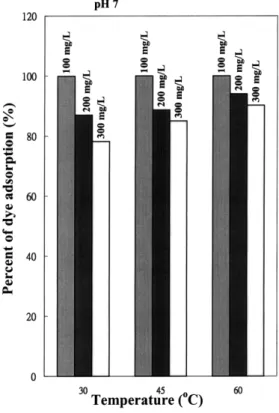
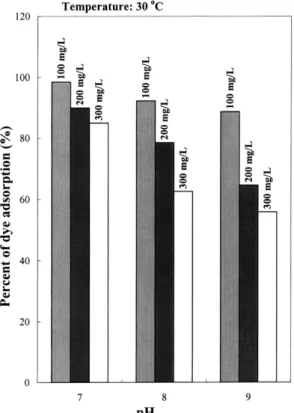
The adsorption capacity is one of the essential parameters in the process design of a specific adsor-bate᎐adsorbent system. Figs. 1 and 2 show the effect of temperature, initial pH, and dye concentration on the
Table 2
Operating conditions
Trial no. Dye concen- pH
Tempera-tration ture Žmgrl. Ž⬚C. 1 100 7 30 2 200 7 30 3 300 7 30 4 100 8 30 5 200 8 30 6 300 8 30 7 100 9 30 8 200 9 30 9 300 9 30 10 100 7 60 11 200 7 60 12 300 7 60 13 100 8 60 14 200 8 60 15 300 8 60 16 100 9 60 17 200 9 60 18 300 9 60
percent of adsorption. It is evident that the ACCA beads have a good capability for adsorption of the dye Rhodamine 6G. In addition, the percent of adsorption
Fig. 1. Percent of dye adsorption at different temperatures and dye concentrations. The dosage of ACCA beads is 1 grl.
Fig. 2. Percent of dye adsorption at different initial pH values and dye concentrations. The dosage of ACCA beads is 1 grl.
increased when the temperature increased from 30 to
Ž .
60⬚C Fig. 1 , but decreased with increasing dye
con-Ž .
centration or initial pH Fig. 2 . It appears from the experimental results that the effect of temperature is comparatively smaller. This implies that the present adsorption process is physical in nature. An increase in temperature would slightly increase the diffusivity of large dye molecules or ions and also produce a swelling effect within the internal structure of the ACCA beads. This would enable the dye molecules or ions to
pene-Ž
trate further Annadurai et al., 1999b; Asfour et al., .
1985; McKay, 1982 . The possibility that more of the higher-capacity activated carbon was exposed at higher temperatures, perhaps as a result of dissolution of the
Ž .
lower-capacity alginate Murata et al., 1993 , was also considered. However, based on the measurements of calcium concentration in the aqueous phase, this was not the case.
It is known that many biopolymers such as sodiumrcalcium alginate, glutaraldehyde and agarose can sorb organic matter and strongly bind heavy metal
Ž .
ions Aksu et al., 1999 . They are non-toxic, efficient and cheap, and thus highly competitive with activated carbon or polymeric resins. The adsorption capacity of the ACCA beads for Rhodamine 6G was generally found to be lower than that of common activated
Ž .
carbons Murata et al., 1993 . However, the ACCA beads are more suitably used as immobilization sup-ports for bacteria or fungus. This can improve biomass performance and biosorption capacity, which is promis-ing for microbiological degradation of organic
pollu-Ž .
tants Aksu et al., 1999; Zhang and Yu, 2000 . Three levels of initial dye concentrations and pH values, and two levels of temperatures were selected for factorial design of experiments according to the
Ž .
method by Yates 1937 . A total of 18 experiments ŽTable 2 were used for error estimation of the three-. factor linear and quadratic interactions. The main and interaction effects obtained were multiplied by ap-propriate coefficients as shown in Table 1. The mea-sured and predicted data are listed in Table 3, reveal-ing a reasonably good agreement.
The results of variance analysis with linear terms and quadratic terms for each run are also listed in
Ž
Table 4. The subscript 1 indicates linear terms and the .
subscript 2 indicates quadratic terms. The significance
Ž .
effect of each term the fifth column and the signifi-Ž
cance levels through the F-distribution the last
.
column are calculated. In general, the linear terms are more significant than the quadratic interactions. It is shown that the dye concentration is the most significant factor and temperature is the most insignificant one in
Ž
the present adsorption process Jose, 1987; Liposan .
and Sheth, 1973 . This confirms the experimental observations as indicated above. The solution pH has little effect in this case, as has been previously reported in adsorption of dyes and organic matter using
acti-Ž
vated carbons McKay, 1982; McKay et al., 1986; Na-.
masivayam and Arsi, 1997 . Furthermore, the analysis
Table 3
Actual and predicted percents for dye adsorption
Trial no. Actual value Predicted value
Ž%. Ž%. 1 98.50 98.47 2 96.70 96.77 3 94.80 95.07 4 98.70 98.71 5 97.00 97.01 6 95.30 95.31 7 99.20 98.95 8 97.30 97.25 9 95.60 95.55 10 99.90 99.80 11 98.20 98.10 12 96.40 96.40 13 100.0 100.04 14 98.60 98.34 15 96.70 96.64 16 100.0 100.02 17 98.20 98.59 18 97.10 96.89
( ) G. Annadurai et al.rAd¨ances in En¨ironmental Research 6 2002 191᎐198 196
Table 4
Analysis of variance
Run Observation Degree of Division for Significance Variance Significance
freedom sum of squares effect relation level
a b C1 y20 1 12 33.33 537.58 99% , 95% C2 0 1 36 ᎐ ᎐ b T1 y2.90 1 12 0.233 3.3758 95% T2 0 1 36 ᎐ ᎐ a b P1 y11.80 1 18 7.73 124.67 99% , 95% C T1 1 y0.7 1 8 0.061 0.9870 b C P1 1 y1.5 1 12 0.187 3.024 95% b T P1 1 y1.3 1 12 0.140 2.2709 95% C T1 2 y0.3 1 24 0.037 ᎐ C T2 1 y1.1 1 24 0.050 ᎐ C P2 1 0 1 36 ᎐ ᎐ C T2 2 0 1 72 ᎐ ᎐ T P2 1 0.9 1 36 0.022 ᎐ C T P1 1 1 0.5 1 8 0.031 ᎐ C T P1 2 1 0.7 1 24 0.020 ᎐ C T P2 1 1 0.5 1 24 0.010 ᎐ C T P2 2 1 1.5 1 72 0.031 ᎐ a F0.01,4.1s21.2. b F0.05,4.1s7.71. Ž .
of variance Table 5 indicates that the orthogonal
w Ž .x
polynomial equation Eq. 1 can be satisfactorily used Ž in such multiple linear regression analysis F-value,
2
. 396.73; R -value, 0.9884 .
w It should be noted that the model parameters Eq. Ž .1xwere determined by an ANOVA fitting exercise so that the model could adequately correlate most of the data. The model is then used to ‘predict’ the remaining
data, e.g. the measurement made at 45⬚C. In other
words, this model is essentially predictive, rather than correlative.
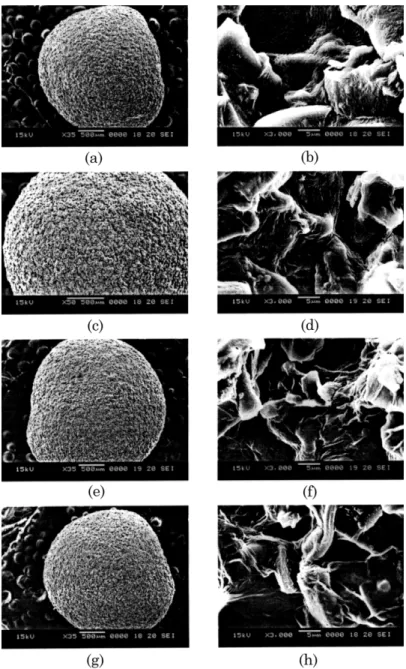
Finally, the surface structures of the ACCA beads before and after dye adsorption are shown in Fig. 3. The SEM photographs of the fresh ACCA beads illus-trate that the whole beads have a smooth surface with
Ž .
compact structure Fig. 3a,b . The original ‘color’
moni-Ž .
tor images Fig. 3c᎐h clearly show that the dye Rho-damine 6G is homogeneously adsorbed on the surfaces of the ACCA beads at different initial dye
concentra-Ž .
tions 100, 200 and 300 mgrl . It is noted that these
color figures are available from the authors. The pre-sent results indicate the possibility of using the ACCA beads for adsorption of dyes from aqueous streams.
5. Conclusions
The factorial design of experiments for batch ad-sorption of the dye Rhodamine 6G using activated carbon beads incorporated with calcium alginate ŽACCA beads was studied. The effects of three factors. Žinitial dye concentration 100᎐300 mgrl , initial pHŽ . Ž7᎐9 , and temperature 30᎐60⬚C on percent of ad-. Ž .. sorption were identified. The statistical analysis for each case confirmed that the orthogonal polynomial
w Ž .x
equation Eq. 1 gave a reasonably good fit with an
F-value of 396.73 and an R2-value of 0.9884. According
to the significance effect obtained in variance analysis, the initial dye concentration was the most significant
Table 5
Ž .
Regression analysis for adsorption of dye by linear model fitting ANOVA
Source Sum of squares d.f. Mean square F-value P)F
Model 43.38 3 14.46 396.73 -0.0001
Residual 0.51 14 0.036
Core total 43.89 17
2
Ž .
Fig. 3. Scanning electron micrographs of the ACCA beads. Fresh beads, 3a,b ; after adsorption at pH 7 and 30⬚C with dye
Ž . Ž . Ž .
concentration of 100 3c,d , 200 3e,f , and 300 mgrl 3g,h .
factor in this process and temperature was the most insignificant factor under the conditions investigated.
Acknowledgements
Financial support for this work by the National Sci-ence Council of ROC under Grant No. NSC89-2211-E-002-008 is gratefully appreciated.
References
Aksu, Z., Egretli, G., Kutsal, T., 1999. A comparative study for Ž .
the biosorption characteristics of chromium VI on Ca-al-ginate, agarose and immobilized C.¨ulgaris in a continuous packed bed column. J. Environ. Sci. Health A34, 295᎐316. Annadurai, G., Mahesh, K.P.O., Murugesh, P., Vasanthaku-mar, R., 1999a. Response surface method for experimental optimization for adsorption of basic dye on chelating po-lymer. Asian J. Microbiol. Environ. Sci. 1, 85᎐91. Annadurai, G., Chellapandian, M., Krishnan, M.R.V., 1999b.
( ) G. Annadurai et al.rAd¨ances in En¨ironmental Research 6 2002 191᎐198 198
Adsorption of reactive dye on chitin. Environ. Monit. As-sess. 59, 111᎐119.
Asfour, H.M., Fadeli, O.A., Nasser, M.M., El-Geundi, M.S., 1985. Equilibrium studies on adsorption of basic dyes on hard wood. J. Chem. Technol. Biotechnol. 35A, 21᎐27. El-Geundi, M.S., 1997. Adsorbents for industrial pollution
control. Adsorpt. Sci. Technol. 15, 777᎐787.
Hashimoto, S., Furukawa, K., 1987. Immobilization of acti-vated sludge by PVA-boric acid method. Biotechnol. Bioeng. 30, 52᎐59.
Jose, A., 1987. Use of factorial design of experiments in the determination of adsorption equilibrium constants. Methyl iodide in charcoals. J. Chem. Technol. Biotechnol. 38, 143᎐151.
Juang, R.S., Tseng, R.L., Wu, F.C., Lee, S.H., 1997. Adsorp-tion behavior of reactive dyes from aqueous soluAdsorp-tions on chitosan. J. Chem. Technol. Biotechnol. 70, 391᎐399. Khare, J.K., Panday, K.K., Srivastava, R.M., Singh, V.N., 1987.
Removal of Victoria Blue from aqueous solution by fly ash. J. Chem. Technol. Biotechnol. 38, 99᎐101.
Lin, Y.F., Chen, K.C., 1995. Denitrification and methanogene-sis in a co-immobilized mixed culture system. Water Res. 29, 35᎐43.
Liposan, D., Sheth, J., 1973. Statistical Design and Analysis of Engineering Experiments, Chapter 6. McGraw-Hill, New York.
Mall, I.D., Upadhyay, S.N., 1995. Removal of basic dyes from wastewater using boiler bottom ash. Indian J. Environ. Health 37, 1᎐10.
McKay, G., 1982. Adsorption of dyestuffs from aqueous
solu-tions with activated carbon. I. Equilibrium and batch con-tact-time studies. J. Chem. Technol. Biotechnol. 32, 759᎐772.
McKay, G., Prasad, G.R., Mouli, P.R., 1986. Equilibrium studies for the adsorption of dyestuff from aqueous solu-tions by low cost materials. Water Air Soil Pollut. 29, 273᎐276.
Murata, Y., Nakada, K., Miyamoto, E., Kawashima, S., Seo, S.H., 1993. Influence of erosion of calcium-induced alginate gel matrix on the release of Brilliant Blue. J. Control. Release 23, 21᎐26.
Namasivayam, C., Arsi, D.J.S.E., 1997. Removal of Congo Red from wastewater by adsorption onto waste red mud. Chemosphere 34, 401᎐417.
Nassar, M.M., El-Geundi, M.S., 1991. Comparative cost of color removal from textile effluents using natural adsor-bents. J. Chem. Technol. Biotechnol. 50, 257᎐262. Pai, S.L., Hsu, Y.L., Chong, N.M., Sheu, C.S., Chen, C.H.,
1995. Continuous degradation of phenol by Rhodococcus sp. immobilized on granular activated carbon and calcium alginate. Biores. Technol. 51, 37᎐42.
Yang, T.C., Zall, R.R., 1984. Adsorption of metals by natural polymers generated from seafood processing wastes. Ind. Eng. Chem. Prod. Res. Dev. 23, 168᎐171.
Yates, F., 1937. The Design and Analysis of Factorial Experi-ments. Imperial Bureau of Soil Science, Harpenden. Zhang, F., Yu, J., 2000. Decolorization of Acid Violet 7 with
complex pellets of white rot fungus and activated carbon. Bioproc. Eng. 23, 295᎐301.