Abstract
___----_- -_-- --___- --___-- --
A suitable selection of machining parameters for the wre electrical discharge machining (WEDS) process relies heavily on the operators’ technologies and experience because of their numerous and diverse range. Machining-parameters tables provided by the mschine-tool builder can not meet the operators’ requirements. since for an arbitrary desired roughness of the machining surface, they do not provide the optimal machining conditions. An ap roach to determine parameters setting is proposed. Based on the Taguchi quality design method and the analysis of variance. the significant factors affecting the machining performance such as metal removal rate, gap width, surface roughness, sparkin g frequency, average gap voltage and normal ratio (ratio of nomlal sparks to total sparks) are determined. By means of regression analysis, mathematical models relating the machining perfomlance and various machining parameters are established. Based on the mathematical models developed, an objective function under the multi-constraint conditions is formulated. The optimization problem is solved by the feasible direction method, and the optimal machining parameters are obtained. Experimental results demonstrate that the machining models are appropriate and the derived Tlachining parameters satisfy the real requirements in practice. 0 1937 Elsevier Science S.A.
Keywrds: Wire electrical discharge machining; Machining-parameters setting: Taguchi qualit> daiyl: Optimizatiorl
~~_____ ---__ ______ ____--- __-_-
1. Introduction
Wire electrical discharge machining (WEDM) in- volves a series of complex physical process including heating and cooling. The electrical. discharge energy, affected by the spark plasma intensity and the discharg- ing time, will determine the crater size, which in turn will influence the machining efficiency and surface qual- ity [l-4]. Hence, the machining parameters, including pulse-on time, pulse-off time, table feed rate, flushing pressure, wire tension, wire velocity, etc. should be chosen properly so that a better performance can be obtained. However, the selection of appropriate ma- chining parameters for WEDM is difficult and relies heavily on the operators’ experience and machining- parameters tables provided by the machine-tool builder. Scott, oyina and Rajurkar [S] used a factorial-de- sign method to determine the optimal combination of control parameters in WEDM, the measures of machin-
* Corresponding author. Fax: + 886 2 363 1755; e-mail: [email protected]
0924-0136/97/$37.00 0 1997 Elsevier Science S.A. All rights reserved. PII 50924-O 136(97)00117-9
irlg performance being the metal removal rate and the surface finish. Based on the analysis of variance, it was found that discharge current, pulse duration and pulse frequency are significant control factors for both the metal removal rate and the surface roughness. A total
number of 729 experiments was conducted. 32 machin- ing settings which resulted in a better metal removal rate and surface roughness were determined by two distinct techniques: Explicit enumeration of all possible combinations and the dynamic programming approach. However, this approach requires too many experirrnnts to be carried out. Further, it can not provide the optimal machining parameters for an arbitrary desired surface roughness or gap width.
Although the effect of improper machining-parame- ters settings in WEDM could be alleviated by an on- line control technique, the control reference values, which vary with different machining conditions, are difficult to determine. Moreover, the control effect will be significant only under appropriate off-line machin- ing-parameters setting. The optimal machining-parame- ters setting based on the operators’ experience
completely does not satisfy the requirements of both high efficiency and good quality. Machining-parameters tables, provided by machine-tool builders, could be a better choice for operators in factory, but still can not be applied to a wide range of machining conditions. Hence, research incorporating physical principles, ex- perimental techniques, mathematical analysis, optimiza- tion and computers, is the trend of WEDM optimal machining-parameters setting studies.
Optimal machining-parameters setting for WEDM still has some difficulty from the view of integrity and practice [6,7]. To be more specific, the experiments are too costly and time consuming to meet the requirement of full factorial designs. There are many machining parameters affecting the WEDM machine performance and the real mathematical models between machining performance and machining parameters are not easy to be derived because of the complex machining mecha- nism. The purpose of this paper is to present an effi- cient method by means of which to determine appropriate machining parameters so as to be able to achieve the objective of the shortest machining time whilst at the same time satisfying the requirements of accuracy and surface roughness. The cause-effect rela- tionship of machining parameters and machining per- formance in WEDM is discussed and the significant parameters affecting machining performance are found. Also, the mathematical models relating the machining performance and machining parameters are established by regression and correlation analysis. Finally, the opti- mal machining parameters by the non-linear approach- ing method under the constraints and requirements are obtained.
Table
Experimental design I
Control factor Level I Lecel 7 Level 3 Unit
Table feed 0.4 2.5 .- mm mm ’
Pulse-on time 3 7 IO 0.1 /.ls
Pulse-off time 6 9 13 1.6 j.~s
Wire speed 6 9 12 m min ’
Wire tension 800 1000 1200 gf
Flushing 3 5 7 kg cm-“’
” I kg cm-’ = 98.1 kPa.
The machining results after the WEDM process un- der the designed machining conditions are evaluated in terms of the following measured machining perfor- mance: (1) gap width (gap, pm); (2) metal removal rate (MRR, mm’ min-’ ); (3) surface roughness (R,, pm); (4) discharging frequency, (F,, kHz); (5) gap voltage
( Vg, V); (6) normal discharge frequency ratio (F,.).
3. Experimental results and data analysis
The chosen six parameters have different influences on the machining performance. The significant parame- ters are found by the analysis of variance (ANOVA). By regression analysis, mathematical models relating the machining performance to various machining parameters are established and the optimal machining- parameters setting is obtained using the feasible-direc- tion non-linear programming method.
2. Experimental equipment and design
A WEDM machine, developed by ITRI (Industrial Technology Research Institute) and CHMER com- pany, Taiwan, was used as the experimental machine. The work material, electrode and the other machining conditions were as follows: (1) workpiece (anode); SICDI 1 alloy steels; (2) electrode (cathode), 00.25 mm brass wire; (3) workpiece height, 30 mm; (4) cutting length, 20 mm; (5) open voltage, 95 V; (6) servo refer- ence voltage, 10 V; and (7) specific resistance of fluid, l-3 mA.
According to the Taguchi quality design concept [S], a L18 mixed orthogonal arrays table was chosen for the experiments. A total of six machining parameters (pulse-on time, pulse-off time, table feed, wire tension, wire speed and flushing pressure) were chosen for the controlling factors and each parameter was designed to have three levels, namely small, medium, and large, denoted by 1, 2 and 3, as shown in Table 1. In order to obtain better mathematical fitting models, another Ll Es experiments, as given in Table 2, were conducted.
The characteristic that higher value represents better machining performance, such as MRR, is called ‘higher is better, HB’. Inversely, the characteristic that lower value represents better machining performance, such as surface roughness, is called ‘lower is better, LB’. In quality engineering [8], the S/W ratio (signal-to-noise ratio) could be an effective representation to find the significant parameter from those controlling machining
Table 2 Experimental design I I Control factor Table feed Pulse-on time Pulse-off time Wire speed Wire tension Flushing
Level I Level 2 Level 3 Unit
-__ ____.__________ 1.2 2 mm min- ’ 5 7 8 0.1 J.& 8 9 II 1.6 ps 8 9 10 m min-’ 900 1000 1100 gf 4 5 6 kg cm-’
3.85 3.84 3.69 5.13 4.71 5.16 5.7 5.X 6.36 4.75 i Ji _ ._ _ 4.96 3 1.02 _30.97 32.35 33.92 X.3’ 30.74 3.95 3.83 3.61 5.03 1.66 5.05 5.34 5.X 7.x 4.61 5.72 5.17 31.77 3 I .c;3 32.39 34.36 2S.h 30.0 1 t/ ‘1 cdb, ~~ --- I 1.56-I I I.723 1 1.291 14.132 1 .:.x36 14.733 13.814 14.517 i6.517 13.31 I‘I.XIR 13 966 29.976 3.916 .:o. 19 1 3C).?O2 19.17 73.h76
In Ttguchi quality engdne~ring [S], ahe IJ E.&E IS a better representation than the SW oauo. Larger sl (or a larger S/N ratio equivalently) is better for both and LB.
rl = IQ*log(S;N ratio)
By applying the equation above, the 11 values of ma- chining performance for each experiment of L18 can be calculated. Taking the metal removal rate (MRR) as an example, the ~1 values are computed and given in Table 3.
In order to obtain the effects <If machining parame- ters on machining performance for each different level, the 11 values of each fixed parameter and level for each machining performance are summed up. From Table 3, taking TX,,] on as an example, the 11 \,alucs of three levels can be summarized as follows:
Level 1: ~~~~~ = 11.864 + 11.723 + 11.291 + 13.320 + 14.818 + 13.996 = 77.012 eve1 2: ‘I\,,,2 = 14.1.E + 13.386 + !4.233 + 29.976 + 29.916 + 30.191 = 131.824 ‘I ,>,,; = 13.814 + l-l.517 + 16.517 + 30.702 + 39.170 + 29.676 = 135.396
Similarly, those 11 \&tes of the other par;uncters on other machining performance could be evaluated. Table 4 shows the total 9 values of the levels of six parameters on MRR.
From Table 4, the combination of machining parameters (Feed), T,,,,7Totf3 V,, j Fit, P2 would result in maximum MRR because of larger I/ values. However, it is hard to assure that only this setting will result in maximum MRR because of the small difference of the 11 value between different levels and experimental error. Hence, analysis of variance (ANOVA) and the F test are used to analyze the experimental data as follows:
490
Table 4
Tntpl rl values of each level on MRR
Level Feed
1 122.467 77.012 114.798 116.682 115.321 113.756
2 22 1.765 131.824 113.53 113.571 115.251 115.274
3 135.396 115.904 113.979 113.66 115.202
Sum 344.232 344.232 344.232 344.232 344.232 344.232
where ST is the sum of squares due to total variation; Sm is the sum of squares due to mean; S” is the sum of squares due to factor A (A = Feed, Ton, T,, VW, FW and P); SE is the sum of squares due to error; ili is the 9 value of each experiment (i = I- 18); VAi is the sum Of
i level of factor A (1’= 1,2 or i= 1,2, 3); N is the repeating number of each level of factor A; fA is the degree of freedom of factor A; VA is the variance of factor A; and FAo is the F test value of factor A.
The square sum, variance and F test value of machin- ing parameters on the MRR in Table 5 were obtained by substituting those data in Tables 3 and 4 into the above equations. The bold type in Table 5 indicates the significant factors on MRR being Feed and T,, for the reason that both of the F,, values are bigger than
F 0.35,rr I .tr2* Similarly, the significant parameters for each
machining performance are shown in Table 6.
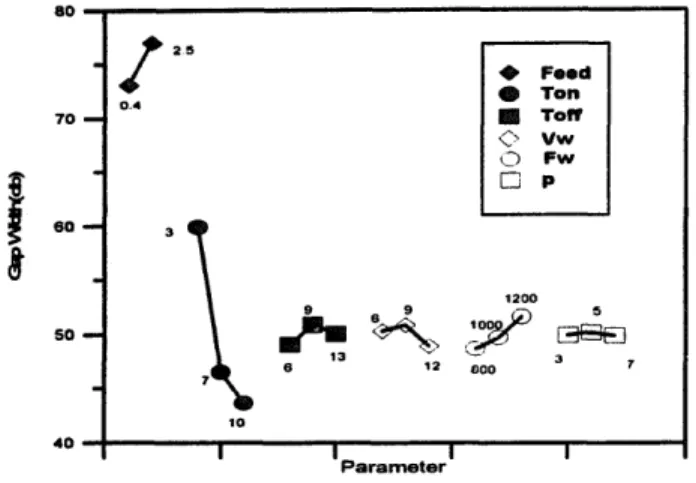
In order that the effects of machining parameters on machining performance can be seen more clearly, the data in Table 4 were plotted as shown in Figs. l-3. It is found from Fig. 1 that larger Feed and T,,,, results in larger MRR (HB) and from Fig. 2 larger To,, results in larger gap width (LB). For surface roughness (LB), larger T,,, result in a bigger crater on the surface (Fig.
3). No significant parameter was found on normal
discharge frequency ratio ( Y,), one of the reasons being that all parameters have little effect on Yc, whilst an- other more likely reason is that the effects of the error factor on the experimental results exceed those of all of these machining parameters. The trends of the influence of significant parameters on machining performance are summarized in Table 7.
3.3. Mathettzaticid model of tnachining petfomance By regression and correlation analysis, the mathe- matical models are obtained as follows:
Y mr = 18.5953~;~~ - 3.5215~;~: - 17.729?s,x2 - 5.4441x, + 5.7634.~~ + 3.2558 Y gap = 0.5097x, + 0.4406
Y
SR = 0.6ESlx; - 0.2698x2 + 0.5725 Yr4 = - 0.0148x,x-f + 9.4631~~~~ - 18.3852x,x, + 3,0855x, + 7.8901~~ - 1.7051 r,, = -6,3851x$ + 7.1263x,x$ - 10.5043s~s, + 10.5767x,x, - 0.0287where s, and _c~ are calculated by the following equa- tions:
x1 = log( Feed)/max( log( Feed)) x2 = log(L)/madog( T,,)) Because: 400 I Feed I 2500, then: 3 5 To, I 10 0.7657 5 xl I 1, 0.4771 I x1 < 1
Evidence shows that the mathematicc\l models derived by the regression analysis above are sufficiently precise to represent the real machining performance. Presented are the correlation coefficients of experimental data ( Yi) and data ( Yi) calculated by the regression mathematical model.
coef( Ynlr, Y;,) = 0.9883 coef( YgZ,p, yb;,,) = 0.9054 coef( yS,., Y:.,.) = 0.9652 coef( ‘I;il, Y;P) = 0.9598 coef( YV,, Y&) = 0.9601
Another correlation-coefficient analysis between var- ious machining performances was evaluated as given in Table 8, which table shows that a larger MRR will be accompanied by a bigger R,. A larger gap width will accompany a bigger R, and gap voltage and the total discharge frequency will increase whilst the gap voltage decreases. It is impossible to achieve a higher MRR and good surface phenomena simultaneously. Therefore, the optimum machining parameters setting will be pre- sented in the next section.
3.4. The optimization of tmchining putwmeters settings The feasible-direction method of non-linear program- ming was applied to find the optimum machining set-
491
Bold type indicates signiticant factors.
ting by seeking the maximum value of the objective er some constraint
software was adopted to solve a Referring to Fig. 4, first an
variable X0 is required to e specified as the starting point in the design space. eginning from this starting point, the variable vector i pdated iteratively by using the iterative form given by:
where Xl’ is the optimal variable solution and S“ is a usable-feasible search direction vector in the design space in no. y iteration. The scalar quantity Z* defines the distance that is desired to be moved in the direction S. The task is to find a search direction S which will reduce the objective function without violating the ac- tive constraint for some finite move. Any S vector which reduces the objective function is called the usable direction. Therefore, if the objective function is denoted by F(X), then the dot product of the gradient of F( X”). W(P) and S should be negative because the angle between them exceeds 90”. Mathematically. the usabL ity requirement becomes:
and a direction is called feasible if, for some small move in that direction, the active constraint will not be violated, i.e. the dot product of the gradient of g,(A% Vg,(P) and S must be non-positive. Here g,(X) is the constraint function. Thus:
Table 6
The influence of machining parameters on machining performance ________
Y n,r Y&lFi Y,15r Y,q I;, Yr
VW FW
P
-.
$ , Significant parameter; I+, sub-significant parameter.
In this paper, the feasible-direction non-linear pro- gramming method is applied to show how the optimal machining parameters setting which will result in the maximum metal removal rate under constraints (surface roughness and gap limitations for examples) can be obtained.
For illustration purposes, if it is required to maximize the metal r oval rate er the constraints of a gap width smaI or equal 0.42 mm, and the surface roucghness should be less or equal to 3.6 pm, then mathematically. this problem is expressed as:
Maximize: Y,,,r Subject to: Y,lll,,,, < 0.42 mm Y,, 5 3.0 pm (X, - 1 )(s, - 0.7675) I 0 (I-2 - 1)(X, - 0.4771) 5 0 The non-linear optimization yields:
Feed = 2.48 (mm min -_ ’ ) T,,, = 8.13 (0.1 ps)
240
I I
Parameter
1200 =+ ;gP &I 92 000 3 7 10 I I I I Parameter
Fig. 2. The influence of machining parameters on the gap width. In practice, if the following are chosen: Feed = 2.5 (mm min - I), T,, = 8 (0.1 ps), 7’,,.=9 (1.6 ps), VW= 9 m min-‘, Fw = 1000 gf, P = 5 kg cm -‘; then the actual experiments result in:
Y mr = 34.577 (mm3 min - ‘) Ygap = 0.403 (mm) YSr = 2.94 (pm) Yrq = 25.833 (kHz)
Y vg = 61.235 (V)
The metal removal rate is maximized whilst the gap width and surface roughness constraints are satisfied for a table feed of between 0.4 and 2.5 mm min - ’ and
7’,” between 3 and 10 (0.1 11s).
4. Conclusions
A methodology to determine the optimal machining parameters setting in WEDM was proposed. This methodology is not only time saving and cost effective but also efficient and precise in determining the machin- ing parameters. -30 600 + Fmmd @ Ton Tofr -60 ’ I I Parameter I I 1
The trends of the influence of parameters on machining performance -
Y ii- Y&up Y,, Y,y Y ‘P 1;
Feed /” \
T ml /’ 1 / c /
/“, Performance increasing as increasing Feed or T,,,,. \. Performance decreasing as increasing Feed or T,,,,.
Table S
Correlation coefficients between machining performance
Y-W 1 Y WP 0.2429 1 Y%, 0.4689 0.870 1 1 Y h 0.1594 - 0.7945 - 0.5898 1 Y ‘P -0.0754 0.8178 0.636 -0.9496 1 ---___~
It is found the table feed and pulse-on time have a significant influence on the metal removal rate, the gap voltage and the total discharge frequency, whilst the gap width and the surface roughness are mainly influ- enced by the pulse-on time. Therefore, adjusting the table feed and T,,, is an appropriate strategy to control the discharging frequency for the prevention of wire breakage. A larger table feed and a smaller T,,,, are recommended for the reason that a longer To,, will result in a higher value of R,. However, this does not take place for a larger Feed, although the table feed cannot be increased wit!lout constraints because of the risk of wire breakage.
In the future, the methodology presented in this paper could be applied to different machining condition such as different work material, electrode, etc. so as to build a CAPP expert system of WEDM with the goal of automation.
x2 vF(XO)
Fig. 3. The influence of machining parameters on the surface rough-
493
metal removal rate
surface roughness discharge frequency gap voltage
normal discharge frequency ratio
[I] G.N. Levy. IF. Magi, WEDM machinability compari5on of different steel grades. Ann. CIRP 39 (1) ( 1990) IS3 1 SS
VI PI Fl [71 PI PI
I. Ogata, Y. h4oko~~Im~t. Rcsidltal SITc\:, 011 4lHf‘;iiC m,rchincd b! uire electric disuhargc. Bnt. 9. Jap,m Sot. Prec. ng. 3 (A)(1 WEB
‘73 ‘7%.
R.E. Williams, K.P. Rajurkar. Study of Mire electrical divAirp machined surface charxterist0. 9. Mater. Proc. Tcchnol. 2S (1991) 137 138.
ziki. M. Ki4ii. Improvement of suft‘itcc’ roughnc45 111 Li1i-e
, in: Proce~di the International Symposium for Elec- achining. (IS Nagoya, 19S9, pp. 80-83.
D. Scott, S. Boyina, .P. Rajurkar. Analysis and optimization uf parameter combination in wire electrical discharge machming, Int. J. Prod. Res. 29 (11) (1991) 3159%3207.
M dke, Quality Engineering Using Robust Design, Pren- tic Englewood Cliffs, NJ, 19S9.
J. da, S. Tomishige, K. Tanaka, Ii. Yano. Evaluation of performance of WEDM by parameter design, in: Proceedings of the International Symposium for Electra-Machining. (ISFM-9) Nagoya, 1989. pp. 68 71.
P.J. Ross. Taguchi Techniques for Quality Engineering. Mc- ill, New York, 1989.
G.N. Vanderplaats. Numerical Optimization Techniques for En- gineering Qcsign: With Applications. McGraw-Hill. New York.