利用自組裝之修飾後微球體偵測微生物
102
0
0
全文
(2) Dedication. For my father and mother: I appreciate for their full supports on all my endeavors. Without my mother and father, I would not have been able to obtain a Master degree. For my sister: I appreciate her continual encouragements during my studies. Every time I lost my way, she brought me back to the right track. For my lovely family: They make me strengthen my faith and help me focus on my research.. I.
(3) Acknowledgement First of all, I want to thank my advisor Prof. James R. Carey, who gave me an excellent opportunity to join his group in 2010. This decision was the turning point in my life. Without him, I believe I will never have such a great life now. To me, Prof. Carey is an outstanding advisor, a loyal friend, and a gracious father. In the past three years in his lab, he taught me how to become a scientist (not only a chemist). “Dedicate yourself to science” he once told me. I will always remember these four words. Prof. Carey not only gave me the knowledge of science, but also helped me on everything in any way he could. My gratitude to him cannot be described by word. Thank you very much, Prof. Carey. Second, I want to thank Halladay (Yi Wei Chu), Cynthia (Bin-Syuan Huang), and Big Ben (Bo Yao Wang) for all the supports they gave me. I met Halladay in 2006 and since that time, we became good friends. Halladay is a very intelligent person. He always gave me many profound comments and those comments helped me to solve the problems I faced in my research. Halladay is also an outstanding model in our lab. His work ethic impressed me. I really learned a lot from him. Cynthia is a very talented chemist. She taught me how to do things in an efficient way. To me, Cynthia is like a big sister who always cares about everyone in the lab. When I was frustrated, she encouraged me to think positively. Her kind heart always cheered me up. Big Ben was a special undergraduate student in our lab. He always had curiosity to everything. Big II.
(4) Ben was a smart and skillful student. His knowledge of computer programs helped the lab on theoretical calculations, enzyme modeling, and figure sketching. I really enjoyed the time I did research with them. In addition, I want to thank all my undergraduate students for their hard works: Jason (Sheng-Jie Lin), Ben (Chen-Hao Chen), Elma (Hao-Ju Chou), Bentan (Jing-Teng Jeng), Johnny (Chang-Lin Hsieh), and Harry(Yang-Hung Chang). Finally, I want to thank Prof. Yeunghaw Ho, Prof. Yao-Yuan Chuang in our department, and Prof. Sodio C. N. Hsu at Kaohsiung Medical University for providing useful discussions and helpful assistance with my research. I thank National University of Kaohsiung and National Science Council for providing the financial funding and the experimental lab.. III.
(5) Table of Contents Dedication ......................................................................................................... I Acknowledgement ............................................................................................ II 摘要 ................................................................................................................... 1 Abstract ............................................................................................................. 2 Chapter 1 Introduction ...................................................................................... 4 Chapter 2 Background ...................................................................................... 7 Chapter 3 Research Materials ......................................................................... 11 3.1. Acronym ............................................................................................................... 11. 3.2. Reagents and buffers .......................................................................................... 12. Chapter 4 Synthesis and characterization of antibody coated microspheres .... 23 4.1. Modification of biotinylated antibody on the streptavidin coated. microspheres .................................................................................................................... 24 4.2. Decrease of the redundant signals from biotinylated antibody coated. microsphere using streptavidin blocking ................................................................... 32 4.3. Interaction between streptavidin conjugated horseradish peroxidase and. the detection antibody coated microsphere ............................................................... 41 Chapter 5 The aggregation of microspheres using antibody-antigen recognition or streptavidin-biotin interaction ...................................................................... 49 5.1. The aggregation of microspheres using antibody-antigen recognition ..... 50. 5.2. The aggregation of microsphere using streptavidin-biotin interaction ..... 54. Chapter 6 Multilayered attachment of microspheres on the antibody coated surface ............................................................................................................. 60 IV.
(6) Appendix Development of new chiral stationary phases by a simple in situ method ............................................................................................................. 71 Biography ........................................................................................................ 91. V.
(7) Table of Figures Figure 1. The illustration of the designed method which uses the self-assembled microsphere to detect the targets on a microtiter plate. ....................................... 5 Figure 2. The diagram of a typical flow cytometry. ........................................... 8 Figure 3. The structures of NHS-PEGn-Biotin with different PEG spacer arms. ......................................................................................................................... 14 Figure 4. The structure of streptavidin. Streptavidin has four biotin binding sites, which is shown in different colors. ................................................................... 15 Figure 5. The interactions between biotin and streptavidin. ............................. 15 Figure 6. The structure of biotin. ..................................................................... 15 Figure 7. The general procedure of Enzyme-linked immuno sorbent assay (ELISA). .......................................................................................................... 18 Figure 8. The blue color indicated that the antibody can bind to the microsphere through streptavidin-biotin interaction.. ........................................................... 28 Figure 9. The microspheres were coated with gradient concentrations of IL-7 DetA.. .............................................................................................................. 29 Figure 10. A plot of relative color values and the gradient concentration of DetA.. .............................................................................................................. 30 Figure 11. DetA coated microspheres were reacted with gradient concentrations of streptavidin.. ................................................................................................ 36 Figure 12. The illustration of the DetA that was pulled off by high concentration of free streptavidin in the solution.. .................................................................. 37 Figure 13. The biotin was blocked by gradient concentration of streptavidin... 38 VI.
(8) Figure 14. The illustration of the interaction between S-HRP and biotins on DetA coated microsphere. ................................................................................ 42 Figure 15. If the signal intensities in A and B are same, S-HRP is non-specifically binding to DetA. If the signal intensities in A and B are different, S-HRP is specifically binding to DetA. ............................................. 42 Figure 16. The scanned image of gradient concentration of S-HRP. ................ 44 Figure 17. The relative color plot of gradient concentrations of S-HRP on the DetA coated microspheres. ............................................................................... 45 Figure 18. The scanned images of A (with streptavidin) and B (without streptavidin).. ................................................................................................... 46 Figure 19. The plot for combining A and B in concentration of S-HRP versus absorbance at 450 nm. ...................................................................................... 47 Figure 20. The illustration of the formation of microsphere-based polymer using antigen-antibody as a bridge. .................................................................. 51 Figure 21. The microscope image of polymer by antigen-antibody interaction. ......................................................................................................................... 52 Figure 22. The microscope images of B-HRP modified microspheres and SμS.. ......................................................................................................................... 57 Figure 23. The microscope images of the self-assembly of the modified microspheres.. .................................................................................................. 58 Figure 24. The super-structured polymers of biotin coated microspheres. ....... 58 Figure 25. In order to mimic the antibody-antigen sandwich complex, the biotinylated antibody was coated on the surface to perform the experiments. .. 63 VII.
(9) Figure 26. The microspheres can attach to the streptavidin coated surface by the direct connection method.. ............................................................................... 66 Figure 27. The scheme illustrates the biotin-streptavidin reactions between microspheres and antibodies.. .......................................................................... 67 Figure 28. The conglomeration of biotin coated microspheres and concentrated S-HRP or poly-S-HRP. ..................................................................................... 68 Figure 29. The microscope images of the microsphere attachments on the antibody coated surface. ................................................................................... 69 Figure 30. The illustration of the reciprocity theory. ........................................ 73 Figure 31. The HPLC spectrum for N-(3, 5-dimethoxybenzoyl)leucine diethyl amide using homemade 3, 5-dinitrobenzoyl leucine column (column A). ........ 80 Figure 32. The HPLC spectrum of N-(3,5-dimethoxybenzoyl)leucine diethyl amide using homemade 3,5-dinitrobenzoyl leucine column B. ........................ 80 Figure 33. The HPLC spectrum of N-(3,5-dimethoxybenzoyl)leucine diethyl amide using homemade 3,5-dinitrobenzoyl leucine column (after wash with solvents)........................................................................................................... 81 Figure 34. The retention times of 3,5-OMe compound was increasing after the homemade DNBL column was washed with 2-propanol.. ................................ 84 Figure 35. The HPLC spectrum for 4-OMe compound using homemade DNBL column (wash by methanol).. ........................................................................... 85 Figure 36. The HPLC spectrum for 4-OMe compound using homemade DNBL column (wash by hexane)................................................................................. 87. VIII.
(10) Table of Tables Table 1. The product information of protein modified microspheres which were purchased from Bangs Lab. (Fishers, IN, USA). .............................................. 13 Table 2. The concentrations of IL-7 DetA that were used for the quantification of the surface saturation on SμSs. .................................................................... 27 Table 3. The relative color value of the DetA coated microspheres in the gradient concentrations. ................................................................................... 29 Table 4. The gradient concentrations of streptavidin which were used to block the excess biotin on the DetA coated microspheres. ......................................... 35 Table 5. The relative color values of No. A-R shown in Fig. 11. ...................... 36 Table 6. The relative color values of 10 gradient concentration of S-HRP. ...... 45 Table 7. The UV absorbance for gradient concentration of S-HRP. The experiment is repeated three times at once. ...................................................... 46 Table 8. The HPLC data which were collected from aminopropyl column. ..... 76 Table 9. The specific optical rotation of synthesized compounds which will be used to modify the chiral stationary phase (CSP). ............................................ 78 Table 10. The HPLC data for 10 selected samples using commercial DNBL column and homemade DNBL column by 20% 2-propanol in hexane at 2 mL/min. ........................................................................................................... 82 Table 11. The HPLC data for 10 selected samples using homemade DNBL column by 20% 2-propanol in hexane at 2 mL/min. ......................................... 83 Table 12. The HPLC data for 10 selective samples using the 1 st homemade 3,5-dinitrobenzoyl leucine column. .................................................................. 88 IX.
(11) Table 13. The HPLC data for 10 selective samples using the 2 nd homemade 3,5-dinitrobenzoyl leucine column. .................................................................. 88 Table 14. The HPLC data for 10 selective samples using the 3 rd homemade 3,5-dinitrobenzoyl leucine column. .................................................................. 89. X.
(12) 利用自組裝之修飾後微球體偵測微生物. 指導教授:蘇楷立 博士 國立高雄大學應用化學系研究所. 學生:林慧賢 國立高雄大學應用化學所. 摘要 在近十幾年中,疾病診斷偵測方法的改進一直著重在增加靈敏度、提昇偵測極限、 以及縮短診斷時間,而我的研究目的在於放大來自於抗體抗原錯合物的訊號,所使用的 訊號放大介質為卵白素修飾微球體以及生物素修飾微球體。其策略假說為如果目標物被 抗體修飾表面捕捉,將會觸發微球體間的聚合反應進而放大訊號達到視覺偵測。聚合反 應的觸發是來自於卵白素-生物素間的反應,此反應為俗知的強非共價鍵結之一;而視 覺偵測的達成主要是藉由自組裝的微球體,形成肉眼或是顯微鏡可觀察到的現像。此種 簡易的偵測方式將可能在少許的操作步驟下,就能運用在辨識微生菌的感染。. 關鍵字:細菌檢測、酵素免疫分析、抗體、卵白素、生物素、微球體、自組裝、聚 合物、肉眼辨識。. 1.
(13) Detection of microorganisms using self-assembly of functionalized microspheres. Advisor: Prof. James R. Carey Department of Applied Chemistry National University of Kaohsiung. Student: Hui-Hsien Lin Department of Applied Chemistry National University of Kaohsiung. Abstract In the recent decades, the improvement of the diagnostic detection method. is focusing on raising the sensitivity, enhancing the detection limit, and speeding up the diagnosis process. The purpose of my research is to amplify the initial signals from the antibody-antigen complexes. The signal enhanced media are the streptavidin modified microspheres and the biotin coated microspheres. The hypothesis of our strategy is if the analytes are detected by the antibody coated surface, polymerization of the microspheres is triggered and can amplify the initial signals and lead to visual detection. The polymerization is achieved by the streptavidin-biotin interaction, which is known to be one of the strongest 2.
(14) non-covalent bonds in nature. The visual detection of the targets is accomplished by the self-assembly of functionalized microspheres which can be observed by naked eye or a commercial microscope. This simple detection method may be used to identify infectious microorganisms in few steps.. Keywords: bacteria detection, antibody, streptavidin, biotin, microsphere, self-assembly. 3.
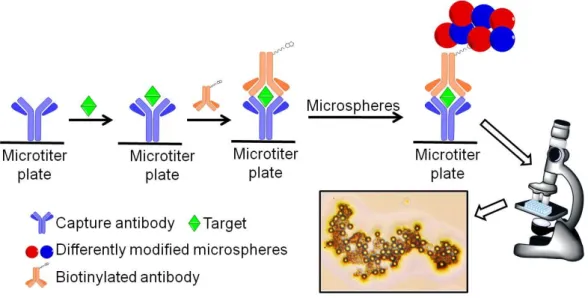
(15) Chapter 1 Introduction The blood culture technique is the gold standard method for clinical diagnosis of pathogen in the past few decades. The antibiotic data base is established for most common pathogens of bloodstream infections in infection-prone hospital departments. However, the blood culture technique has many disadvantages, such as the long-processing time, delayed results, poor sensitivity for some particular organisms, and the inhibition of antibiotic therapy.1,2 In order to improve the above drawbacks, we need to develop a faster and more accurate detection method. The development should focus on improving sensitivity, increasing the speed of diagnosis, and reducing the inhibitory effects of antibiotics. In this study, a signal amplification method that could significantly decrease the detection and identification time of pathogenic microorganisms is investigated by various approaching ways. The initial signal from targets is amplified using self-assembly of microspheres and protein aggregations. The assembled. microspheres. and. protein. aggregations. are. formed. using. streptavidin-biotin interaction, which is known to be one of the strongest non-covalent bonds in nature. Here, the strategies to amplify the signals are divided into three categories: the aggregation of antibody modified microspheres, the layered-by-layered assembly of streptavidin/biotin modified 4.
(16) microspheres, and the streptavidin biotinylated protein network.3 All the above strategies can amplify the initial signals, either by color changing or by polymer forming. The results can be observed by naked eyes or commercial optical microscope (see Fig. 1).. Figure 1. The illustration of the designed method which uses the self-assembled microsphere to detect the targets on a microtiter plate.. In chapter 3, the research materials that used in this study were listed in the detail information. In chapter 4, modification of biotinylated antibody on the streptavidin coated microspheres was described in section 4.1. The process of synthesis of antibody coated microsphere was assured. Decreasing of the redundant signals from biotinylated antibody coated microsphere using streptavidin blocking was discussed in section 4.2. The excess biotin on the DetA coated microsphere was blocked by gradient concentration of streptavidin. The interactions between streptavidin conjugated horseradish peroxidase and the detection antibody coated microsphere were discussed in section 4.3. The 5.
(17) S-HRP was interacted with DetA by specific binding. In chapter 5, the aggregation. of. microspheres. using. antibody-antigen. recognition. or. streptavidin-biotin interaction was described. The microspheres can form the aggregations by antibody-antigen recognitions or streptavidin-biotin interactions. In chapter 6, multilayered attachment of microspheres on the antibody coated surface was described. The initial signals from the targets were amplified by the attachment of the self-assembled microspheres on the surface. In appendix, the development of new chiral stationary phases by a simple in situ method was described. We developed a simple in situ method to synthesize a chiral HPLC column and we used it to separate 50 chiral compounds.. Reference (1) Peters, R. P. H.; Agtmeal, M. A.; Danner, S. A.; Savelkoul, P. H. M.; Vandenbroucke-Grauls, C. M. J. E. Lancet. Infect. Dis. 2004, 4, 751-760. (2) Maltais, A.; Boye, J. I. Bead-based arrays: multiplex analyses. In Green Technologies in Food Production and Processing [Online]; Boye, J. I.; Arcand, Y.; Springer, NY, 2012; Part 5, pp 495-518. (3) Chu, Y. W.; Wang, B. Y.; Lin, H.-S.; Lin, T.-Y.; Hung, Y.-J.; Engebretson, D. A.; Lee, W.; Carey, J. R. Chem. Comm. 2013, 49, 2397-2399.. 6.
(18) Chapter 2 Background As the health care is becoming a popular issue in the world, the diagnostic technique is also becoming a hot research field for scientists. The blood culture bottle is the gold standard for clinical diagnosis for decades, but it still has some drawbacks that needed to be overcome, such as time-consuming, intensive labor works, and the inhibition of antibiotic therapy. 1 Enzyme-linked immuno sorbent assay (ELISA) is another technique that is often used to detect bacteria in human blood. However, the poor sensitivity of ELISA makes it hard to detect low concentration of target proteins. 2-4 Simple, rapid, and high sensitive and selective detection methods are needed to streamline the diagnostic process. Microspheres are one of the helpful tools that can improve the performance of the current detection methods for pathogen diagnosis. The high surface area of a microsphere allows it to carry more antibodies or recognition reagents. Different antibody coated microspheres can exist in the same container to perform multiple detections of antigens at the same time. Flow cytometry is usually used to work with microspheres because it can detect thousands of particles per second. The principle of flow cytometry is briefly described here (see Fig. 2).5,6 In a typical multiplexed analysis of dyed encoded microspheres, a sample stream (usually 10 μm in diameter, 10 μm in height) will pass through a laser beam zone which will excite the encoded fluorescence in the microspheres. 7.
(19) When the encoded fluorescence is excited by two laser lights, it will generate two signals: (1) a red laser beam (635 nm) will excite the different encoded dyes in the microspheres and it will distinguish the specific microsphere set; (2) a second laser beam (532 nm) will excite the green fluorescence on the detection antibody and it will quantify the concentration of the analytes on the antibody coated microspheres. This simultaneous detection of microspheres will allow tens of thousands cells or particles be analysis per second. 6. Figure 2. The diagram of a typical flow cytometry. A sample stream of dye encoded microsphere will flow through a laser beam zone which will distinguish the specific microsphere set and quantify the analyte concentration by two different lasers light (635 nm and 532 nm).. Although the flow cytometry can perform multiplexed detection of targets in a short time, the expensive instrument is non-available to all people, especially in resource-poor countries. However, except using flow cytometry to detect the signal from antibody coated microspheres, there are still many other 8.
(20) methods that use microspheres as a signal generating medium (SGM), such as microfluidic devices, electrochemical microchips, colorimetric immunoassays, and self-assembled assays.7-9 In those microsphere based detection methods, the self-assembled assays are much simpler than other methods. The required instrument in the self-assembled assays is a microscope which can be used to observe the microsphere based polymers on a surface. In this study, we focus on the development of a self-assembled assay that uses modified microsphere to generate a visual detection signal of the target on a microtiter plate.. References (1) Peters, R. P. H.; Agtmeal, M. A.; Danner, S. A.; Savelkoul, P. H. M.; Vandenbroucke-Grauls, C. M. J. E. Lancet. Infect. Dis. 2004, 4, 751-760. (2) Riedel, S.; Carroll, K. C.; J. Infect. Chemother. 2010, 16, 301–306. (3) Klouche, M.; Schro¨der, U.; Clin. Chem. Lab. Med. 2008, 46, 888–908. (4) Venkatesh, M.; Flores, A.; Luna, R. A.; Versalovic, J. Expert Rev. Anti–Infect. Ther. 2010, 8, 1037–1048. (5) Kellar, K. L.; Iannone, M. A. Exp. Hematol. 2002, 30, 1227-1237. (6) Maltais, A.; Boye, J. I. Bead-based arrays: multiplex analyses. In Green Technologies in Food Production and Processing [Online]; Boye, J. I.; Arcand, Y.; Springer, NY, 2012; Part 5, pp 495-518. (7) Lee, J.; Lcoz, K.; Roberts, A.; Ellington, A. D.; Savran, C. A. Anal. Chem. 2010, 82, 197-202.. 9.
(21) (8) Stephen, M.; Wayne, S.; Mei, L.; Stephen, C.; Donald, F. Adv. Mater. 2000, 12, 147-150. (9) Li, M.; Wong, K. K. W.; Mann. S. Chem. Mater. 1999, 11, 23-26.. 10.
(22) Chapter 3 Research Materials 3.1 Acronym ELISA:. Enzyme-linked immuno sorbent assay. CapA:. Capture antibody, as known as primary antibody. DetA:. Detection antibody, as known as biotinylated antibody or secondary. antibody S:. Streptavidin. BSA:. Bovine serum albumin. SHRP:. Streptavidin conjugated horseradish peroxidase. TMB:. 3,3’,5,5’-tetramethylbenzidine. SμS:. Streptavidin coated microsphere. BμS:. Biotinylated microsphere. PBS:. Phosphate buffered saline. HABA:. 4’-hydroxyazobenzene-2-carboxylic acid. NHS-PEG:. N-hydroxylsuccinimide (NHS) functionalized polyethylene glycol. (PEG), we use NHS-PEG4-Biotin and NHS-PEG12-Biotin in this study 3,5-DNBL: HPLC:. 3,5-dinitrobenzoyl leucine. High-performance liquid chromatography. 11.
(23) 3.2 Reagents and buffers Buffers PBS1 was prepared by mixing 0.1 M NaH2PO4 (Sigma-Aldrich, St. Louis, MO) and 0.1 M Na2HPO4 (Sigma-Aldrich, St. Louis, MO) and the pH was adjusted to 7.4. PBS2 was prepared from PBS1 with 1% BSA (w/v) and 0.88% NaCl (J. T. Baker, Phillipsburg, NJ) (w/v) at pH 7.4. PBS2 was used to wash and prepare the suspension solution of microspheres. PBS1 and PBS2 were using in all the microsphere experiments. PBS3 (UniRegion Bio-Tech, Taiwan) was used to prepare the diluted buffer and wash buffer. PBS3 was diluted 10 fold for preparing other buffers. PBS4 was prepared from 10 fold diluted PBS3 with 0.05% Tween 20 (Sigma-Aldrich, St. Louis, MO) (v/v) and it was used for washing steps. PBS5 was prepared from 10 fold diluted PBS3 with 1% BSA (w/v) and it was used to dilute the antigen in ELISA kit. PBS6 was prepared from 10 fold diluted PBS3 with 1% BSA (w/v) and 0.01% Tween 20 (v/v) and it was used to dilute SHRP and BBSA. PBS 7 was prepared from10 fold diluted PBS3 with 5% BSA (w/v) and it was used to block the microtiter plate. PBS3, PBS4, PBS5, PBS6, and PBS7 were using in all the ELISA, HABA, Bradford protein assay, and all the experiments on the DetA coated surface. PBS8 was prepared by mixing 140 mM of NaCl, 10 mM of KCl (Showa Chemical, Tokyo, Japan), 8 mM of Na 2HPO4, and 2 mM of KH2PO4 at pH 7.4. PBS9 was prepared from PBS8 with 1% BSA (w/v) and 0.01% Tween 20 (v/v). PBS10 was prepared from PBS8 with 0.05% Tween 20 (v/v). 12.
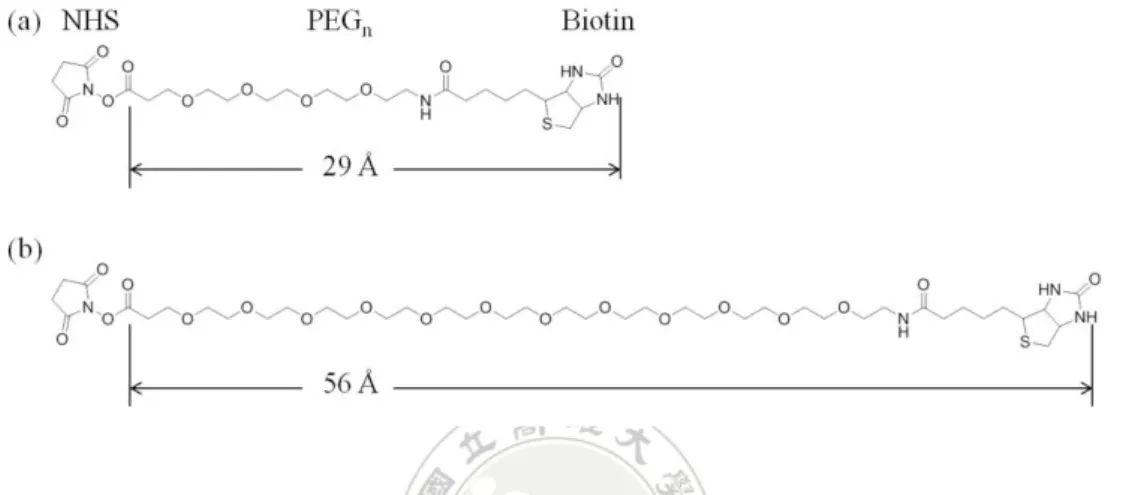
(24) Microspheres All protein. modified. microspheres. were. purchased. from. Bangs. Laboratories (Fishers, IN, USA). The microspheres were made by polystyrene and modified with streptavidin, biotin, or primary amine group. The detail product information about the microspheres we used in this study is listed in Table 1. Table 1. The product information of protein modified microspheres which were purchased from Bangs Lab. (Fishers, IN, USA). Product name Particle radius Product number SμS 15.68 μm CP01N/9052 SμS 5.60 μm CP01N/8179 Streptavidin coated magnetic 6.20 μm CM01N/8711 microsphere SμS 4.95 μm CP01N/9846 SμS 0.97 μm CP01N/10021 Biotin dyed microsphere 0.22 μm CP10F/8909 NH2 modified microsphere 0.56 μm PA03N/5306. Biotinylated reagents NHS-PEG4-Biotin and NHS-PEG12-Biotin were. used to modified. microspheres with biotin on the surface. The structures of these two reagents are shown in Fig. 3. Both reagents were purchased from Pierce (Rockford, IL, USA). N-Hydroxysuccinimide (NHS) ester is a common biotinylation reagent. The NHS group can react with primary amine (-NH2) groups by nucleophilic attack and form an amide bond in the pH 7-9 buffers. The polyethylene glycol 13.
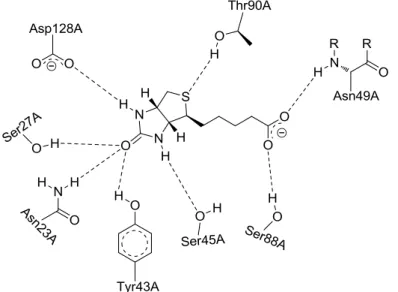
(25) (PEG) can have different lengths of spacer arm. Here, we used PEG4 (29 Å ) and PEG12 (56 Å ) with different spacer arm lengths. The hydrophilic PEG group can allow the biotinylation reagent react in aqueous environment with proteins, cells, or other hydrophilic particles.. Figure 3. The structures of NHS-PEGn-Biotin with different PEG spacer arms. (a) NHS-PEG4-Biotin (b) NHS-PEG12-Biotin. Streptavidin and biotin Streptavidin was purchased from two different companies:. Pierce. (Rockford, IL, USA) and Jackson ImmunoResearch (West Grove, PA, USA). Biotin was purchased from Pierce (Rockford, IL, USA). Streptavidin is a 52,800 Dalton tetrameric protein which is purified from Streptomyces avidinii (the structure is shown in Fig. 4, PDB ID:. 1SWE). It has an extremely high affinity. to biotin (see Fig. 5), which is a water-soluble B-complex vitamin (vitamin B7, see Fig. 6. The dissociation constant (Kd) of the biotin-streptavidin complex is approximately 10-14 mol L-1 at pH 5. The streptavidin-biotin interaction is known to be one of the strongest non-covalent bonds in nature. 14.
(26) Figure 4. The structure of streptavidin. Streptavidin has four biotin binding sites, which is shown in different colors. The Protein Data Bank (PDB) ID is 1SWE.. Figure 5. The interactions between biotin and streptavidin. The dissociation constant (Kd) of the biotin-streptavidin complex is approximately 10-14 mol L-1 at pH 5.. Figure 6. The structure of biotin. 15.
(27) Streptavidin is not the only protein that can bind to biotin with high affinity. Avidin is another well-known biotin-binding protein, which has very similar properties with streptavidin. Originally, they were both isolated from egg white and avidin has 30% sequence identical to streptavidin. They have almost identical secondary, tertiary and quaternary structure. Differentially, avidin has a higher affinity to biotin (Kd ~ 10-15M) compared to streptavidin. Avidin is glycosylated, positively charged, and has pseudo-catalytic activity. The seudo-catalytic activity of avidin can enhance the alkaline hydrolysis of an ester linkage between biotin and a nitrophenyl group and make it has higher affinity to biotin.1 Notably, an important reason that we used streptavidin and not avidin is because avidin has a higher tendency for self-aggregation, which may cause background or noise. When biotin is conjugated to other molecules, streptavidin is a better biotin-connection binder.1 On the contrary, avidin prefers to react with free, unconjugated biotin. Streptavidin is lacked of any carbohydrate modification and has a near-neutral pI (pI ~5), it has the advantage of much lower nonspecific binding than avidin. Deglycosylated avidin (NeutrAvidin) is more comparable to the size, pI and nonspecific binding of streptavidin. 1. Commercial ELISA kits IL-7 ELISA kit 50 μL of the IL-7 CapA was diluted in 10 mL of 10 fold diluted PBS3 and 100 μL of solution was distributed to each well of polystyrene microplate. The 16.
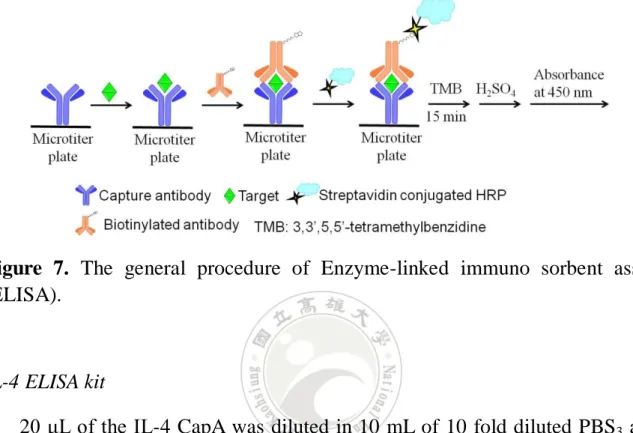
(28) plate was covered and incubated overnight at 4°C. After 12 h (overnight), the plate was washed twice with 400μL of PBS4. Then the wells were blocked with 250 μL of PBS7 for 2 h at rt. After 2 h later, the plate was drained and dried for 24 h at rt in the hood. The dried microplate was ready to use and it will be stored in a sealed bag at 4°C for at least 2 weeks. One vial of IL-7 antigen (164 pg) was diluted with 0.82 mL of PBS5. The concentration of the IL-7 antigen was 200 pg mL-1. The concentration of antigen was diluted and ranged from 200 to 3.125 pg mL-1. The gradient concentration of antigen was used to calculate the calibration curve of the IL-7 ELISA lit. 100 μL of various concentrations of antigen were dispensed to corresponding wells. One vial of DetA was restored with 0.55 mL of 0.1% azide (w/v) in 10 fold diluted PBS3. 100 μL of the restored DetA was diluted with 5 mL PBS5 for one plate. 50 μL of the diluted DetA was distributed in each well. The antigen and the DetA were co-incubated for 2 h at rt. After 2 h later, each well was washed three times with 400 μL of PBS4. 5 μL of 1 mg mL-1 S-HRP was diluted in 500 μL of PBS6 and the concentration of the diluted S-HRP was 1.5 x 10⁻⁴ mg mL-1. 100 μL of 1.5 x 10⁻⁴ mg mL-1 S-HRP was added in each well and incubated for 20 min at rt. The wells were washed three times with 400 μL of PBS4. Finally, 100 μL of ready-to-use TMB was added per wells and reacted for 15 min in dark at rt. After 15 min, the reaction was stopped by the addition of 100 μL of 1 M H2SO4 in each well. The color of the solution will change from blue to yellow after 1 M H2SO4 was added. The. 17.
(29) absorbance of each well was measured at 450 nm by using a commercial ELISA reader. The full procedure is described in Fig. 7.. Figure 7. The general procedure of Enzyme-linked immuno sorbent assay (ELISA).. IL-4 ELISA kit 20 μL of the IL-4 CapA was diluted in 10 mL of 10 fold diluted PBS3 and 100 μL of solution was distributed to each well of polystyrene microplate. The plate was covered and incubated overnight at 4°C. After 12 h (overnight), the plate was washed twice with 400μL of PBS4. Then the wells were blocked with 250 μL of PBS7 for 2 h at rt. After 2 h later, the plate was drained and dried for 24 h at rt in the hood. The dried microplate was ready to use and it will be stored in a sealed bag at 4°C for at least 2 weeks. One vial of IL-4 antigen (32.9 pg) was diluted with 0.94 mL of PBS5. The concentration was 35 pg mL-1. To calibrate a gradient concentration of antigen, reducing the concentration with diluted factor 2, so the concentration of antigen was ranged from 35 to 1.09 pg mL-1. 100 μL of different concentrations of 18.
(30) antigen were added to corresponding wells and incubated for 2 h at rt. After 2 h, the plate was washed three times with 400μL of PBS4. One vial of DetA was restored with 0.55 mL of 0.1% azide (w/v) in 10 fold diluted PBS3. 100 μL of the restored DetA was diluted with 5 mL PBS5 for one plate. 50 μL of the diluted DetA was distributed in each well and incubated for 1 h at rt. After 1 h, the plate was washed three times with 400μL of PBS4. 5 μL of 1 mg mL-1 S-HRP was diluted in 500 μL of PBS6 and the concentration of the diluted S-HRP was 1.5 x 10⁻⁴ mg mL-1. 100 μL of 1.5 x 10⁻⁴ mg mL-1 S-HRP was added in each well and incubated for 20 min at rt. The wells were washed three times with 400 μL of PBS4. Finally, 100 μL of ready-to-use TMB was added per wells and reacted for 15 min in dark at rt. After 15 min, the reaction was stopped by the addition of 100 μL of 1 M H2SO4 in each well. The color of the solution will change from blue to yellow after 1 M H2SO4 was added. The absorbance of each well was measured at 450 nm by using a commercial ELISA reader. The IL-7 and IL-4 ELISA kits were purchased from Gen-Probe, Besancon Cedex, France.. Commercial HABA kit HABA (4´-hydroxyazobenzene-2-carboxylic acid) assay (Pierce, Rockford, IL, USA) is used to do the biotin quantification in a solution. HABA is a dye that it can bind to avidin in the reagent solution. When there is any biotin or biotinylated protein exist in a sample, HABA will be replaced by the biotin or biotinylated protein. At the time HABA is displaced, the absorbance of the 19.
(31) solution will changed at 500 nm. By calculating the proportional reduction of UV-vis absorbance, the amount of biotin in the sample can be measured. The general procedure of HABA assay is briefly described as follows. HABA/Avidin complex was equilibrium to rt before doing the biotin quantification. 100 μL of DI H2O was added to one vial of HABA/Avidin complex and the solution was welled mixed by pipette. 800 μL of PBS3 was added into a 1 mL cuvette and this was the baseline of the UV-vis spectrometer. 100 μL of HABA/Avidin complex was added into the previous 800 μL of PBS3 and the solution was welled mixed. The absorbance of HABA/Avidin in PBS3 was measured at 500 nm (A1). 100 μL of the biotinylated sample was added into the HABA/Avidin-PBS3 solution and welled mixed by pipette. The absorbance of the biotinylated sample in HABA/Avidin-PBS3 was measured at 500 nm (A2). We can calculate the quantity of biotin in a sample by the following calculations:. 1.. 2. 3.. (b = 1 cm, the light path length). 4.. 20.
(32) Commercial Bradford protein assay The Bradford protein assay (Bio-Rad, Hercules, CA, USA) can quantify the protein concentration by measuring the absorbance of the standards and a sample. The acidic solution of Coomassie® Brilliant Blue G-250 dye will react to proteins so the absorbance will shift from 465 nm to 595 nm. Using the calibration curve from the standards, the concentration of sample protein can be calculated. The general procedure of Bradford assay is briefly described as follows. 180 μL of 2 mg mL-1 BSA standard (Pierce, Rockford, IL, USA) was added into 220 μL DI water (BSA1). The concentration of BSA1 was 0.9 mg mL-1. 245 μL of 0.9 mg mL-1 BSA1 was added into 105 μL DI water (BSA2). The concentration of BSA2 was 0.63 mg mL-1. 210 μL of 0.63 mg mL-1 BSA2 was added into 90 μL DI water (BSA3). The concentration of BSA3 was 0.44 mg mL-1. 175 μL of 0.44 mg mL-1 BSA3 was added into 75 μL DI water (BSA4). The concentration of BSA4 was 0.31 mg mL-1. 105 μL of 0.31 mg mL-1 BSA4 was added into 45 μL DI water (BSA5). The concentration of BSA5 was 0.22 mg mL-1. 6 mL of the dye reagent was diluted with 24 mL of DI water. 5 mL of diluted dye was added into 100 μL of each BSA standard. At the same time, 5 mL of diluted dye was added into 100 μL of the diluted sample. All the solutions were vortexed for few seconds and then sit in the hood for 10 min at rt. The absorbances of all the solutions were measured at 595 nm after 10 min later. The absorbances of BSA standards were made into a calibration curve. The. 21.
(33) concentration of the sample was calculated using the calibration curve from BSA standards.. References (1) McMahon, R. J. Avidin-Biotin Interaction: Methods and Applications, Methods in Molecular Biology; Humana Press: Totowa, NJ, 2008; 418, pp 35-50.. 22.
(34) Chapter 4 Synthesis and characterization of antibody coated microspheres. Abstract The high surface area of microsphere makes it a good tool for carrying the antibody or antigen in the immunoassays. Using a commercial streptavidin coated microsphere, the modification of antibody on the microsphere is simple and fast. Compare to normal ELISA, the antibody coated microsphere can lower the detection limit and improve the performance of the normal immunoassay. In this chapter, we will try to modify the antibodies on the commercial available microspheres and study the performances of the modified microspheres.. 23.
(35) 4.1 Modification of biotinylated antibody on the streptavidin coated microspheres. Introduction Compare to the planar immunoassays, nanoparticle or microsphere based suspension arrays are a more powerful detection methods. The advantages of the suspension array are low sample requirement, short operation time, low cost, and easy to use.1,2 The important role in the suspension array is microsphere. The high surface area of microsphere can allow it to carry extensive biomolecules, such as antibodies, antigens, oligonucleotides, or DNA strands. 3-5 The large loading capacity of microsphere makes the suspension array more sensitive and selective. In recent years, many research groups have noticed the potential of microspheres and many immunoassays have been developed using microspheres.6-10 Baba et al. presented an immuno-pillar chip using microsphere as an antibody carrier to detect the target in the immunoassay. 6 In brief, the microchip substrate was a cyclic olefin copolymer and had rectangular microchannels. The anti-human CRP coated beads was mixed within the hydrogel pillars. The assay procedure was simple. The sample solution was injected into the microchannels and incubated for a short time. After incubation, the channels would be washed by PBS three times. The fluorescent-labeled secondary antibody solution was added in the microchannels and incubated for a short time. After incubation, the channels were washed with PBS three times. Finally, using an inverted 24.
(36) fluorescence microscope detected the fluorescence signal. The CRP sandwich immunoassay was performed as a model sample. The incubation time was set differently: 1 min, 3 min, and 5 min, which corresponded to total assay time of 4 min, 8 min, and 12 min. The fluorescence signals rose as CRP concentration increased. The limit of detection (LOD) for all different incubation times was ~100 pg mL-1. Because the pillars consisted of pores, antigen and antibody were diffused into the pillars. By using FITC-labeled antibody, they estimated the diffusion rate of antibody was 0.4 μm s-1. Also, the assay was carried out with AFP, PSA, and multiplex samples. The results were similar. This developed immuno-pillar chip was easy-to-use and only needed a trace amount of sample. In this section, the detection antibody was coated on the microsphere using streptavidin-biotin interaction. The commercial microsphere was modified with streptavidin which can react with biotin on the detection antibody. The S-HRP was used to generate the color signals from the detection antibody coated microspheres. The blue color signals can be used to quantify the amount of detection antibody which was bound on the SμS.. Experimental section 100 μL of SμS suspension solution (the original concentration of SμS suspension was 12.5 mg beads / mL stored buffer) was taken and centrifuged at 10,000 g for 5 min to remove the stored buffer. 300 μL of PBS2 was used to wash the microsphere three times. The microsphere was resuspended in 300 μL 25.
(37) of PBS2 and the concentration of the microsphere suspension was 5 mg mL-1. The saturated volume of biotinylated antibody on a SμS was 2.4 μg / mg beads.11 180 μL of 60 μg mL-1 IL-7 DetA was added into the microsphere suspension and incubated for 8 h at 4°C. After 8 h incubation, the microsphere suspension was washed three times with 300 μL of PBS2 by centrifuge at 10,000 g. The waste buffer will be removed after every wash step and the microsphere was re-suspended in a fresh buffer. 100 μL of 1.5 x 10⁻⁴ mg mL-1 S-HRP was added into the microsphere suspension and incubated for 20 min at rt on a shaker (v = 160 rmp). After 20 min, the microsphere was washed three times with 300 μL of PBS2. Finally, 100 μL of ready-to-use TMB was added per wells and reacted for 15 min in dark at rt. This experiment was the initial trial to assure the biotinylated antibody can actually bind to the SμS. A control experiment was also performed to assure the color generated from TMB was not because the non-specific binding of S-HRP in the eppendorf. 100 μL of SμS suspension solution was taken and centrifuged at 10,000 g for 5 min to remove the stored buffer. 100 μL of PBS2 was used to wash the microsphere three times. The microsphere was resuspended in 300 μL of PBS2 and the concentration of the microsphere suspension was 5 mg mL-1. No antibody was added in this microsphere suspension. 100 μL of 1.5 x 10⁻⁴ mg mL-1 S-HRP was added into the microsphere suspension and incubated for 20 min at rt on a shaker (v = 160 rmp). After 20 min, the microsphere was washed three times with 300 μL of PBS2. Finally, 100 μL of ready-to-use TMB was added per wells and reacted for 15 min in dark at rt. 26.
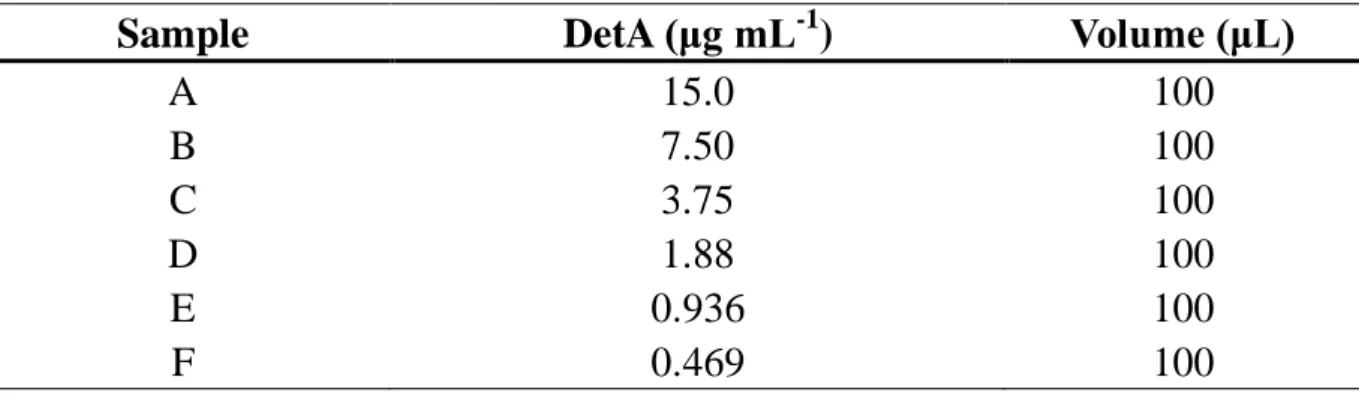
(38) Additionally, the concentration of DetA on the microsphere was changed to gradient in the following experiment. The gradient concentrations of DetA can allow us to understand the optimized condition of the surface saturation on a SμS. 20 μL of SμS suspension solution was added in 6 clean eppendorfs and centrifuged at 10,000 g for 5 min to remove the stored buffer. The microspheres were washed three times with 100 μL of PBS2. The microsphere was resuspended in 50 μL of PBS2 and the concentration of the microsphere suspension was 5 mg mL-1. The microspheres were incubated with 100 μL of various concentrations of DetA for 8 h at 4°C (see Table 2). After 8 h, the microspheres were washed three times with 100 μL of PBS2. 100 μL of 1.5x10⁻⁴ mg mL-1 of S-HRP was added to the microsphere suspensions and allowed it to shake for 20 min at rt. After 20 min, the microspheres were washed three times with 200 μL of PBS4. Finally, 100 μL of TMB was added into the microspheres and allowed it to sit for 15 min at rt in the dark. Table 2. The concentrations of IL-7 DetA that were used for the quantification of the surface saturation on SμSs. Sample DetA (μg mL-1) Volume (μL) A 15.0 100 B 7.50 100 C 3.75 100 D 1.88 100 E 0.936 100 F 0.469 100. 27.
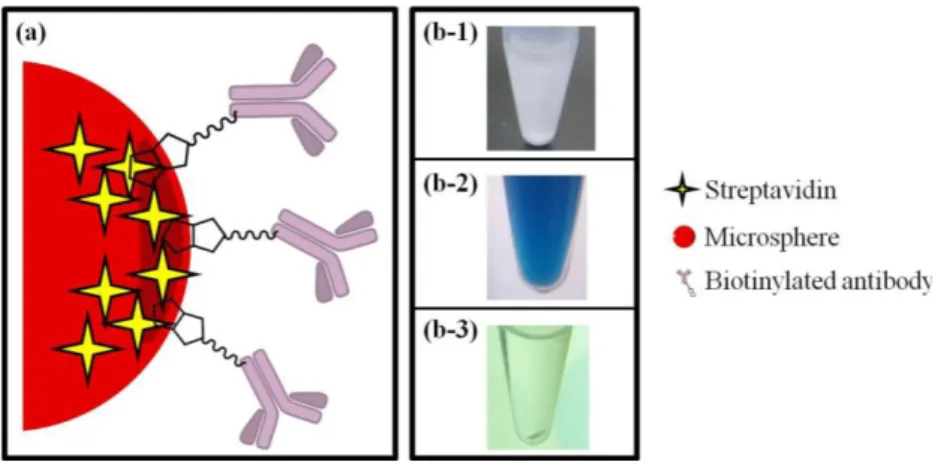
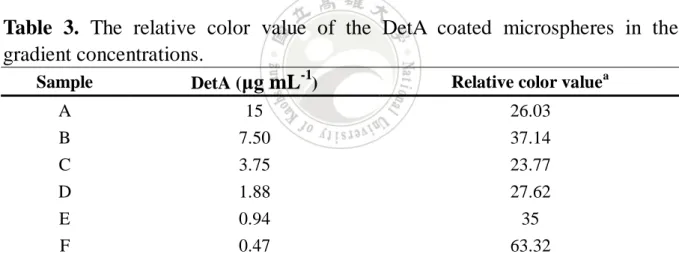
(39) Result and discussion The result of the first trial of DetA coated microspheres is shown in Fig. 8. The S-HRP was used to generate the signals from DetA. The blue color indicated that the DetA can bind to the microsphere surface through streptavidin-biotin interaction. The control experiment showed no color which indicated that there was no non-specific binding of S-HRP either on SμS or in the eppendorf tube.. Figure 8. The blue color indicated that the antibody can bind to the microsphere through streptavidin-biotin interaction. (a) The antibody was attached to the microsphere surface through streptavidin-biotin interaction. (b-1) before the microsphere was reacted with DetA and S-HRP (b-2) after the microsphere was coated with DetA and then reacted with S-HRP (b-3) the control experiment.. The result of gradient concentration of antibody is shown in Fig. 9 and Fig. 10. The blue colors were analyzed by ImageJ, which can measure the relative color values [(R+G+B)/3] in the figures. The relative color values are listed in Table 3. The relative color value is small when the blue color is deep. The data in Fig. 10 indicated that the microsphere surface was saturated when the concentration of DetA exceeded 1.88 μg mL-1. Although from the Product 28.
(40) TechNote,11 the saturated volume of biotinylated antibody on a SμS was 2.4 μg / mg beads. This saturated value is only an average number for the products in Bangs Lab (Fishers, IN, USA). Our data showed the saturation volume of IL-7 DetA was 0.8 μg for 1 mg of SμSs.. Figure 9. The microspheres were coated with gradient concentrations of IL-7 DetA. The results were scan by a desk scanner (Epson J232C, 600 dpi) and analyzed by ImageJ. Table 3. The relative color value of the DetA coated microspheres in the gradient concentrations. -1 Sample Relative color valuea DetA (μg mL ). a. A B C. 15 7.50 3.75. 26.03 37.14 23.77. D E F. 1.88 0.94 0.47. 27.62 35 63.32. The colors were analyzed by ImageJ, which was free software online. The color was. selected using a digital zone with constant size. The smaller the value, the deeper the color.. 29.
(41) Relative color value [(R+G+B)/3]. 80 60 40. 20 0 0. 2. 4. 6 8 10 DetA (μg/mL). 12. 14. Figure 10. A plot of relative color values and the gradient concentration of DetA. The data indicates that 1.88 μg mL-1 was enough to saturate the surface of microsphere. The outlier of (7.5, 37.14) was removed in this figure.. Conclusion The SμS can react with antibody through the streptavidin-biotin interaction. The surface of SμS can be saturated by 0.8 μg of IL-7 DetA / mg SμS. The DetA coated microsphere did not have a background signal when S-HRP was added as a signal generating medium. The data presented in this section suggest that antibody coated microspheres can be as a bio-molecule carrier. The synthesized process of antibody coated microspheres was a simple two-steps process: mix (incubate) and wash.. References (1) Wang, L.; Cole, K. D.; He, H.-J.; Hancock, D. K.; Gaigalas, A. K.; Zong, Y. J. Proteome Res. 2006, 5, 1770-1775. (2) Schwenk, J. M.; Gry, M.; Rimini, R.; Uhlén, M.; Nilsson, P. J. Proteome Res. 2008, 7, 3168-3179. (3) Yang, S.-Y.; Lien, K.-Y.; Huang, K.-J.; Lei, H.-Y.; Lee, G.-B. Biosens. 30.
(42) Bioelectron. 2008, 24, 855-862. (4) Yu, H.-W.; Kim, I. S.; Niessner, R.; Knopp, D. Anal. Chim. Acta 2012, 750, 191-198. (5) Tian, J.; Zhou, L.; Zhao, Y.; Wang, Y.; Peng, Y.; Zhao, S. Talanta, 2012, 92, 72-77. (6) Ikami, M.; Kawakami, A.; Kakuta, M.; Okamoto, Y.; Kaji, N.; Tokeshi, M.; Baba, Y. Lab Chip 2010, 10, 3335-3340. (7) Li, H.; Leulmi, R. F.; Juncker, D. Lab Chip 2011, 11, 528-534. (8) Fujii, R.; Kitaoka, M.; Hayashi, K. Nat. Protoc. 2006, 1, 2493-2497. (9) Lee, J.; Icoz, K.; Roberts, A.; Ellington, A. D.; Savran, C. A. Anal. Chem. 2010, 82, 197-202. (10) Hsu, H.-Y.; Huang, Y.-Y. Biosens. Bioelectron. 2004, 20, 123-126. (11) Bangs Laboratories; Adsorption to Microspheres; TechNote 204: Fishers, IN, April, 2008.. 31.
(43) 4.2 Decrease of the redundant signals from biotinylated antibody coated microsphere using streptavidin blocking Introduction The sandwich ELISA is a common detection method used in the general immuno-research laboratories.1 The principle of the sandwich ELISA is simple: the target is first captured by a CapA modified substrate and then detects by a DetA (sandwich complex, see Fig. 7 in chapter 3). This CapA-target-DetA complex will produced signals in many ways, such as reacting with enzymes, emitting lights, or generating electro-signals.2-4 The advantage of using sandwich ELISA is this assay can perform on different substrates and It is not limited to a 96-wells microtiter plate. Su et al. presented a microsphere based sandwich immunosensor where the detection limit of the HIgG antigens was as low as 0.01 ng mL-1.5 The primary antibody anti-HIgG (Ab1) was immobilized on a [poly(dimethyldiallyl ammonium chloride)/poly(sodium 4-styrenesulfonate)]2 modified polystyrene microsphere (3 μm) through electrostatic interaction. After the primary antibody was coated on the microsphere, BSA was used to block the residual active sites on the microspheres. The blocked Ab1 coated microsphere was then incubated with antigen (HIgG) and followed by the functionalized detection antibody (Ab2). The Ab1-HIgG-Ab2 sandwich complex was formed on the microsphere. There are three types of signal generated media functionalized Ab2 (probe) used in this work. The probes used were HRP-Ab2, Ab2-CdTe nanoparticles, and 32.
(44) HRP-Ab2-CdTe nanoparticles. In the three types of probes, the HRP-Ab2-CdTe nanoparticles can produce the strongest signal. The reason for the higher signal of HRP-Ab2-CdTe nanoparticles was because the large surface area of CdTe nanoparticles that can load numerous HRP-Ab2. When the chemiluminescence system was applied, the HRP reacted with H2O2 and generated higher signals from the HRP-Ab2-CdTe nanoparticles. The HRP-Ab2-CdTe nanoparticle actually amplified the signals from HIgG which was captured by the Ab 1 coated microsphere. The research team found that the detection range of HIgG can as low as 0.3 ng mL-1. This microsphere based immunosensor can also be used to detect other biomolecules in blood samples. There are many examples in the literature that apply sandwich ELISA on a microsphere.5-8 In our study, we will perform a commercial sandwich ELISA on the SμSs. The difference between our study and other literature examples is that our method only needs a centrifuge (for the wash step) and protein reagents. Here, the DetA was first coated on the SμSs through the streptavidin-biotin interaction (data shown in section 4.1). The antigen is then be captured by DetA coated microspheres and detected by the biotin functionalized CapA (CapA, antigen, and DetA were all in the same IL-7 ELISA kit, see chapter 3). The biotin functionalized CapA was synthesized by NHS-PEG4-Biotin. However, before performing a sandwich ELISA on a microsphere, there will be a problem using S-HRP to generate signals: S-HRP will react to both DetA and biotin functionalized CapA. In this section, we will focus on using streptavidin to block the biotin on the DetA coated microsphere. The concentration of 33.
(45) streptavidin will be optimized so the S-HRP will only react to biotin functionalized CapA on the CapA-antigen-DetA microspheres.. Experimental section 18 vials (No. A-R, A is the control) of the SμSs were prepared and each vial contained 20 μL of SμSs suspension, which equals to 0.25 mg beads. Each vial was washed three times with 100 μL of PBS2. 55 μL of 11 μg mL-1 DetA and 50 μL of PBS2 were added into every eppendorf. The concentration of the DetASμSs solution was 5 mg mL-1. The reactions were incubated for 8 h at 4°C (shake speed was 160 rpm). After the incubation was completed, all the eppendorfs were washed three times with 100 μL of PBS 2. The concentration of streptavidin was 1 mg mL-1. The biotin-active capacity is 1.0 μg per unit and it is 15.7 units mg-1. The diluted buffer used here was PBS3 0.1% azide. 100 μL of various concentrations of streptavidin were introduced into the 17 eppendorfs (one is the control) and incubated for 30 min at rt (see Table 4). After 30 min, each vial was washed three times with 200 μL of PBS4. 100 μL of S-HRP was then added into every vial and allowed them to shake for 20 min at rt. Because streptavidin will not react with itself, the results should be expected that the higher concentration of blocking streptavidin was added, the lower the signal of S-HRP was produced. After 20 min reaction, each vial was washed three times with 200 μL of PBS4. 100 μL of ready-to-use TMB was added in each vial and reacted for 15 min at rt in the dark.. 34.
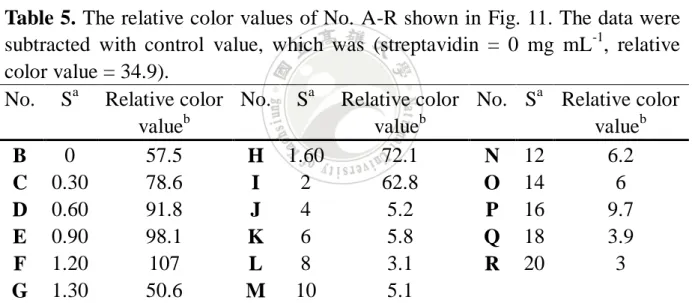
(46) Table 4. The gradient concentrations of streptavidin which were used to block the excess biotin on the DetA coated microspheres. A B C D E F G H I No. -2 -2 -2 a 0 1 0.5 0.25 0.13 6.3x10 5x10 2.5x10 10-2 S J K L M N O P Q R No. -4 -6 -8 -10 -12 -14 -16 -18 a 10 10 10 10 10 10 10 10 10-20 S a. Streptavidin (S) in the gradient concentrations (mg mL-1).. Results and discussion The gradient concentrations of streptavidin are listed in Table 4. When the streptavidin was added into the DetA coated microsphere suspension, we predicted that the biotin will be saturated in response to a high concentration of streptavidin. The results are shown in Fig. 11 and color analyzed data are shown in Table 5. Notably, the data in No. B-F were opposite to our prediction. When the concentration of streptavidin was added into the DetA coated microsphere suspension, the less biotin was blocked and the more S-HRP was bound to DetA on the microspheres. In other words, the biotin on the DetA coated microsphere was saturated under relative low concentration of streptavidin.. 35.
(47) Figure 11. DetA coated microspheres were reacted with gradient concentrations of streptavidin. The concentration of streptavidin was (A) 0 mg mL -1 (the control) (B) 1 mg mL-1 (C) 0.5 mg mL-1 (D) 0.25 mg mL-1 (E) 0.13 mg mL-1 (F) 6.3 x 10⁻² mg mL-1 (G) 5 x 10⁻² mg mL-1 (H) 2.5 x 10⁻² mg mL-1 (I) 10-2 mg mL-1 (J) 10-4 mg mL-1 (K) 10-6 mg mL-1 (L) 10-8 mg mL-1 (M) 10-10 mg mL-1 (N) 10-12 mg mL-1 (O) 10-14 mg mL-1 (P) 10-16 mg mL-1 (Q) 10-18 mg mL-1 (R) 10-20 mg mL-1.. Table 5. The relative color values of No. A-R shown in Fig. 11. The data were subtracted with control value, which was (streptavidin = 0 mg mL-1, relative color value = 34.9). No. Sa Relative color No. Sa Relative color No. Sa Relative color valueb valueb valueb 0 57.5 72.1 6.2 B H 1.60 N 12 78.6 2 62.8 6 C 0.30 I O 14 91.8 4 5.2 9.7 D 0.60 J P 16 98.1 6 5.8 3.9 E 0.90 K Q 18 107 8 3.1 3 F 1.20 L R 20 50.6 5.1 G 1.30 M 10 a. Streptavidin (S) in the gradient concentration [-log (mg/mL)]. bRelative color value was. measure by ImageJ using a digital circular zone with a constant size. The smaller the value was, the deeper the color was.. The reason for the unexpected results shown in Fig. 12 was the equilibrium behavior between the free streptavidin, the biotin on DetA, and the streptavidin on S-HRP. In our study, the important role to link two molecules was the streptavidin-biotin interaction, which is one of the strongest non-covalent bonds 36.
(48) in nature. This interaction is reversible.9-11 Although the Kd value is very low, the equilibrium process between streptavidin and biotin is still feasible. There were three equilibrium interactions A, B, and C. Equilibrium A was between the DetA and free streptavidin, equilibrium B was between SμS and the DetA, and equilibrium C was between S-HRP and DetA. The assumption was that when the concentration of the free streptavidin was too high, it would attract the DetA on the surface of SμS. Because the energy activity of free streptavidin was larger than the streptavidin which was conjugated on the microspheres surface, the biotin-binding affinity for free streptavidin was relatively higher. When the DetA was pulled off by the free streptavidin, the active sites on microsphere will be exposed for S-HRP binding.. Figure 12. The illustration of the DetA that was pulled off by high concentration of free streptavidin in the solution. After the DetA was pulled into the solution and washed away, the exposed active area on the microsphere will react with the following S-HRP and cause the unexpected signal.. However, in the relative low concentration of free streptavidin, the biotin blocking efficiency was much better than high concentration of free streptavidin. 37.
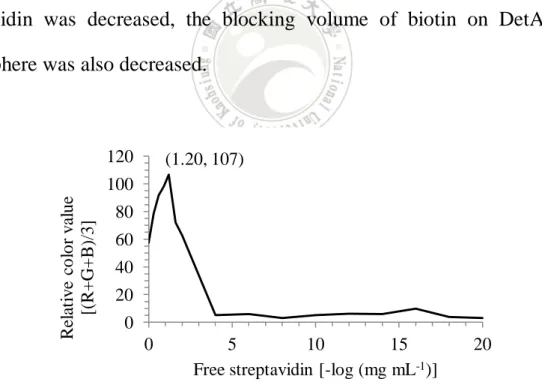
(49) The steric hindrance for low concentration of streptavidin was lower so it was easy for streptavidin to react with biotins on DetA coated microsphere. The relative color values were plotted with the gradient concentrations of streptavidin in Fig. 13. The data indicate that the biotin-blocking efficiency was the highest when the concentration of free streptavidin was 6.25 x 10⁻² mg mL-1. The data also suggest that the equilibriums A, B, and C were in play. The biotin-blocking efficiency was increased when the concentration of streptavidin was decreased from 1 mg mL-1 to 6.25 x 10⁻² mg mL-1 (the diluted factor was 2). After the concentration of streptavidin was lower than 6.25 x 10⁻² mg mL-1, the biotin-blocking behavior was same as our prediction: when the concentration of streptavidin was decreased, the blocking volume of biotin on DetA coated microsphere was also decreased.. 120. (1.20, 107). Relative color value [(R+G+B)/3]. 100 80 60 40 20 0 0. 5 10 15 Free streptavidin [-log (mg mL-1)]. 20. Figure 13. The biotin was blocked by gradient concentration of streptavidin. The out-liner data point (1.30, 50.6) was removed.. 38.
(50) Conclusion There are three equilibriums present when free streptavidin was used to block the excess biotins on the DetA coated microspheres: equilibrium A was between the DetA and free streptavidin, equilibrium B was between SμS and the DetA, and equilibrium C was between S-HRP and DetA. When the concentration of free streptavidin was increased, the DetA will be removed from the microsphere surface due to the higher energy activity of free streptavidin compared to the streptavidin on the microsphere. After the DetA left, the microsphere surface may have had exposed areas where S-HRP can bind, thus generated the unexpected signals. However, when the concentration of free streptavidin was lower, the biotin-blocking efficiency was better. The optimized concentration of free streptavidin for biotin blocking was 6.25 x 10⁻² mg mL-1. When the concentration of free streptavidin was lower than 6.25 x 10⁻² mg mL-1, the equilibrium interaction was laggard and the biotin-blocking behavior was in the right trend as our prediction.. References (1) Y. F. W. Wang, M. E. Eaton, A. N. Schuetz and S. R. Nesheim, in Diagnostic Microbiology of the mmunocompromised Host, ed. R. T. Tayden, K. C. Carroll, Y.-W. Tand and D. M. Wolk, ASM Press, Washington, DC, 1st edn, 2009, ch. 2, pp. 47–68. (2) Zheng, C.; Wang, J.; Pang, Y.; Wang, J.; Li, W.; Ge, Z.; Huang, Y. Lab Chip 2012, 12, 2487-2490. 39.
(51) (3) Henares, T. G.; Uenoyama, Y.; Nogawa, Y.; Ikegami, K.; Citterio, D.; Suzuki, K.; Funano, S.-i.; Sueyoshi, K.; Endo, T.; Hisamoto, H. Analyst [Online early access]. DOI: 10.1039/C3AN00098B. Publish online: Apr 03, 2013.. http://pubs.rsc.org/en/content/articlelanding/2013/an/c3an00098b. (accessed Apr 10, 2013). (4) Wu, J.; Chua, H.; Meia, Z.; Denga, Y.; Xuea, F.; Zhenga, L.; Chen, W. Anal. Chim. Acta 2012, 753, 27-31. (5) Kanwal, S.; Traore, Z.; Su, X. Colloids Surf., B 2010, 81, 549-554. (6) Yang, M.; Li, H.; Javadi, A.; Gong, S. Biomaterials 2010, 31,3281-3286. (7) Chen, L.; Zhang, Z.; Zhang, P.; Zhang, X.; Fu, A. Sens. Actuators, B 2011, 155, 557-561. (8) Wu, D.; Li, R.; Wang, H.; Liu, S.; Wang, H.; Wei, Q.; Du, B. Analyst 2012, 137, 608-613. (9) Stayton, P. S.; Freitag, S.; Klumb, L. A.; Chilkoti, A.; Chu, V.; Penzotti, J. E.; To, R.; Hyre, D.; I Trong, I. L.; Lybrand, T. P.; Stenkamp, R. E. Biomol. Eng. 1999, 16, 39-44. (10) Wong, J.; Chilkoti, A.; Moy, V. T. Biomol. Eng. 1999, 16, 44-45. (11) Lee, G. U.; Kidwell, D. A.; Colton, R. J. Langmuir 1994, 10, 354-357.. 40.
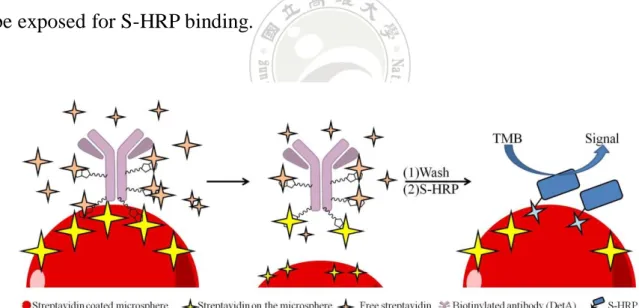
(52) 4.3 Interaction between streptavidin conjugated horseradish peroxidase and the detection antibody coated microsphere. Introduction Although the data in section 4.2 support the equilibrium theory between streptavidin, DetA, and S-HRP, we have another assumption to explain the unexpected results in Fig. 11. If the equilibrium interaction is excluded, another explanation of the aforementioned unusual behavior of using free streptavidin to block biotin is that S-HRP binds to the DetA non-specifically. There are two possible reasons for this non-specific binding. First, the surface of SμS was not fully covered by streptavidin, so S-HRP can bind to the empty spaces on the surface. Second, the wash steps during experimental operation may not be enough, so the remaining residual S-HRP will react to TMB and cause the non-specific binding. Here, the gradient concentration of S-HRP was used to verify the interaction form between S-HRP and the proteins coated on microspheres. Second, the relationship between streptavidin, detection antibody, and S-HRP was clarified. The hypothesis was that if S-HRP was non-specifically bound to detection antibody coated microspheres, the blocking streptavidin will not affect the signal generations due to the random binding of S-HRP. If S-HRP was specifically bound to detection antibody coated microspheres, the blocking streptavidin will reduce the signal generations from S-HRP due to the decrease of the biotins on DetA (see Fig. 14 and 15). 41.
(53) Figure 14. The illustration of the interaction between S-HRP and biotins on DetA coated microsphere.. Figure 15. The illustration of experimental designs. If the signal intensities in A and B are same, S-HRP is non-specifically binding to DetA. If the signal intensities in A and B are different, S-HRP is specifically binding to DetA.. Experimental section In the part 1, the gradient concentration of S-HRP was used to verify the interaction between S-HRP and DetA coated microspheres. 10 clean eppendorf tubes were contained 5 μL of SμS suspension. Each vial was washed with 100 μL of PBS2 three times. 14 μL of 11 μg mL-1 of DetA and 50 μL of PBS2 were added in each eppendorf tube. The reaction was allowed to shake for 1 h at 4°C (shake speed was 160 rpm). After 1 h incubation, the beads were washed three times with 100 μL of PBS2. 50 μL of the gradient concentration of S-HRP was 42.
(54) introduced in each vial and reacted for 20 min at rt (shake speed was 160 rpm). After 20 min, the beads were washed three times with 100 μL of PBS4. 50 μL 0f TMB was added in every vial. The vials were reacted for 15 min at rt in the dark. In the part 2, the goal was to prove that S-HRP bound to DetA coated microspheres specifically. This experiment was repeated three times at the same time. 25 μL of SμSs suspension and 400 μL of PBS2 were prepared in a clean 1.5 mL eppendorf. The eppendorf was vortexed for 1.5 min and the supernatant was discarded. The beads were washed three times with 400 μL of PBS2. The wash steps were same. First, the beads were re-suspended with 400 μL of PBS2; second, the solution was vortexed for 1.5 min and ultrasonic bath for 2 min to mix the beads in wash buffer; third, the solution was centrifuged for 6 min in 10,000 g; finally, the supernatant was removed from the reaction solution. 62.5 μL of PBS2 was added in the eppendorf so the concentration of the solution was 5 mg mL-1. The eppendorf was vortexed for 1.5 min to mix the beads in solution. Following 12.5 μL of 60 μg mL-1 the IL-7 DetA was added in the reaction and allowed to shake for 1 h at 4°C (shake speed was 160 rpm). After 1 h, the beads were washed three times in same procedure mentioned above. The beads were then re-suspended with 1 mL of PBS2 and the solution was separated into 10 vials with 100 μL per vial. The vials were centrifuged for 6 min and the supernatant was removed. 100 μL of 0.25 mg mL-1 streptavidin was added in vial A-E and allowed to shake for 30 min at rt (shake speed was 160 rpm). After all the vials were reacted for 30 min, the beads were washed 43.
(55) three times in the same procedure mentioned before. 100 μL of various concentration of S-HRP was added in each eppendorf and reacted for 20 min at rt (shake speed was 160 rpm). After 20 min incubation, each vial was washed three times with 400 μL of PBS2. 100 μL of TMB was introduced in every vial and reacted for 15 min at rt in the dark. 100 μL of PBS3 0.1% azide was added in vial 6-10 as control sets. The experimental processes for vial 6-10 were same as 1-5 except that streptavidin was replaced by PBS3 0.1% azide in the first step.. Results and discussion In Part 1: The scanned results were shown in Fig. 16 and the analyzed color values were listed in Table 6. Fig. 17 indicates that the S-HRP specifically bind to the DetA coated microspheres. The generation of color signals on DetA coated microspheres were in response to the gradient concentration of S-HRP.. Figure 16. The scanned image of gradient concentration of S-HRP. (A) The concentration of S-HRP is 1.5 x 10⁻⁴ M (B) 3.75 x 10⁻⁵ M (C) 9.38 x 10⁻⁶ M (D) 2.34 x 10⁻⁶ M (E) 5.86 x 10⁻⁷ M (F) 1.46 x 10⁻⁷ M (G) 3.66 x 10⁻⁸ M (H) 9.16 x 10⁻⁹ M (I) 2.29 x 10⁻⁹ M(J) 5.72 x 10⁻¹⁰ M.. 44.
(56) Table 6. The relative color values of 10 gradient concentration of S-HRP. No. S-HRP[-log (mg mL-1)] Relative color valuea A 3.824 49.37 B 4.426 73.32 C 5.028 127.09 D 5.630 141.95 E 6.232 151.12 F 6.834 158.25 G 7.436 163.21 H 8.038 178.56 I 8.640 113.14 J 9.242 146.85 a. The relative color value was measured by ImageJ by a constant circle zone.. Relative color value [(R+G+B)/3]. 200. y = 169.33ln(x) - 166.27 R² = 0.9211. 150 100. 50 0 3.500 4.500 5.500 6.500 7.500 8.500 S-HRP [-log (mg mL-1)]. Figure 17. The relative color plot of gradient concentrations of S-HRP on the DetA coated microspheres.. In Part 2: The scanned results were shown in Fig. 18 and the absorbance was listed in Table 7. From Fig. 19, it was obvious that there was a significant difference between curve A (with streptavidin) and curve B (without streptavidin). The data indicates that S-HRP was specifically bind to DetA coated microspheres. In well c and well d, the absorbance distinctions were more than 2 orders of 45.
(57) magnitude. Especially in well c, the absorbance without streptavidin was 22 times larger than the one with streptavidin. According to this result, when the concentration of streptavidin was 0.25 mg mL-1, the background can be decreased as low as 0.1 in the concentration of S-HRP was 9.38 x 10⁻⁶ mg mL-1.. Figure 18. The scanned images of A (with streptavidin) and B (without streptavidin). (A and F) The concentration of streptavidin-HRP is 1.5 x 10⁻⁴ mg mL-1. (B and G) 3.75 x 10⁻⁵ mg mL-1 (C and H) 9.38 x 10⁻⁶ mg mL-1 (D and I) 2.34 x 10⁻⁶ mg mL-1 (E and J) 5.86 x 10⁻⁷ mg mL-1. The experiment is repeated three times at once (I, II, and III).. Table 7. The UV absorbance for gradient concentration of S-HRP. The experiment is repeated three times at once. With streptavidin (A)a Absorbance -7 -1 # S-HRP (10 mg mL ) I II III average A 1500 1.90 1.57 0.66 1.38 B 375 0.41 0.42 0.37 0.40 C 93.8 0.18 0.09 0.06 0.11 D 23.4 0.05 0.06 0.05 0.05 E 5.86 0.05 0.05 0.05 0.05 46. continue to next page.
(58) # F G H I J a. Without streptavidin (B)a S-HRP (10-7 mg mL-1) 1500 375 93.8 23.4 5.86. I 4.05 3.44 2.27 0.55 0.11. Absorbance II III average 3.91 3.78 3.91 3.49 3.44 3.46 2.82 2.67 2.59 0.62 0.48 0.55 0.13 0.12 0.12. A and B listed here are responded to A and B in Fig. 19, which means that A is the results. with streptavidin and B is the results without streptavidin .. 5 Absorbance. 4. with S (A). 3. without S (B). 2 1. 0 0. 200 400 600 800 1000 1200 1400 1600 S-HRP (10-7 mg mL-1). Figure 19. The plot for combining A and B in concentration of S-HRP versus absorbance at 450 nm. The points within is average values from Table 7. (Blue line is the one with streptavidin and red line is the one without streptavidin.). Conclusion In section 4.2, the data suppot that the equilibriums between streptavidin, DetA, and S-HRP will affect the biotin blocking efficiency on DetA coated microspheres. Here, we clarify that the S-HRP was binding to the DetA specifically. The DetA coated microspheres were first blocked with 0.25 mg mL-1 of free streptavidin. The optimized concentration of S-HRP was 9.38 x 10⁻⁶ 47.
(59) mg mL-1. Under these two conditions, the biotin on the DetA can be fully blocked by free streptavidin and the background was lower than 0.1.. 48.
(60) Chapter 5 The aggregation of microspheres using antibody-antigen recognition or streptavidin-biotin interaction. Abstract The visual detection of the initial signal from the target can be achieved using the. microsphere. polymerization.. Before. the. self-assembled of. microsphere was used to amplify the signals in the immunoassays, the aggregation of microspheres should be confirmed. In this chapter, the functionalized. microspheres. will. be. connected. to. each. antibody-antigen recognitions or streptavidin-biotin interactions.. 49. other. by.
(61) 5.1 The aggregation of microspheres using antibody-antigen recognition. Introduction There are many examples in the literatures support that microspheres can be linked through antibody-antigen interaction.1-4 In 1999, Dr. Shenton presented a work that they connected gold nanoparticles by antibody-antigen interactions.5 The gold nanoparticles were modified with anti-DNP IgE antibody and anti-biotin IgG antibody separately. The addition of DNP-DNP antigen or DNP-biotin antigen can cross-link the modified nanoparticles. Temperature will affect the binding affinity between antigens and antibodies which were attached on the nanoparticles. From the TEM images, it was obvious that the nanoparticles were attached to each other and formed a significant polymer. Either homo- or hetero- antigens were existed with the nanoparticles; the metallic nanoparticles were directed self-assembly into 3D networks by antibody-antigen interfaces. The goal in this section is to form a large microsphere polymer that can be seen by naked eye or an optical microscope. Here, the antibody-antigen interaction was used as a “bridge” to link streptavidin coated microspheres (see Fig. 20). The CapA coated microsphere and DetA coated microsphere were connected by the addition of antigen. This connection can not only form a desirable polymer but also perform the recognition events in a sample.. 50.
(62) Figure 20. The illustration of the formation of microsphere-based polymer using antigen-antibody as a bridge.. Experimental section The procedure of microsphere aggregation by antibody-antigen interaction was simple. 20 μL of 60 μg mL-1 IL-7 DetA coated microspheres, 10 μL of 1 mg mL-1 pegylated IL-7 CapA coated microspheres, and 100 μL of 200 pg mL-1 IL-7 antigens were mixed together in a eppendorf tube. The solutions were allowed to shake for 2 h at rt (shake speed was 160 rpm). After 2 h, 1 μL of the microspheres solution was put under the microscope.. Results and discussion The self-assembly of microspheres were shown in Fig. 21. The antigen-antibody interaction can cross-link the microspheres in the solution. However, the aggregation was not tight enough. When the solution was pipetted up and down, the aggregation will be departed and it will take 15-30 min to reform the polymer. The control data indicated that when there were only antibodies coated microspheres in the solution, no aggregation were formed. The dimer and trimer in Fig. 21 were the self-aggregation of the beads. 51.
(63) Although the designed polymers were formed, the application to the signal amplification in the sandwich immunoassay was still unsuccessful. The connection conditions were changed from antibody-antigen recognition to streptavidin-biotin interaction and it will improve the outcomes for visual detection of biomolecules on the microtiter plate (see section 5.2).. Figure 21. The microscope image of polymer by antigen-antibody interaction. (A) The polymer was formed by antibody-antigen interactions. (B) The antibody coated microsphere will not aggregate without the existence of antigen.. Conclusion The functionalized microspheres can be linked by the antibody-antigen recognition. The DetA coated microsphere can be attached to the biotinylated CapA coated microsphere by the addition of antigens, but the structure of this polymer was not rigid enough for resisting the hard shaking of the solution. The biotinylated CapA was synthesized but we cannot control the biotinylated region on the antibody. The uncontrollable biotin on the CapA may affect the 52.
(64) antigen recognition ability and further reduce the connection strength between the microspheres. Considering the previous factors, the antibody-antigen recognition was replaced by the streptavidin-biotin interaction to connect the microspheres to polymers.. Reference (1) Feng, L.; Dreyfus, R.; Sha, R.; Seeman, N. C.; Chaikin, P. M. Adv. Mater. [Online early access]. DOI: 10.1002/adma.201204864. Publish online: Apr 03,. 2013.. http://onlinelibrary.wiley.com/doi/10.1002/adma.201204864/abstract;jsessio nid=59F7FA4C7D61AEEC98047295B3339CC8.d01t02 (accessed Apr 10, 2013). (2) Wang, D.; Rogach, A. L.; Caruso, F. Nano Lett. 2002, 2, 857-861. (3) Horáka, D. Španováb, A.; Tvrdíkovác, J.; Rittich, B. Eur. Polym. J. 2011, 47, 1090-1096. (4) Erb, R. M.; Son, H. S.; Samanta, B.; Rotello, V. M.; Yellen, B. B. Nature, 2009, 457, 999-1002. (5) Shenton, W.; Davis, S. A.; Mann, S. Adv. Mater. 1999, 11, 449-452.. 53.
(65) 5.2 The aggregation of microsphere using streptavidin-biotin interaction. Introduction In 2007, Dr. Meng et al. described a work that they link the microspheres by avidin-biotin interactions.1 The biotinylated microspheres were synthesized by a two-steps reaction. N-acryloxysuccinimide was added in the pre-distilled styrene in the nitrogen system. The polymerization was triggered by the addition of potassium persulfate under constant stirring. Then the poly (styrene-co-N-acryloxysuccinimide) biotinylated. microspheres. microspheres. were. synthesized. were. purified.. The. by. mixing. poly. (styrene-co-N-acryloxysuccinimide) and biotin hydrazide together in PBS solution. The biotinylated microspheres can be aggregated by the addition of avidin. As the concentration of avidin is increasing, the aggregation becomes more rapid. In 1999, Dr. Connolly and the coworkers presented a work that the gold nanoparticles are adsorbed with modified biotin and then aggregated with the addition of streptavidin. They described two routes for self-assembly of nanoparticles in solution.2 First route is that the nanoparticles are modified with disulfide biotin analogue, followed by the addition of streptavidin. The second route is that the disulfide biotin is first binding to streptavidin and followed by the addition of nanoparticles to form the self-assembled polymers.. 54.
數據
+7
Outline
Synthesis and characterization of antibody coated microspheres
Interaction between streptavidin conjugated horseradish peroxidase and the detection antibody coated microsphere peroxidase and the detection antibody coated microsphere
The aggregation of microsphere using streptavidin-biotin interaction interaction
Multilayered attachment of microspheres on the antibody coated surface
Development of new chiral stationary phases by a simple in situ method
相關文件
了⼀一個方案,用以尋找滿足 Calabi 方程的空 間,這些空間現在通稱為 Calabi-Yau 空間。.
In particular, we present a linear-time algorithm for the k-tuple total domination problem for graphs in which each block is a clique, a cycle or a complete bipartite graph,
volume suppressed mass: (TeV) 2 /M P ∼ 10 −4 eV → mm range can be experimentally tested for any number of extra dimensions - Light U(1) gauge bosons: no derivative couplings. =>
O.K., let’s study chiral phase transition. Quark
a) Excess charge in a conductor always moves to the surface of the conductor. b) Flux is always perpendicular to the surface. c) If it was not perpendicular, then charges on
• Formation of massive primordial stars as origin of objects in the early universe. • Supernova explosions might be visible to the most
Assuming that the positive charge of the nucleus is distributed uniformly, determine the electric field at a point on the surface of the nucleus due to that
The difference resulted from the co- existence of two kinds of words in Buddhist scriptures a foreign words in which di- syllabic words are dominant, and most of them are the
