Noninvasive harmonics optical microscopy
for long-term observation of embryonic
nervous system development in vivo
Szu-Yu Chen Cho-Shuen Hsieh Shi-Wei Chu
National Taiwan University
Department of Electrical Engineering and
Graduate Institute of Electro-Optical Engineering Taipei 10617, Taiwan
Cheng-Yung Lin National Taiwan University
Institute of Molecular and Cellular Biology Taipei 10617, Taiwan
Ching-Yi Ko Yi-Chung Chen
National Taiwan Ocean University Institute of Bioscience and Biotechnology Keelung 20224, Taiwan
Huai-Jen Tsai
National Taiwan University
Institute of Molecular and Cellular Biology Taipei 10617, Taiwan
Chin-Hwa Hu
National Taiwan Ocean University Institute of Bioscience and Biotechnology Keelung 20224, Taiwan
Chi-Kuang Sun National Taiwan University
Department of Electrical Engineering and
Graduate Institute of Electro-Optical Engineering Taipei 10617, Taiwan
Abstract. Nervous system development is a complicated dynamic
process, and many mechanisms remain unknown. By utilizing endog-enous second-harmonic-generation as the contrast of polarized nerve fibers and third-harmonic-generation 共THG兲 to reveal morphological changes, we have successfully observed the vertebrate embryonic ner-vous development from the very beginning based on a 1230-nm light source. The dynamic development of the nerve system within a live zebrafish embryo can be recorded continuously more than 20 hr without fluorescence markers. Since the THG process is not limited by the time of gene expression and differentiation as fluorescence-based techniques are, the observable stages can be advanced to the very beginning of the development process. The complete three-dimensional brain development from a neural plate to a neural tube can be uncovered with a submicron lateral resolution. We have, for the first time, also reported the generation of SHG from myelinated nerve fibers and the outer segment of the photoreceptors with a stacked membrane structure. Our study clearly indicates the fact that higher-harmonics-based optical microscopy has the strong potential to long-term in vivo study of the nervous system, including genetic disorders of the nervous system, axon pathfinding, neural regenera-tion, neural repair, and neural stem cell development. © 2006 Society of
Photo-Optical Instrumentation Engineers. 关DOI: 10.1117/1.2363369兴
Keywords: harmonics; optical microscopy; noninvasive; nervous system; in vivo; polarized nerve fibers.
Paper 05312R received Oct. 18, 2005; revised manuscript received Mar. 20, 2006; accepted for publication May 5, 2006; published online Oct. 30, 2006.
1 Introduction
Optical higher-harmonic generations, including second-harmonic-generation 共SHG兲 and third-harmonic-generation 共THG兲 processes, are known to leave no energy deposition to the interacted matters due to the virtual-transition characteristic.1 In contrast to the absorption-induced-fluorescence processes that require energy deposition and electron transitions, the higher-harmonic generation processes provide the optical noninvasive nature desired for microscopy applications, especially for long-term observation of the dy-namic changes of live samples. Different from single-photon
and multiphoton fluorescence, no cell damage and pho-tobleaching effect is expected from the optical harmonic-generation process itself due to the fact that there is no real electron transition involved and the total generated harmonic photon energy has to be equal to the total annihilated photon energy.2 With a nonlinear nature similar to the multiphoton excited fluorescence, the generated SHG intensity depends on the square of the incident light intensity, while the generated THG intensity depends on the third power of the incident light intensity. These nonlinear dependencies allow localized exci-tations to enable intrinsic optical sectioning and a high three-dimensional resolution similar or better than that of the two-photon fluorescence microscopy.3,4 THG is known to be a fundamental physical process during which the THG intensity
1083-3668/2006/11共5兲/054022/8/$22.00 © 2006 SPIE Address all correspondence to: Chi-Kuang Sun, National Taiwan University,
Department of Electrical Engineering and Graduate Institute of Electro-Optical Engineering, Taipei 10617, Taiwan. Tel: 5085; Fax: +886-2-3366-3614; E-mail: [email protected]
peaks when the foci of the strongly focused optical beams are located at the material interfaces.5–8 In biological tissues, THG arising from interfaces including various membranes and organelles, especially mitochondria,9–12 can be used to reveal the morphological structures.13,14 On the other hand, SHG contrast in biological specimens can be provided by or-dered arrangement of highly asymmetric biomolecules where the optical centrosymmetry is broken, including stacked membranes15,16and structured proteins.17–23Combined with a least-invasive 1230-nm light source, higher-harmonic genera-tion microscopy has been proven to be an excellent tool for studying vertebrate embryonic development in previous research.13,14
Among many vertebrate physiological systems, the ner-vous system is one of the most important and complicated systems, and its embryonic development process plays a sig-nificant role and is worth our efforts to solve the puzzles remaining. Since it takes charge of regulating the actions and reactions of the whole body, any disorders occurring in the developing nervous system may lead to serious diseases. It is thus important to understand how the nervous system is de-veloped and how it functions. In order to find the disease-causing genes and how they affect the nervous system, several genetic models, such as Dorsophila 共the fruit fly兲, and ze-brafish 共Danio rerio兲, have been adopted, especially the ze-brafish. Because the zebrafish has much genetic material that is the same as humans, scientists can learn how the genes function in the human body by studying zebrafish. Compared with humans, the zebrafish has similar but simpler develop-mental programs during early embryonic stages. Thus, the zebrafish has become a standard vertebrate model, and differ-ent phenotypes of zebrafish have been developed for investi-gating the gene functions in the nervous system.24In addition, its rapid developing rate, precisely defined developing stages, transparency, small size, and external development also facili-tate the neurology study and microscopic observation.
Although development of the nervous system is a dynamic process, static images obtained from cryostat sectioning of different embryos are often used during study. Recently, ad-vances in live imaging systems, such as ultrasound imaging,25 magnetic resonance imaging,26,27 optical coherence tomography,28,29 confocal fluorescence microscopy,30,31 and multiphoton fluorescence microscopy,32–34have offered many opportunities to provide insights into the development pro-cess. Besides, other functional research, such as Ca2+
imaging35,36 and fluorescence resonance energy transfer,37 were also used to reveal how the nervous system works. While nonfluorescence-based techniques are limited by the spatial resolution, the widely used fluorescence-based tech-niques are restricted to the observable periods of the develop-ment process and by the applied excitation power. Since most fluorescence signals are controlled by the differentiation pro-cess due to neuron-specific promoters, the earliest observable stage of development will be restricted to when the fluores-cence is expressed. To the best of the authors’ knowledge, long-term in vivo and noninvasive observations of the com-plete neural development process have never been success-fully achieved in a live vertebrate embryo, while different part and stages of the early nervous development can be observed with a submicron resolution. Moreover, since a fluorescence-based technique always accompanies photo-energy
deposi-tion, and photodamage and photobleaching effects always raise discussion,38,39the power after objective has to be under a threshold value, thus limiting the maximum penetration depth for in vivo observation.
In this paper, for the first time, the whole vertebrate em-bryonic nervous development is successfully observed in vivo from the very beginning. Higher-harmonics-generation is ap-plied to continuously observe the dynamic development of the nervous system within a live zebrafish embryo for more than 20 hr. The in vivo study was performed with a 1230-nm light source, thus providing high cell viability14and allowing THG to fall within the visible spectrum for deep-tissue observation. Endogenous SHG is utilized as the contrast of nerve fibers40,41 and mitotic spindles,14,19while THG is used to reveal the cell behaviors and morphological changes. Since the THG process is not limited by the time of gene expression and differentia-tion as fluorescence-based techniques are, the observable stages can be advanced to the very beginning of the whole development process. The complete three-dimensional brain development from a neural plate to a neural tube can be un-covered with a submicron lateral resolution. Since no fluoro-phores and live markers are needed, toxicity, photobleaching, and other biological as well as genetic environment modifica-tions can all be completely avoided. After observing the brain development of several tens of zebrafish embryos, with non-stop continuous observation time in a single embryo even up to20 hr, the embryos can all develop normally into the larva stages. Our study indicates that higher-harmonics-based opti-cal microscopy has the strong potential to long-term in vivo study of the nervous system, including genetic disorders of the nervous system, axon pathfinding, neural regeneration, neural repair, and neural stem cell development.
2 Method
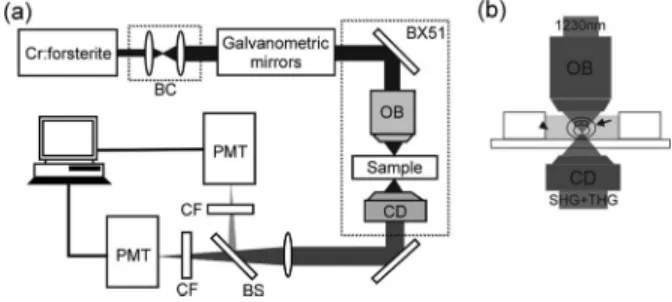
The laser-scanning, higher-harmonic optical microscope 共HOM兲 system 关Fig. 1共a兲兴 was adapted from an Olympus FV300 scanning unit combined with an Olympus BX51 up-right microscope, and all optics were modified to allow the passage of the 1200–1350-nm infrared light. The light source was a home-builtCr: forsterite laser, functioning at 1230 nm with a repetition rate of 110 MHz and a pulse width of 140 fs. Real-time 2D scanning was accomplished with a pair
Fig. 1 共a兲 The scheme of the laser-scanning higher-harmonic optical microscope共HOM兲 system. The system was adapted from an Olym-pus FV300 scanning unit combined with an OlymOlym-pus BX51 upright microscope. BC, beam collimator; OB, objective; CD, condenser; BS, beam splitter; CF, color filter; PMT, photomultiplier tube. 共b兲 The scheme of the miniaturized aquarium, where the live zebrafish em-bryo共arrow兲 without any treatment was kept in water 共arrowhead兲.
of high-speed galvanometer mirrors inside the scanning unit. The collimated laser beam was coupled into the scanning sys-tem connecting to an Olympus BX51 microscope with an aperture-fitting tube lens. In order to visualize the whole brain structures inside an untreated live zebrafish embryo whose diameter was 1.5 mm thick with chorion, the working dis-tance of the objective had to be longer than1.5 mm. Through a 2-mm-working-distance high numerical-aperture 共NA兲 in-frared objective 共LUMPlanF1/IR 60X/water/NA0.9, Olym-pus兲, the excitation laser pulse was focused into the desired location inside the specimen and scanning with a spot size close to its diffraction limit. The average power after the ob-jective was ⬃100 mW. With a finite sample thickness, in-stead of collecting the signals in the backward direction,42we collected the forward-propagating optical harmonics signals with a high-NA 共1.4兲 oil-immersion condenser. The signals were guided into two photomultiplier tubes 共PMT兲, which were synchronized with the galvanometer mirrors and used to respectively record the interference-filtered SHG and THG signals point by point to form 2D sectioned images. Addition-ally, stereographic 3D images of the whole live embryo can be obtained by controlling the depth of focus inside the speci-mens, and the movement of the live embryos can be observed by continuously scanning on the same specimens with a re-cording speed of 0.25– 2.5 sec per frame, with 512⫻512 scanning points. During observation, the live zebrafish em-bryos with their chorion were kept inside a miniaturized aquarium关Fig. 1共b兲兴 without any treatment at room tempera-ture共20±1°C兲. In order to prevent the observation from be-ing interfered with by the pigments, embryos were continu-ously treated with 0.003% PTU共Phenylthiourea兲 from 12-hr post-fertilization共hpf兲. PTU, a well-known technique, is now widely used in the developmental study of zebrafish to sup-press pigmentation in embryos.43The harmonics signals col-lected are represented by two different pseudocolors, green for SHG and blue for THG.
In our previous report, in live zebrafish embryos with the same objective, the spatial resolutions for the THG and SHG modalities inside the embryo had been experimentally mea-sured to be400– 500 nm and 500– 600 nm in lateral13and on the order of 1m in axial. For the work presented in this paper, we have successfully performed continuous observa-tion for20 hr in each live embryo, and the observed results have been repeated more than 10 times共only one of those is shown in this article兲. Comparing our results with the previ-ous time-lapse studies, no observable differences, including morphological changes and developing rate, were found within the observed period of embryonic development. That is to say that no bio-damage was observed while cell viability and cloning rate were both successfully preserved.38
3 Results and Discussion
3.1 Long-Term and in vivo Observation of the Brain Development
Without any fluorescence markers, we successfully accom-plished nonstop, long-term observation of the brain develop-ment in the same live zebrafish embryo for more than20 hr. The morphogenetic changes of the brain can all be picked up by the THG modality to show the development process from neural plate to neural keel, neural rod, and then neural tube.
On the other hand, the dynamics of the cell mitosis, neuron differentiation, and the nerve fibers in the brain can be re-corded by the SHG modality.
According to the developing process described by C. B. Kimmel,44the brain development of a zebrafish embryo be-gins at the bud stage, which is the end of the patterning phase. The patterning phase is an important phase of the vertebrate embryonic development, which is considered worthwhile to focus on, since many genes begin to be promoted and ex-pressed. Using our home-built HOM system, we could ob-serve the developing process from the one-cell stage, to the very beginning of the process, to 2-days’ larva in vivo.14 How-ever, because the brain begins to develop at the bud stage, only the developing process after that and several significant stages during brain development will be discussed in this article.
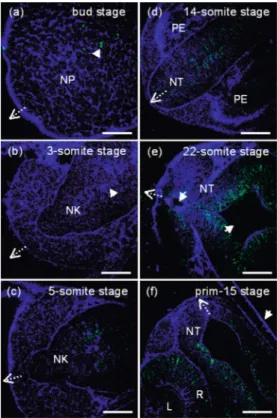
To start the observation, a live bud-stage embryo was put into the miniaturized aquarium under the microscope. With the animal pole of the embryo upward and by scanning the laser beam around the animal pole, a cluster of cells was revealed by the sectioned 2D image through the THG modal-ity 关blue part in Fig. 2共a兲兴. Since some cells in this cluster were still undifferentiated and were able to divide, by moni-toring this cluster of cells continuously, we could find spindles of mitosis in undifferentiated cells through strong SHG sig-nals 关green part in Fig. 2共a兲兴. When we moved the focus to different depths to optically section the 3D structure of this cluster, a platelike 3D structure could be found. Compared with the results of previous time-lapse studies,44this structure can be easily identified to be the neural plate, the primordium of the central nervous system at the bud stage. Vigorous cell division in the neural plate was revealed by SHG through the observation of mitosis spindles.
The monitoring kept going for about1 hr, and the embryo was then at the 3-somite stage. From THG images, the neural plate could be found to be thickened and a middle line关arrow in Fig. 2共b兲兴 was visible. During brain development, this change indicates that the neural plate is being epithelial in-folded at the middle line to become a neural keel, another transient structure. However, because the rate of cell mitosis at this stage is retarded and no nerve fibers exist, almost no SHG signals were observed inside the neural keel. As the embryo developed into the 5-somite stage, SHG signals ap-peared again in the middle of the neural keel 关green part in Fig. 2共c兲兴. Gradually, they became stronger and extended to be almost linear. We saw that the first neuron inside the neural keel began to differentiate at the 5-somite stage and elongated the nerve fibers,44which generated the SHG signals and al-lowed us to observe noninvasively.
As the development went on, the morphological changes resulting from epithelial folding could all be recorded by the THG modality. By sectioning the transient structure at differ-ent depths and reconstructing the obtained THG images, a rodlike solid structure, called a neural rod, could be identified at about the 14-somite stage. From a single section of the rodlike structure关Fig. 2共d兲兴, we found that the SHG signals arising from the nerve fibers in the neural rod were much stronger and became even more linear-like. After this stage, when the embryo developed into the 18-somite stage, several small cavities were observed to form in the rod. This process is called cavitation, which changes the rod to a hollow
struc-ture and forms the neural tube.44From then on, the lumens surrounded by the neurocoele in the midbrain can be found to be more and more distinguishable, and they were clearly ob-served through THG signals when the embryo was at the 22-somite stage 关Fig. 2共e兲兴. Passing through the segmentation period, the lumens of the brain almost took shape at the prim-15 stage 关shown by THG in Fig. 2共f兲兴; and THG also showed the structure of the eyes, including the retina and the lens 关Fig. 2共f兲兴. In addition to the nerve fibers in the neural tube, the axons elongated from the ganglia in the retina were also observed through the SHG. Moreover, since the chorion was not removed, we could see the chorion around the devel-oping embryo from the THG signals关arrow in Fig. 2共f兲兴.
Due to the least-invasive nature of HOM, the important morphogenetic changes of the zebrafish brain from the bud stage to the prim-15-stage were monitored in vivo continu-ously in the same live embryo without any fluorescence mark-ers. Through the THG modality, we were able to record not only the 3D change of shape within several different transient structures, but also the dynamic cell behaviors, such as its movement and division. On the other hand, cell mitosis, cell differentiation, and nerve fiber developments in the brain and the retina can all be observed from SHG signals. Although some observations of nervous system development have been demonstrated using fluorescence-based confocal microscopy,45the earliest observable stage was limited by the time at which the fluorescence protein was expressed in the neuron cells. Compared with the earliest stage—the prim-15 stage of a zebrafish embryo—when confocal fluorescence mi-croscopy can be used to observe, the HOM system can ad-vance the observation time to at least14 hr sooner. Not only the behavior of differentiated neuron cells but also the undif-ferentiated cells can all be recorded to provide a complete 4-dimensional共3 spatial dimensions and time兲 record of ner-vous system development. Moreover, based on the high axial resolution共⬃1m兲, this technique provides the capability to reveal various 3D transient structures without disrupting the development process. Since no extrinsic or intrinsic fluores-cence was used, misgivings of abnormal development due to external disturbance do not have to be concerned as the results of no phototoxicity and photobleaching.
By comparing with the previous time-lapse study of the zebrafish embryo development, the dynamic process of brain
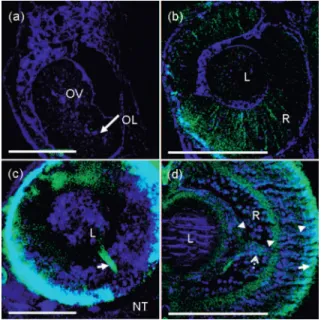
Fig. 3 SHG signals in the nervous system.共a兲 THG shows the outline of the neural tube共NT兲 and optic vesicles 共OV兲 of a live prim-12-stage zebrafish embryo; and SHG reveals the nerve fiber distribution in the neural tube.共b兲 Inset from 共a兲 shows the SHG in the ventricular zone 共VZ兲 near the lumens 共L兲. In this region, SHG arises from both mitotic spindles 共arrow兲 and nerve fibers 共arrowhead兲. 共c兲 Enlarged image corresponding to the area of inset in共b兲 clearly shows the mitotic spindles共SHG; arrow兲 in the ventricular zone of the neural tube. 共d兲 Cell mitosis共arrow兲 at the bottom of the retina 共R兲. Scale bar: 20m. THG and SHG are denoted by blue and green colors, respectively. Fig. 2 Long-term in vivo observation of the brain development in the
same zebrafish embryo from the bud stage to the prim-15 stage. The embryo was settled with the dorsal side to the top, and the dotted arrow shows the posterior-to-anterior direction. The HOM images shown here are all optically sectioned 2D images.共a兲 The neural plate 共NP兲 at the bud stage. Vigorous cell mitosis at this stage was revealed by SHG共arrow兲. 共b兲 The neural keel 共NK兲 at the 3-somite stage. From THG, the middle line共arrow兲 where neural plate infolded to form the neural keel is visible. Since mitosis was retarded and no nerve fibers existing yet, almost no SHG was picked up.共c兲 The neural keel 共NK兲 at the 5-somite stage. The SHG from nerve fibers was already observ-able near the middle line.共d兲 The neural tube 共NT兲 at the 14-somite stage. The neural rod was formed and SHG became stronger and linear-like. This image also shows the primordium of the eyes共PE兲 by THG.共e兲 The midbrain at the 22-somite stage. Lumens 共arrow兲 sur-rounded by neural tubes共NT兲 became more distinct. 共f兲 The neural tube共NT兲 and the eye at the prim-15 stage. The lens 共L兲 and retina 共R兲 became distinguishable through THG, while the nerve fibers both in the neural tube and in the retina were revealed by SHG. Since the chorion of the embryo was not removed, it was shown by THG 共ar-row兲. Scale bar: 50m. THG and SHG are denoted by blue and green colors, respectively.
development we recorded matched the previous reported re-sults completely. This identity indicates that our reported tech-nique induced no observable biodamages so that there is no reduction in cloning efficiency and each cell could function and divide normally to accomplish the whole development process.
3.2 SHG Signals in the Neural Tube
During the whole process of the brain development, interface-sensitive THG provides the 3D sketch of different structures from a neural plate to a hollow neural tube. On the other hand, nerve-fiber- and mitotic-spindle-sensitive SHG can tell us much more stories about how cells behave during the devel-opment process, as in Fig. 2. When a neural plate turns into a neural keel, although most cells have differentiated into func-tioning cells, there is still a small group of cells that have retained the capability of mitosis. Those cells are the so-called stem cells or precursor cells. Take an image of the zebrafish hindbrain, for example. Figure 3共a兲 shows a sectioned HOM image of the hindbrain and the otic vesicles obtained from a live prim-5-stage zebrafish embryo. If we enlarged the small area circumscribed by the white square关Fig. 3共b兲兴, two dif-ferent sources of SHG signals can be identified to be the mi-totic spindles 共arrow兲 and the nerve fibers 共arrowhead兲. It is interesting to note that each SHG source has its specific spa-tial distribution, and the distribution changes with develop-ment stages. Through the dynamic tracking of the mitosis pro-cess and the polarized neuron formation, the neural stem cell behaviors can thus be revealed without the help of fluores-cence markers.
Once the neural keel begins to form, cell cycle occurring in it will go along with migration of the nuclei.44,46According to Kimmel et al.,44 “During the cell cycle, all the cells of the germinal epithelium are continuous from the luminal surface of the neural tube to the outside surface. The nuclei move within their cells as they go through the cell cycle and mitotic cells can only be found near the luminal surface.” Following the distributions and the transient behaviors of the observed SHG signals, we can easily divide the neural tube longitudi-nally into three distinguishable parts in order from the middle
line to the out wall. Figure 3共a兲 shows SHG signals highly concentrated in the region near the middle line, while the other region close to the outer wall has only a few weak SHG signals. The latter is the marginal zone; because of the lighter color of the glia cells, it is also called “white matter.” More-over, from the enlarged image 关Fig. 3共b兲兴, SHG from cell mitosis共arrow兲 can only be found in the ventricular zone, a narrow region close to the lumen. Zooming in again, we could see more clearly the cells关THG in Fig. 3共c兲兴 and the mitotic spindles 关SHG in Fig. 3共c兲; arrow兴. Besides the ventricular zone, the part between the ventricular and marginal zone is the mantle zone, the so-called gray matter. According to a previous study, mitosis will only occur in the ventricular zone, and differentiated cells will leave this region to become glia or ganglia cells.46While glia cells distribute mostly over the marginal zone, ganglia cells will elongate their nerve fibers into both mantle and marginal zones in the direction perpen-dicular to the neural tube.46Thus, strong SHG signals arising from the nerve fibers关arrowhead in Fig. 3共b兲兴 can be used to record the development and elongation of the neurons. Through long-term monitoring of the ventricular zone, the above-mentioned cell division and differentiation behaviors were all successfully tracked in vivo with HOM. Moreover, this cell cycle not only occurs in the brain but also takes place in other organs, such as the eyes. Moving our focus to the outer layer of the retina, called the optic lumen, similar to the
Fig. 4 Reconstructed 3D HOM images of the共a兲 hindbrain of a prim-12-stage and共b兲 midbrain of a 25-somite-stage zebrafish embryo. The dotted arrow shows the posterior-to-anterior direction. In 共a兲, 3D structures of the neural tube and optic vesicles are revealed by THG, while SHG shows the 3D neural network in the neural tube. From THG, four sections of rhombomere, r3共bottom兲–r6 共top兲, are shown in this image. THG in共b兲 shows the cavity in the midbrain 共dotted line兲, while no SHG is shown in 共b兲. Scale bar: 50m. THG and SHG are denoted by blue and green colors, respectively.
Fig. 5 HOM images of the zebrafish eye.共a兲 The left eye of a live 14-somite-stage embryo with the left side to the top. The flat tissue named optic vesicle共OV兲 and the silt, optic lumen 共OL, arrow兲, were shown by THG. At this stage, only few SHG from mitotic spindles could be found near the optic lumen.共b兲 The left eye of a live prim-15-stage embryo. The lens共L兲 and retina 共R兲 were clearly observed through THG, and the nerve fibers elongated across the retina were picked up by SHG, respectively.共c兲 The eye of a live 60-hpf embryo. By superimposing each section at different depths, the optic nerve from the lens共L兲 to the neural tube 共NT兲 was revealed by SHG 共ar-row兲. 共d兲 HOM image obtained from a paraffin section of a 4-day eye. Strong SHG could be found in layers full of nerve fibers共arrowhead兲, the optic nerve共dotted arrow兲, and the outer segment of the photore-ceptor共arrow兲. Scale bar: 100m. THG and SHG are denoted by blue and green colors, respectively.
brain development, SHG signals from cell mitosis could also be found关arrow in Fig. 3共d兲兴. By in vivo tracking of the SHG signals, we have also successfully identified the regions where the cell cycle took place without using any dye or fluores-cence technique.
3.3 3D Reconstructed Image of the Neural Tube
Due to the nonlinearity of the higher-order harmonic genera-tions, localized excitation and submicron lateral resolution 共with 1-m axial resolution兲 can all be achieved even with a 0.9 NA objective. Thus, HOM provides the excellent optical sectioning power inside a live embryo to reveal its 3D micro-structures. We put a prim-5-stage live zebrafish embryo dorsal to the top and moved the scanning focal plane from the dorsal to the ventral side with a 1-m axial step between adjacent 2D sections. A series of THG images 共shown by blue color兲 obtained from different depths can be reconstructed to show the 3D microstructures, for example, the hindbrain and the otic vesicles 关Fig. 4共a兲兴. From THG, four sections of rhom-bomere, r3 共bottom兲–r6 共top兲, were shown in this image.47 SHG from nerve fibers can be reconstructed to reveal the 3D neural network inside the neural tube. Moving the scanning plane to the midbrain of a 25-somite-stage live embryo and collecting only the THG signals, we can clearly observe the morphological structures around the cavity共marked with the dotted line兲 from the process of cavitation. Because no mark-ers and no physical sectioning were used, 3D structures can be revealed without any misgivings resulting from direct or indirect damages to the embryo. Combined with the least-invasive nature of the demonstrated technique, it is no longer difficult to study in vivo the 3D morphology of the whole brain development on a long-term basis.
3.4 In Vivo Observation of Eye Development
From the results shown above, long-term in vivo observation and the 3D imaging of the brain development were carried out on the basis of the least-invasive nature, highly penetrative capability, and submicron lateral resolution provided by HOM. Combined with SHG arising from mitotic spindles and nerve fibers, the eye, an important part of the peripheral ner-vous system, could also be studied. Due to the simply char-acterized and similar structure of zebrafish eyes correspond-ing to human eyes, the zebrafish offers a good model for understanding the eye diseases.
Development of eyes is known to be later than that of brain. From the image shown in Fig. 2共d兲, the primordium of eyes besides the neural rod could be observed at the 14-somite stage. Due to the fact that the observed embryo was free to move without any spatial constraint, the observation in one specific embryo was always limited to some specific angles that we cannot control. By using another 14-somite-stage live embryo, which is different from that shown in Fig. 2, and setting it with the left side upward during the observation, a flat tissue with a slit in the middle was revealed through THG signals关Fig. 5共a兲兴; only few SHG could be found near the slit 关SHG may be too weak to be identified in Fig. 5共a兲兴. When we enlarged the sectioned HOM image, it was interesting to see that SHG originated from mitotic spindles. According to the study of eye development,48 this tissue is called the optic vesicle and the slit is the optic lumen, which has been
men-tioned in the discussion of Fig. 3共d兲. By continuously moni-toring the development process in the same embryo, this flat tissue could be found to transform into the shape of a cup, called the eye cup, at the prim-5 stage, and the lens could also be distinguished then. Just after another 4 – 5 hr at the prim-12 to the prim-14 stage, little SHG was found at the bottom of the eye cup, which was then called the retina. After the prim-14 stage, the observed SHG gradually became denser and stronger in the retina. It was shown that the first neuron in the retina was born and begins to elongate its nerve fibers at about the prim-12 stage to the prim-14 stage,48 at which we found SHG signals in the retina. Figure 5共b兲 shows an optical section of the left eye of the live prim-15-stage zebrafish embryo. The outline of the lens and the retina was shown distinctly by the THG modality, while the SHG re-vealed the nerve fibers in the early developed retina.
By observing in vivo another live 60-hpf共the embryo was kept at 28° C before observation兲 embryo with its left side upward and optically sectioning the eyes downward from the lens to the retina and then the neural tube, SHG from optic nerves was observed from the lens to the neural tube. Figure 5共c兲 shows the superimposed image of images obtained from different depths. In addition to the optical nerves 关arrow in Fig. 5共c兲兴, strong signals in the SHG channel were also found at the bottom of the retina. Most interesting was that different from the results in Dombeck et al.,40SHG also arose from the optical nerve关arrow in Fig. 5共c兲兴, which is known to consist of nerve fibers with the myelin sheath. In order to further identify the source of SHG at the bottom of the retina, we used a paraffin section of an eye of a 4-day共the embryo was kept at28° C before sectioning兲 zebrafish embryo 关Fig. 5共d兲兴. As expected, SHG signals had good contrast in every layer full of nerve fibers, including inner and outer plexform layers 关arrowhead in Fig. 5共d兲兴 and optical nerve 关dotted arrow in Fig. 5共d兲兴. Besides the layer full of nerve fibers, the source of strong SHG signals was found to be the outer segment of the photoreceptors关arrow in Fig. 5共d兲兴. As the same origin for the SHG in grana,15 the strong SHG observed in the outer seg-ment was the result of the stacked membranes.
According to different characteristics, SHG signals carry much information about how cells are behaving共for example, the cell mitosis process and the construction of nerve fibers兲, while THG shows us the morphological changes during the development process. Combined with the capability for long-term in vivo observation, HOM offers an excellent tool to study eye development. Many studies, such as the repair of the optic nerve and the disease-causing genes of eyes, can be carried out by observing the repairing process and the mor-phological changes resulting from the mutation of the disease-causing genes.
4 Conclusion
In this work, by utilizing the endogenous SHG and THG sig-nals, we have successfully observed in vivo the complete ver-tebrate embryonic nervous development from the very begin-ning with a submicron lateral resolution, for the first time. The SHG contrasts were found to be provided by the polarized nerve fibers, either myelinated or unmyelinated, the mitosis spindles, and the outer segments of the photoreceptors. THG was used to reveal 3D morphological changes. The complete
and dynamic 3D development of the nervous system within a live zebrafish embryo was successfully recorded continuously for more than20 hr without any fluorescence markers. Since the THG process is not limited by the time of gene expression and differentiation as fluorescence-based techniques are, the observable stages can be advanced to the very beginning of the whole development process, at least14 hr sooner than the fluorescence-based technique. The complete 3D brain devel-opment from a neural plate to a neural tube can be uncovered without any treatment on the studied live specimens. Since no fluorophores and live markers are needed, toxicity, pho-tobleaching, and other biological as well as genetic environ-ment modifications can all be completely avoided. After ob-serving the brain development of several tens of zebrafish embryos, with nonstop, continuous observation time in a single embryo, even up to20 hr the embryos can all develop normally into the larva stages. We have, for the first time, also reported the generation of SHG from myelinated nerve fibers and from the outer segment of the photoreceptors with a stacked membrane structure. Furthermore, with the help of SHG-signaled mitosis process, we showed the possibility to track neural stem cells without using fluorescence markers. Our study clearly indicates the fact that higher-harmonics-based optical microscopy has the strong potential to long-term
in vivo study of the nervous system, including genetic
disor-ders of the nervous system, axon pathfinding, neural regenera-tion, neural repair, and neural stem cell development.
Acknowledgments
The authors would like to acknowledge the support by the National Health Research Institute through Grant NHRI-EX95-9201EI and the NTU Center for Genomic Medicine of Taiwan.
References
1. C.-K. Sun, “Higher harmonic generation microscopy,” Adv. Biochem.
Eng./Biotechnol. 95, 17–56共2005兲.
2. R. W. Boyd, Nonlinear Optics, 2nd ed., Academic Press, Boston, Mass.共1992兲.
3. D. Yelin and Y. Silberberg, “Laser scanning third-harmonic-generation microscopy in biology,” Opt. Express 5, 169–175共1999兲. 4. D. Oron, D. Yelin, E. Tal, S. Raz, R. Fachima, and Y. Silberberg, “Depth-resolved structural imaging by third-harmonic generation mi-croscopy,” J. Struct. Biol. 147, 3–11共2004兲.
5. T. Y. F. Tsang, “Optical 3rd-harmonic generation at interfaces,” Phys.
Rev. A 52, 4116–4125共1995兲.
6. J. A. Squier, M. Muller, G. J. Brakenhoff, and K. R. Wilson, “Third harmonic generation microscopy,” Opt. Express 3, 315–324共1998兲. 7. Y. Barad, H. Eisenberg, M. Horowitz, and Y. Silberberg, “Nonlinear
scanning laser microscopy by third harmonic generation,” Appl.
Phys. Lett. 70, 922–924共1997兲.
8. M. Muller, J. Squier, K. R. Wilson, and G. J. Brakenhoff, “3D mi-croscopy of transparent objects using third-harmonic generation,” J.
Microsc. 191, 266–274共1998兲.
9. S.-W. Chu, S.-P. Tai, C.-L. Ho, C.-H. Lin, and C.-K. Sun, “High-resolution simultaneous three-photon fluorescence and third-harmonic-generation microscopy,” Microsc. Res. Tech. 66, 193–197 共2005兲.
10. V. Barzda, “Visualization of mitochondria in cardiomyocytes by si-multaneous harmonic generation and fluorescence microscopy,” Opt.
Express 13, 8263–8276共2005兲.
11. A. C. Millard, D. N. Fittinghoff, P. W. Wiseman, M. Muller, G. J. Brakenhoff, J. A. Squier, and K. R. Wilson, “Three dimensional, third harmonic microscopy of living systems,” Biophys. J. 78, 800Plat Part 2共2000兲.
12. D. Debarre, W. Supatto, and E. Beaurepaire, “Structure sensitivity in third-harmonic generation microscopy,” Opt. Express 30, 2134–2136 共2005兲.
13. S.-W. Chu, S.-Y. Chen, T.-H. Tsai, T.-M. Liu, C.-Y. Lin, H.-J. Tsai, and C.-K. Sun, “In vivo developmental biology study using noninva-sive multi-harmonic generation microscopy,” Opt. Express 11, 3093– 3099共2003兲.
14. C.-K. Sun, S.-W. Chu, S.-Y. Chen, T.-H. Tsai, T.-M. Liu, C.-Y. Lin, and H.-J. Tsai, “Higher harmonic generation microscopy for develop-mental biology,” J. Struct. Biol. 147, 19–30共2004兲.
15. S.-W. Chu, I.-H. Chen, T.-M. Liu, C.-K. Sun, S.-P. Lee, B.-L. Lin, P. C. Cheng, M.-X. Kuo, D.-J. Lin, and H.-L. Liu, “Nonlinear bio-photonic crystal effects revealed with multimodal nonlinear micros-copy,” J. Microsc. 208, 190–200 Part 3共2002兲.
16. J. Y. Huang, Z. P. Chen, and A. Lewis, “2nd-harmonic generation in purple membrane-poly共vinyl alcohol兲 films—probing the dipolar characteristics of the bacteriorhodopsin chromphore in br570 and m412,” J. Phys. Chem. 93, 3314–3320共1989兲.
17. W. Mohler, A. C. Millard, and P. J. Campagnola, “Second harmonic generation imaging of endogenous structural proteins,” Methods 29, 97–109共2003兲.
18. S.-W. Chu, I.-H. Chen, T.-M. Liu, P. C. Cheng, and C.-K. Sun, “Mul-timodal nonlinear spectral microscopy based on a femtosecond Cr: forsterite laser,” Opt. Lett. 26, 1909–1911共2001兲.
19. P. J. Campagnola, A. C. Millard, M. Terasaki, P. E. Hoppe, C. J. Malone, and W. A. Mohler, “Three-dimensional high-resolution second-harmonic generation imaging of endogenous structural pro-teins in biological tissues,” Biophys. J. 82, 493–508共2002兲. 20. P. J. Campagnola and L. M. Loew, “Second-harmonic imaging
mi-croscopy for visualizing biomolecular arrays in cells, tissues and or-ganisms,” Nat. Biotechnol. 21, 1356–1360共2003兲.
21. S.-W. Chu, S.-Y. Chen, G.-W. Chern, T.-H. Tsai, Y.-C. Chen, B.-L. Lin, and C.-K. Sun, “Studies of共2兲/共3兲tensors in submicron-scaled bio-tissues by polarization harmonics optical microscopy,” Biophys.
J. 86, 3914–3922共2004兲.
22. R. M. Williams, W. R. Zipfel, and W. W. Webb, “Interpreting second-harmonic generation images of collagen I fibrils,” Biophys. J. 88, 1377–1386G共2005兲.
23. G. Cox, E. Kable, A. Jones, I. K. Fraser, F. Manconi, and M. D. Gorrell, “3-dimensional imaging of collagen using second harmonic generation,” J. Struct. Biol. 141, 53–62共2003兲.
24. A. F. Schier, S. C. Neuhauss, M. Harvey, J. Malicki, L. SolnicaKre-zel, D. Y. R. Stainier, F. Zwartkruis, S. Abdelilah, D. L. Stemple, Z. Rangini, H. Yang, and W. Driever, “Mutations affecting the develop-ment of the embryonic zebrafish brain,” Developdevelop-ment 123, 165–178 共1996兲.
25. F. S. Foster, C. J. Pavlin, K. A. Harasiewicz, D. A. Christopher, and D. H. Turnbull, “Advances in ultrasound biomicroscopy,” Ultrasound
Med. Biol. 26, 1–27共2000兲.
26. Y. Z. Wadghiri, J. A. Blind, X. H. Duan, C. Moreno, X. Yu, A. L. Joyner, and D. H. Turnbull, “Manganese-enhanced magnetic reso-nance imaging 共MEMRI兲 of mouse brain development,” NMR
Biomed. 17, 613–619共2004兲.
27. M. Modo, K. Mellodew, D. Cash, S. E. Fraser, T. J. Meade, J. Price, and S. C. R. Williams, “Serial in vivo magnetic resonace imaging of stroke-induced transhemispheric neural stem cell migration,” Exp.
Neurol. 181, 100–100共2003兲.
28. S. Yazdanfar, A. M. Rollins, and J. A. Izatt, “In vivo imaging of human retinal flow dynamics by color Doppler optical coherence to-mography,” Arch. Ophthalmol. (Chicago) 121, 235–239共2003兲. 29. T. M. Yelbuz, M. A. Choma, L. Thrane, M. L. Kirby, and J. A. Izatt,
“Optical coherence tomography—a new high-resolution imaging technology to study cardiac development in chick embryos,”
Circu-lation 106, 2771–2774共2002兲.
30. C. Palmes-Saloma and C. Saloma, “Long-depth imaging of specific gene expressions in whole-mount mouse embryos with single-photon excitation confocal fluorescence microscopy and FISH,” J. Struct.
Biol. 131, 56–66共2002兲.
31. J. C. Kasemeier-Kulesa, P. M. Kulesa, and F. Lefcort, “Imaging neu-ral crest cell dynamics during formation of dorsal root ganglia and sympathetic ganglia,” Development 132, 235–245共2005兲.
32. A. D. Chalmers, B. Strauss, and N. Papalopulu, “Oriented cell divi-sions asymmetrically segregate aPKC and generate cell fate diversity in the early Xenopus embryo,” Development 130, 2657–2668共2003兲.
33. E. S. Ruthazer and H. T. Cline, “Multiphoton imaging of neurons in living tissue: Acquisition and analysis of time-lapse morphological data,” Real-Time Imag. 8, 175–188共2002兲.
34. M. J. Levene, D. A. Dombeck, K. A. Kasischke, R. P. Molloy, and W. W. Webb, “In vivo multiphoton microscopy of deep brain tissue,” J.
Neurophysiol. 91, 1908–1912共2004兲.
35. E. Brustein, N. Marandi, Y. Kovalchuk, P. Drapeau, and A. Konnerth, “In vivo monitoring of neuronal network activity in zebrafish by two-photon Ca2+imaging,” Pfluegers Arch. 446, 766–773共2003兲.
36. C. Stosiek, O. Garaschuk, K. Holthoff, and A. Konnerth, “In vivo two-photon calcium imaging of neuronal networks,” Proc. Natl.
Acad. Sci. U.S.A. 100, 7319–7324共2003兲.
37. J. Liu, S. A. Ernst, S. E. Gladycheva, Y. Y. Lee, S. I. Lentz, C. S. Ho, Q. Li, and E. L. Stuenkel, “Fluorescence resonance energy transfer reports properties of syntaxin1a interaction with Munc18-1 in vivo,”
Biol. Chem. 279, 55924–55936共2004兲.
38. J. N. Post, K. A. Lidke, B. Rieger, and D. J. Arndt-Jovin, “One- and two-photon photoactivation of a paGFP-fusion protein in live
Droso-phila embryos,” FEBS Lett. 579, 325–330共2005兲.
39. K. Konig, “Multiphoton microscopy in life sciences,” J. Microsc. 200, 83–104共2000兲.
40. D. A. Dombeck, K. A. Kasischke, H. D. Vishwasrao, M. Ingelsson, B. T. Hyman, and W. W. Webb, “Uniform polarity microtubule as-semblies imaged in native brain tissue by second-harmonic genera-tion microscopy,” Proc. Natl. Acad. Sci. U.S.A. 100, 7081–7086
共2003兲.
41. D. A. Dombeck, M. Blanchard-Desce, and W. W. Webb, “Optical recording of neuronal action potentials with second-harmonic genera-tion microscopy,” Biophys. J. 86, 317A–317A Part 2共2004兲. 42. S.-P. Tai, T.-H. Tsai, W.-J. Lee, D.-B. Shieh, Y.-H. Liao, H.-Y. Huang,
K.Y.-J. Zhang, H.-L. Liu, and C.-K. Sun, “Optical biopsy of fixed human skin with backward-collected optical harmonics signals,” Opt.
Express 13, 8231–8242共2005兲.
43. N. Milos and A. D. Dingle, “Dynamics of pigment pattern formation in the zebrafish, Brachydanio rerio.共1兲 Establishment and regulation of the lateral line melanophore stripe during the first eight days of development,” J. Exp. Zool. 205, 205–216共1978兲.
44. C. B. Kimmel, W. W. Ballard, S. R. Kimmel, B. Ullmann, and T. F. Schilling, “Stages of embryonic development of the zebrafish,” Dev.
Dyn. 203, 253–310共1995兲.
45. G. B. Downes, J. A. Waterbury, and M. Granato, “Rapid in vivo labeling of identified zebrafish neurons,” Genesis 34, 196–202 共2002兲.
46. C. B. Moens and V. E. Prince, “Constructing the hindbrain: Insights from the zebrafish,” Dev. Dyn. 224, 1–17共2002兲.
47. S. F. Gilbert, Developmental Biology, 7th ed., Sinauer Associates, Sunderland, Mass.共2003兲.
48. Z. Li, N. M. Joseph, and S. S. Easter, Jr., “The morphogenesis of the zebrafish eye, including a fate map of the optic vesicle,” Dev. Dyn. 218, 175–188共2000兲.