行政院國家科學委員會專題研究計畫 期中進度報告
葛瑞夫茲氏病基因研究-以家族為基礎之關聯研究(2/3)
計畫類別: 個別型計畫 計畫編號: NSC92-3112-B-002-009- 執行期間: 92 年 05 月 01 日至 93 年 04 月 30 日 執行單位: 國立臺灣大學醫學院內科 計畫主持人: 張天鈞 共同主持人: 范盛娟,楊偉勛 計畫參與人員: 陳沛隆 報告類型: 完整報告 處理方式: 本計畫可公開查詢中 華 民 國 93 年 4 月 27 日
1 中文摘要 葛瑞夫茲氏病是一種常見的具有器官專一性之自體免疫疾病。它屬於人類複雜性疾病,而 好發於具有易感受性體質之個體。過去十年來有相當多的研究者投入心血,然而,究竟哪 些基因是此疾病的易感受基因卻仍然眾說紛紜。CTLA4 是一個重要的免疫調節分子,而也 一直被視為是葛瑞夫茲氏病易感受基因的可能標的,然而,到目前為止,所有在非高加索 人種所做的家族性研究中,從來沒有找到 CTLA4 是本疾病基因的證據。為了找尋本疾病之 易感受基因,並釐清 CTLA4 在非高加索人種中是否具有遺傳學上的重要性,我們針對在台 灣的漢民族做了葛瑞夫茲氏病易感受基因的家族研究。本研究共收集 171 個純粹的葛瑞夫 茲氏病家族,內含 403 個罹病的個案以及 274 個未罹病之家族對照者,這是到目前為止本 疾病全球最大的獨立家族研究。我們以 CTLA4 為目標基因來做遺傳流行病學的檢驗,總共 做了九個微衛星標幟(以 CTLA4 為中心,前後共 24cM 的距離)以及七個單一核苷酸多型性 變異點(SNP)的基因定型。我們發現,無母數連鎖分析得到的最大多點性 NPL 值為 1.57 (P = 0.047),位置就是在 CTLA4 上,而家族性相關研究也得到統計學上顯著的結果(P = 0.031)。我們的結構果支持 CTLA4 基因和葛瑞夫茲氏病在漢民族具有連鎖以及相關,目前, 正針對這個區域做功能性的研究。此外,我們也對其他可能與本疾病相關之區域及基因, 進行連鎖分析與相關研究,這些區域與基因包括了 5q31-q33,Pendrin gene(7q31),HLA 區域(6p),Thyrostimulin 區域(14q31),以及其他免疫相關基因等等。 關鍵詞: 葛瑞夫茲氏病,基因,CTLA4,家族研究,漢民族,連鎖分析,相關研究
2
ABSTRACT
Graves’ disease (GD), a common organ-specific autoimmune disorder with clinical importance, is a multifactorial disease and develops in genetically susceptible individuals. Despite much effort during the past decade, the susceptibility genes of GD are still uncertain. The cytotoxic T lymphocyte antigen-4 (CTLA4) is an important negative regulator of antigen-activated immune response, and is among the most possible susceptibility genes of GD. However, up to now, none of family-based studies in non-Caucasian populations show linkage or association between CTLA4 and GD. To search for the susceptibility genes of GD, and to clarify the role of CTLA4 to GD outside Caucasian population, we conducted this study in Chinese-Han pedigrees in Taiwan. We enrolled 403 affected and 274 unaffected individuals in 171 pure GD families, which is the single largest family dataset in the world. As a candidate gene approach, we typed 9 microsatellite markers spanning 24 cM around CTLA4 gene, and 7 SNP markers. Non-parametric linkage analysis peaked around CTLA4 with a multipoint NPL score of 1.57 (P = 0.047). Family-based association test demonstrated association with GD at a promoter region SNP (P=0.031) and the promoter-to-exon 1 haplotype (P=0.029). Our results support that CTLA4 is both linked to and associated with GD in Chinese-Han population in Taiwan. Currently, we are performing functional study of the different haplotypes of CTLA4 gene. In addition, we are also carrying on linkage and association study of other candidate regions and genes, including 5q31-q33, pendrin gene (7q31), HLA region (6p), thyrostimulin region (14q31) and other immune related genes.
Key words: Graves’ disease, gene, CTLA4, family-based studies, Chinese-Han, linkage analysis,
3
INTRODUCTION
Graves’ disease (GD) is a common organ-specific autoimmune disorder characterized by hyperthyroidism, diffuse goiter, thyroid-specific antibodies, ophthalmopathy and/or dermopathy (1). Its prevalence is around 1.0-1.6% in the general population (2-4). The etiology of GD is generally accepted to be multifactorial (1, 5). There is strong evidence supporting the role of genetic effect, including family clustering (6), increased sibling risk ratio relative to the general population, λs, of about 8 to 15 (6, 7), and much higher concordance rate in monozygotic twins than in dizygotic twins (0.35 vs. 0.03) (8). A statistic model based on the data from 8,966 Danish twin pairs suggested that 79% of the predisposition to GD is attributed to genetic factors (8). The lack of a clear inheritance pattern suggests that multiple genes are involved in pathogenesis of GD (9, 10).
During the last decade, many investigators have focused on identifying the genetic
contributors of GD (10). Population-based case-control studies ended up with inconsistent reports after testing various candidate genes, which included human leukocyte antigen (HLA) (11-14), TSH receptor (15, 16), T-cell receptor (17), cytotoxic T lymphocyte antigen-4 (CTLA4) (18-23), tumor necrosis factor (24, 25), and Vitamin D receptor (26), etc. Family-based linkage or
association studies, even after three genome-wide scans of GD (27-29), were also frustrated by low reproducibility. Among the loci with positive results from family-based study (14, 27, 30-36), such as GD1, GD2, GD3, CTLA4, HLA, 18q21, Xp11, and 5q31, only CTLA4, HLA and GD2 could be replicated by another different research team .
The CTLA4 is an immunoregulatory molecule expressed on the surface of T lymphocytes, and serves as a key negative regulator for antigen-activated immune response (37). Its gene, located on chromosome 2q33, is among the most likely susceptibility genes of GD (10). Many population-based studies in different ethnic background showed association (18-21, 38-42), although some others reported the opposite (22, 23). Linkage or family-based association study, on the contrary, provided much less support. Only two family-based studies in the UK (35, 36) observed linkage or association, while all the other researches in the US (27), Japan (28), China (29), and Tunisia (43) failed to detect the effect.
Here, from Chinese-Han population in Taiwan, we enrolled 677 individuals in 171 multiplex pedigrees, which is the single largest family dataset of pure GD in the world. We tested CTLA4 as a candidate locus and performed non-parametric linkage analysis and family-based association study. Our result supports that CTLA4 confers susceptibility to GD in Chinese-Han population in Taiwan. In addition, we are also carrying on linkage and association study of other candidate regions and genes, including 5q31-q33, pendrin gene (7q31), HLA region (6p), thyrostimulin region (14q31) and other immune related genes.
4
SUBJECTS AND METHODS
Clinical assessment and family ascertainment
All the individuals were interviewed and assessed by doctors specializing in endocrinology. The diagnosis of GD was made when at least two of the following four criteria were fulfilled: documented hyperthyroidism, diffuse goiter, ophthalmopathy or dermopathy, and TSH receptor antibody. After the informed consent and questionnaires were obtained, blood samples were collected for DNA preparation and biochemical measurements. This project was approved by the Institutional Review Board of National Taiwan University Hospital.
We focused on population of pure Chinese Han descent, and excluded pedigrees with aboriginal or foreign ancestry. We collected pure GD pedigrees, and excluded the whole families if any one of their individuals was affected with Hashimoto’s thyroiditis. Pedigrees were
ascertained through a GD proband attending the Outpatient Clinic of National Taiwan University Hospital or one of its cooperative clinic, Far Eastern Polyclinic.
Genotyping
Genomic DNA was extracted from peripheral blood with PureGene® kit (Gentra Systems Corp.) according to the standard protocol from the manufacturer.
For microsatellite genotyping, oligonucleotide primers were chosen from Applied Biosystems microsatellite panels (ABI PRISM® Linkage Mapping Set v 2.5), or designed according to published sequences in the genome database (http://gdbwww.gdb.org/). Fluorescence-labeled primers were purchased from Applied Biosystems Corp.. PCR was
performed in 10 µl reaction volume containing 10 ng genomic DNA, 5 pmol of each primer, PCR buffer (50 mM KCL, 10 mM Tris-HCL with pH 8.3, 1.5 mM MgCl2, 200 µM each of
deoxy-NTPs), and 1 U of AccuPrime® Taq polymerase (Invitrogen Corp.). Reaction mixtures were heated at 95℃ for 5 min, then cycled for 35 times with denaturation at 95℃ for 30 sec, annealing at 55℃ for 30 sec, and extension at 68℃ for 30 sec, and followed by a final extension at 68℃ for 10 min. After PCR, 3 µl of the product was mixed with 0.5 µl internal size standard and 10 µl deionized formamide, denatured, and separated using an ABI PRISM® 3100 Genetic Analyzer (Applied Biosystems Corp.). Allele calling was performed using Genotyper® Software v 3.7. Each genotype was reviewed visually by two members of the research team.
For SNP genotyping, we adapted MassARRAY (SEQUENORM, Inc., San Diego, CA, USA) at the genotyping core facility of Academia Sinica at Taipei, or the melting curve analysis system for mutation detection of LightCycler® (Roche Diagnostic Corp.).
Statistic analyses
For linkage analysis, we calculated non-parametric linkage (NPL) scores by using the multipoint algorithm in GENEHUNTER program (44) version 2.0. We used the ALL function, which examines all affected individuals simultaneously.
For association study, we used the family-based association test (FBAT) package (45). It provides a z statistic that tests the composite null hypothesis of no linkage or no disequilibrium. FBAT excel conventional transmission disequilibrium test (TDT) in being able to use data from all family members, not just case-parent trios.
5
RESULTS
Set up the single largest dataset in the world
We had a difficult time collecting families during the past 1 year. Because the pandemics of SARS, we didn’t get new cases for about 6 months. Fortunately, after the SARS episode, we collected additional 41 new ASPs. Thus far, our family dataset contains 403 affected individuals and their 274 unaffected family members in 171 multiplex families. The total number of our ASPs is 173 independent pairs, and the total number of trios (not all independent) is 399. It is by far the single largest family dataset of Graves’ disease in the world, based on the available literatures from PubMed (http://www.ncbi.nlm.nih.gov/PubMed).
Test candidate loci
As for the candidate loci, we have tested CTLA-4 region, 5q31-q33 region, and Pendrin region. Other two regions, thyrostimulin and HLA regions, are under genotyping and analysis. We are also testing other 17 immune-related or thyroid-specific genes. (Since the data for different regions were analyzed at different time, the case number might be different in the following report.)
CTLA-4 is our start point. The current report included 604 individuals in 150 pedigrees.
Among the pedigrees, 6 (4 %) had one affected individual, 101 (67.3 %) had two, 29 (19.3 %) had three, 8 (5.3 %) had four, and 6 (4 %) had five affected individuals in a single family. There are 357 affected patients, including 288 females (80.7%) and 69 males (19.3%). In the 247 unaffected individuals, there are 122 females and 125 males. Among these pedigrees, there are 127 affected sib-pairs.
For linkage analysis, nine microsatellite markers were genotyped with ABI PRISM 3100 Genetic Analyzer and Genotyper Software version 3.7. The overall successful rate is 98%. For association study, seven SNPs were typed with a melting curve analysis system for mutation detection of LightCycler (Roche Diagnostics, Basel, Switzerland) or MassARRAY (Sequenorm, Inc., San Diego, CA, USA) at the genotyping core facility of Academia Sinica at Taipei. The necessary sequence information for primer and probe design was based on the public genome database (http://www.ncbi.nlm.nih.gov). The sequences of the primers for SNP typing will be available upon request. The overall success rate for the SNP genotyping was 94%. The consistency with Mendelian inheritance of all markers in individual pedigree was checked to confirm the family structure. All the pedigrees included in this report are compatible with Mendelian inheritance. For all markers, by using frequencies from the founders, Hardy-Weinberg equilibrium (HWE) was also checked. All the SNPs reported in this study follow HWE.
Statistic analyses: Non-parametric linkage analyses were performed to locate the positions
of disease genes responsible for GD using the nine microsatellite markers. The methods employ the concept of allele sharing identical-by-descent (IBD) to infer the relative genetic distances
6
between polymorphic markers and susceptible disease genes. In this study, the two-point analysis was conducted by program SIBPAL in software SAGE
(http://darwin.cwru.edu/octane/sage/sage.php). The multipoint non-parametric linkage analyses were calculated using GENEHUNTER (version 2.1, http://linkage.rockefeller.edu/soft/gh/ ) program. We further applied the linkage disequilibrium analyses to increase the resolution of gene mapping based on the seven SNP markers and a dichotomized microsatellite marker. This
microsatellite marker, named as CTLA4 for linkage analysis in this article, was dichotomized to CTLA4_3’UTR_S (the allele with the shortest length) and CTLA4_3’UTR_O (the collection of all the other alleles). The associative structures of the considered genetic markers were
investigated by the coefficients of linkage disequilibrium for any two markers and exhibited by a graphic presentation. The distribution of blocks and the clusters of correlated markers
demonstrated the pattern of association of the considered genetic markers. The analyses were performed with the GOLD software ( http://www.sph.umich.edu/csg/abecasis/GOLD/ ). The family-based association tests were conducted for fine mapping using the seven SNP markers and the dichotomized microsatellite marker. In the tests, the parents and/or unaffected siblings served as the control group to avoid the possible population stratification. The distributions of the transmission frequencies and/or allele frequencies were used to test the linkage disequilibrium among markers and susceptible disease genes in the presence of linkage. For the association test, two methods were employed: (i) family-based association test (FBAT), in which the information from nuclear families with all family configuration was included, and (ii) pedigree disequilibrium test (PDT), in which the information was obtained from extended pedigrees. Analysis using the haplotype information was also carried out by using the software haploFBAT
(http://www.biostat.harvard.edu/~fbat/fbat.htm) to increase the power of the association test.
Results: We genotyped nine microsatellite markers spanning 23.22 cM centered at CTLA4
(Table 1 and Fig 1.). The result of two-point non-parametric linkage analysis (Table 1) using SIBPAL of SAGE program demonstrated increased allele sharing at the D2S2387 (0.531), CTLA4 (0.546) and D2S155 (0.547) markers, with the P value of 0.050, 0.052 and 0.018, respectively. The multipoint NPL score, calculated from the GENEHUNTER program, showed positive finding around the CTLA4 marker, and peaked (NPL score: 1.57, P = 0.047) at the CD28 marker, which is only 0.13 cM upstream to the CTLA4 gene (Fig 1.).
Based on the above findings, we chose seven SNPs (2 at the CD28 and 5 at the CTLA4) for further genotyping (Table 2). These seven SNPs and a dichotomized microsatellite marker at 3’ UTR region of the CTLA4 gene (Table 2) were used in the family-based association test with FBAT program. One SNP in the promoter region of CTLA4 (CTLA4_–1722_T/C) demonstrated an over-transmission of C allele (P=0.031) to GD patients (Table 2). Another SNP in the first exon of CTLA4 (CTLA4_+49_G/A) also showed marginal over-transmission of G allele (P = 0.060) to GD patients. There was no evidence of association between CTLA4_CT60_G/A SNP and GD in our analyses.
Inter-marker linkage disequilibrium coefficients were estimated using the GOLD program. The two SNPs at CD28 were in a LD block, and the five SNP markers at CTLA4 were in another LD block (Table 2). The results of haplotype analysis were shown in Table 3. The most common
7
haplotype (CCCG) in the promoter-exon 1 region of CTLA4 (41.8%, with the combination of C allele at CTLA4_-1722_T/C, C at CTLA4_-1147_C/T, C at CTLA4_-319_C/T, and G at
CTLA4_+49_G/A) was more likely to be transmitted to GD patients (P = 0.029, Table 3). In contrast, the statistical significance disappeared if the SNPs in the 3’ region of CTLA4 gene were included in the haplotypes analysis (data not shown).
In summary, this updated version, compared with our previous report in March 2003, has included more ASPs (127 vs. 92 independent ASPs), and applied FBAT and PDT in family-based association study. The maximal NPL score increased to 1.57 (P=0.047). FBAT demonstrated association with GD at a promoter region SNP (P=0.031) and the promoter-to-exon 1 haplotype (P=0.029). Currently we are cloning the SNPs in the promoter region, and performing functional study.
5q31-q33 region is another candidate locus. It is particularly attractive because the previous
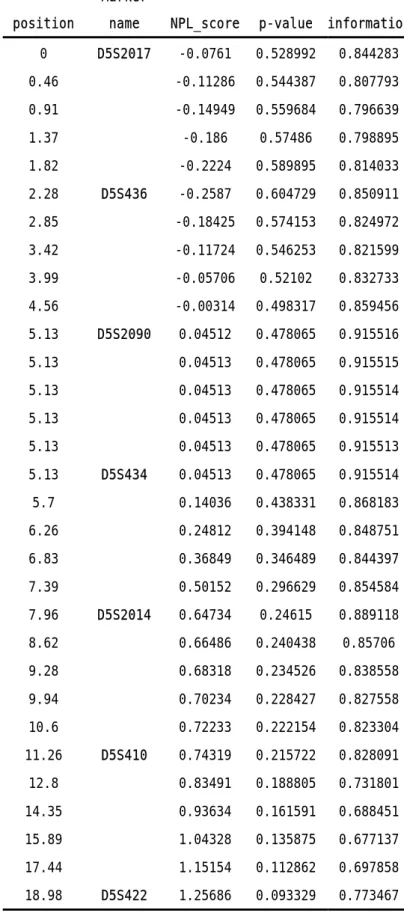
reported linkage came from Japan (28) and China (29). We genotyped 7 microsatellite markers spanning 19 cM in this area. Totally 162 ASPs were included in the analysis. The highest LOD score in two point analysis was 1.12, and the maximal NPL score in multipoint analysis was 1.26 (Table 4), both at D5S422, which happened to be the most telomeric marker we typed. We are typing additional markers around this region.
Pendrin gene at 7q31 was recently reported to be linked to and associated with AITD. Since
the reported region was quite localized, we tested this area with only 5 microsatellite markers spanning 10 cM. Totally 162 ASPs were included in the analysis. The maximal LOD score in two point analysis was 0.181, and the maximal NPL score in multipoint analysis was -0.818 (Table 5). We didn’t proceed to association study in this region.
Two other regions currently under genotyping and data analysis are thyrostimulin region and HLA region (10). Thyrostimulin (14q31) is worth testing because its functional relationship to TSH receptor activation, and its proximity to a previously reported susceptibility gene, GD1. We genotyped 9 microsatellite markers in this region. HLA region has been a strong candidate locus for a long time. We chose 5 microsatellites as our first attempt.
To perform a genome-wide survey
Genome-wide microsatellite scanning has not been launched yet, for two major reasons. The first reason is the delay of family collection. Due to the SARS pandemics, our progress of family enrollment has a delay for about 6 months. Our regular pace is about getting 10 ASPs every month. We hope that we can complete the family collection in the following months. Another
critical reason is the amount of budget. Our total budget for the second and third years was cut
down to less than our original proposal. It is a huge threat to our whole project, because it is extreme difficult, if not impossible, to carry out a genome-wide microsatellite scanning with the budget.
8
DISCUSSION
Based on our largest family dataset of GD in the world, the results support that CTLA4 confers susceptibility to GD. This is for the first time that this effect can be demonstrated in a family-based study in non-Caucasian population, which implies that CTLA4 is a susceptibility gene across different ethnic background. Before our project, only two family-based study in the UK (35, 36) showed linkage or association, while other researches based on pedigrees in the US (27), Japan (28), China (29), and Tunisia (43) failed to detect the effect. Family-based study is of paramount importance because it can eliminate false-positive results due to population
stratification or other pitfalls stick to population-based approach (46-53). One reason for the irreproducibility is about the sample size (54), and the others may relate to strategy
about family ascertainment and study design (see next paragraphs). Our project has enrolled 677 individuals in 171 families, which is about 1.5 to 2-fold the sample size of other studies if only pure GD families were compared.
Our family dataset is also characterized by its homogeneity, which was composed of pure GD pedigrees in Chinese-Han ethnic background. Genetic heterogeneity has long been regarded as a substantial obstacle in genetic study (50-53). One attempt to reduce heterogeneity is to draw samples from single ethnic group, which has been demonstrated useful in a meta-analysis study (55). Another reasonable attempt is to define the disease phenotype as precise as possible. Although GD and Hashimoto’s thyroiditis (HT) might share some common pathophysiology pathways, these two diseases are substantially different in clinical manifestations, laboratory data and histological findings. Previous reports (27, 28) also suggested that there might be different sets of susceptibility genes for GD, HT and autoimmune thyroid disease (AITD, containing both GD and HT); and, HT might be even more heterogeneous than GD (27). We thus decided to focus on GD, and excluded all the pedigrees with aboriginal ancestry or containing HT patients. Our design further reduced the possible heterogeneity during ascertainment; all the individuals were assessed and recruited by one of four endocrinologists at our medical center.
Our design also emphasizes heredity. Every pedigree in our project contains at least two affected first degree relatives (siblings, or parent-child), although not all the affected persons’ blood samples could be obtained. That means we did not collect simplex trios composed of affected probands and their healthy parents, which might have been the most popular family dataset for classical TDT (56). We infer that, in general, affected individuals with solid family history will have stronger genetic dosage than sporadic cases do, and thus promote detection power of genetic study. Similar concept has been proposed previously (57-60). While performing family-based association study, we use FBAT instead of classical TDT. FBAT is able to use information from all family members, and deal with the problem that more than one affected individuals are analyzed in a family (45).
In conclusion, our linkage and family-based association study in the largest dataset
demonstrated CTLA4 is both in linkage to and associated with GD in Chinese Han population in Taiwan. This result and other previous reports in Caucasian suggest CTLA4 gene, or other genes
9
nearby, may be a susceptibility gene of GD with worldwide importance. Further effort is needed to find the exact functional risk allele.
ACKNOLEDGEMENTS
We acknowledge all the GD families who graciously agreed to participate in the study. We are indebted to Dr. Pei-Jer Chen and Dr. Ming-Yang Lai for helpful recommendation and technical support.
10
TABLES
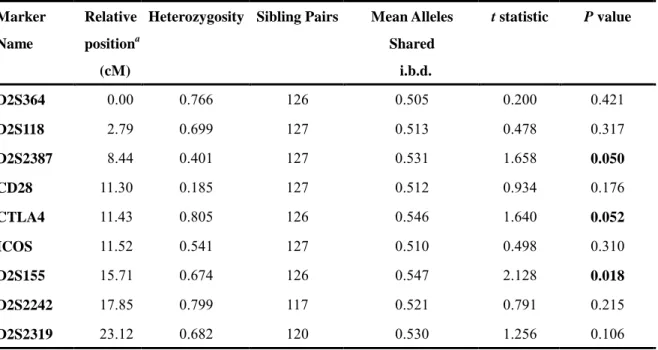
TABLE 1. Microsatellite markers and the results of two-point non-parametric linkage analysis Marker Name Relative positiona (cM)
Heterozygosity Sibling Pairs Mean Alleles Shared i.b.d. t statistic P value D2S364 0.00 0.766 126 0.505 0.200 0.421 D2S118 2.79 0.699 127 0.513 0.478 0.317 D2S2387 8.44 0.401 127 0.531 1.658 0.050 CD28 11.30 0.185 127 0.512 0.934 0.176 CTLA4 11.43 0.805 126 0.546 1.640 0.052 ICOS 11.52 0.541 127 0.510 0.498 0.310 D2S155 15.71 0.674 126 0.547 2.128 0.018 D2S2242 17.85 0.799 117 0.521 0.791 0.215 D2S2319 23.12 0.682 120 0.530 1.256 0.106
11
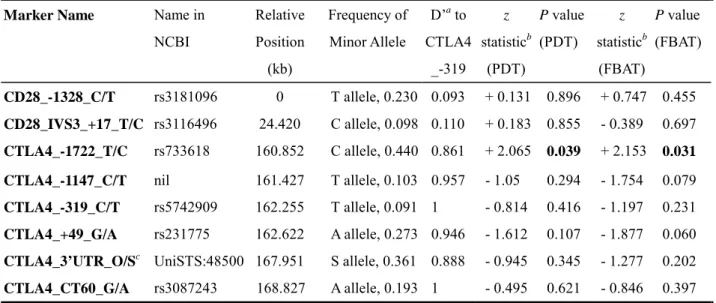
TABLE 2. The results of family-based association test using 7 SNP and 1 dichotomized microsatellite markers
aD’ is the measurement of linkage disequilibrium
bThe sign in this column is the sign of z statistics of the minor allele. The plus sign means over-transmission of the
minor allele, and the minus sign under-transmission..
cCTLA4_3’UTR_O/S is a dinucleotide (AT) microsatellite marker. “S” allele stands for the shortest allele, and “O”
allele stands for the collection of all the other number of repeat.
Marker Name Name in
NCBI Relative Position (kb) Frequency of Minor Allele D’a to CTLA4 _-319 z statisticb (PDT) P value (PDT) z statisticb (FBAT) P value (FBAT) CD28_-1328_C/T rs3181096 0 T allele, 0.230 0.093 + 0.131 0.896 + 0.747 0.455 CD28_IVS3_+17_T/C rs3116496 24.420 C allele, 0.098 0.110 + 0.183 0.855 - 0.389 0.697 CTLA4_-1722_T/C rs733618 160.852 C allele, 0.440 0.861 + 2.065 0.039 + 2.153 0.031
CTLA4_-1147_C/T nil 161.427 T allele, 0.103 0.957 - 1.05 0.294 - 1.754 0.079
CTLA4_-319_C/T rs5742909 162.255 T allele, 0.091 1 - 0.814 0.416 - 1.197 0.231
CTLA4_+49_G/A rs231775 162.622 A allele, 0.273 0.946 - 1.612 0.107 - 1.877 0.060
CTLA4_3’UTR_O/Sc UniSTS:48500 167.951 S allele, 0.361 0.888 - 0.945 0.345 - 1.277 0.202
12
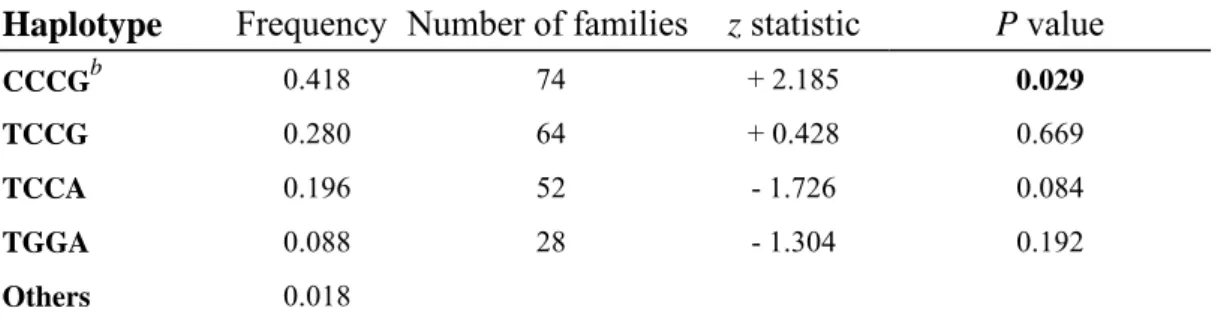
TABLE 3. Association a of 5’ region haplotype of CTLA4 gene with GD
Haplotype Frequency Number of families z statistic P value
CCCGb 0.418 74 + 2.185 0.029
TCCG 0.280 64 + 0.428 0.669
TCCA 0.196 52 - 1.726 0.084
TGGA 0.088 28 - 1.304 0.192
Others 0.018
aThis family-based association test was carried out using the haploFBAT software. bThe haplotype “CCCG” indicates C allele at the three promoter region SNPs (CTLA4
_-1722_T/C, CTLA4_-1147_C/T, and CTLA4_-319_C/T) and “G” allele at the first exon SNP (CTLA4_+49_G/A).
13
TABLE 4. Multipoint linkage analysis of 5q31-q33 region
position
Marker
name NPL_score p-value information 0 D5S2017 -0.0761 0.528992 0.844283 0.46 -0.11286 0.544387 0.807793 0.91 -0.14949 0.559684 0.796639 1.37 -0.186 0.57486 0.798895 1.82 -0.2224 0.589895 0.814033 2.28 D5S436 -0.2587 0.604729 0.850911 2.85 -0.18425 0.574153 0.824972 3.42 -0.11724 0.546253 0.821599 3.99 -0.05706 0.52102 0.832733 4.56 -0.00314 0.498317 0.859456 5.13 D5S2090 0.04512 0.478065 0.915516 5.13 0.04513 0.478065 0.915515 5.13 0.04513 0.478065 0.915514 5.13 0.04513 0.478065 0.915514 5.13 0.04513 0.478065 0.915513 5.13 D5S434 0.04513 0.478065 0.915514 5.7 0.14036 0.438331 0.868183 6.26 0.24812 0.394148 0.848751 6.83 0.36849 0.346489 0.844397 7.39 0.50152 0.296629 0.854584 7.96 D5S2014 0.64734 0.24615 0.889118 8.62 0.66486 0.240438 0.85706 9.28 0.68318 0.234526 0.838558 9.94 0.70234 0.228427 0.827558 10.6 0.72233 0.222154 0.823304 11.26 D5S410 0.74319 0.215722 0.828091 12.8 0.83491 0.188805 0.731801 14.35 0.93634 0.161591 0.688451 15.89 1.04328 0.135875 0.677137 17.44 1.15154 0.112862 0.697858 18.98 D5S422 1.25686 0.093329 0.773467
14
TABLE 5. Multipoint linkage analysis of pendrin gene region (7q31)
position
Marker
name NPL_score p-value information 0 D7S2446 -0.81805 0.80385 0.804716 1 -0.82974 0.807275 0.764028 1.99 -0.84603 0.811976 0.760969 2.99 -0.86696 0.817893 0.780141 3.98 -0.89257 0.825003 0.821911 4.98 D7S501 -0.92293 0.833181 0.900599 5.16 -0.97732 0.847243 0.886523 5.34 -1.0318 0.860507 0.885838 5.53 -1.08637 0.872996 0.892744 5.71 -1.14103 0.884733 0.90755 5.89 D7S496 -1.19578 0.895686 0.937561 5.89 -1.18451 0.893497 0.899149 5.89 -1.17879 0.892372 0.885899 5.89 -1.17862 0.892335 0.885898 5.89 -1.184 0.893385 0.899148 5.89 D7S2459 -1.19494 0.89552 0.93756 6.74 -1.18376 0.893348 0.876278 7.6 -1.17454 0.891523 0.837451 8.45 -1.16723 0.890058 0.80974 9.31 -1.16178 0.888965 0.79141 10.16 D7S486 -1.15814 0.888232 0.785159
15
FIGURE:
FIG 1. Multipoint linkage analysis (using GENEHUNTER package) of nine markers around
CTLA4 at 2q31. The NPL score (black dots) is shown on the left y-axis and the information content (white dots) on the right y-axis, against the marker genetic distance map on the x-axis.
16
REFERENCES
1. Weetman AP 2000 Graves' disease. N Engl J Med 343:1236-48
2. Tunbridge WM, Evered DC, Hall R, et al. 1977 The spectrum of thyroid disease in a
community: the Whickham survey. Clin Endocrinol (Oxf) 7:481-93
3. Jacobson DL, Gange SJ, Rose NR, Graham NM 1997 Epidemiology and estimated
population burden of selected autoimmune diseases in the United States. Clin Immunol Immunopathol 84:223-43
4. Hollowell JG, Staehling NW, Flanders WD, et al. 2002 Serum TSH, T(4), and thyroid
antibodies in the United States population (1988 to 1994): National Health and Nutrition Examination Survey (NHANES III). J Clin Endocrinol Metab 87:489-99
5. DeGroot LJ, Quintans J 1989 The causes of autoimmune thyroid disease. Endocr Rev
10:537-62
6. Brix TH, Kyvik KO, Hegedus L 1998 What is the evidence of genetic factors in the
etiology of Graves' disease? A brief review. Thyroid 8:727-34
7. Vyse TJ, Todd JA 1996 Genetic analysis of autoimmune disease. Cell 85:311-8 8. Brix TH, Kyvik KO, Christensen K, Hegedus L 2001 Evidence for a major role of
heredity in Graves' disease: a population-based study of two Danish twin cohorts. J Clin Endocrinol Metab 86:930-4
9. Farid NR 1992 Understanding the genetics of autoimmune thyroid disease--still an
illusive goal! J Clin Endocrinol Metab 74:495A-495B
10. Vaidya B, Kendall-Taylor P, Pearce SH 2002 The genetics of autoimmune thyroid
disease. J Clin Endocrinol Metab 87:5385-97
11. Badenhoop K, Walfish PG, Rau H, et al. 1995 Susceptibility and resistance alleles of
human leukocyte antigen (HLA) DQA1 and HLA DQB1 are shared in endocrine autoimmune disease. J Clin Endocrinol Metab 80:2112-7
12. Yanagawa T, Mangklabruks A, Chang YB, et al. 1993 Human histocompatibility
leukocyte antigen-DQA1*0501 allele associated with genetic susceptibility to Graves' disease in a Caucasian population. J Clin Endocrinol Metab 76:1569-74
13. Lavard L, Madsen HO, Perrild H, Jacobsen BB, Svejgaard A 1997 HLA class II
associations in juvenile Graves' disease: indication of a strong protective role of the DRB1*0701,DQA1*0201 haplotype. Tissue Antigens 50:639-41
14. Heward JM, Allahabadia A, Daykin J, et al. 1998 Linkage disequilibrium between the
human leukocyte antigen class II region of the major histocompatibility complex and Graves' disease: replication using a population case control and family-based study. J Clin Endocrinol Metab 83:3394-7
15. Cuddihy RM, Dutton CM, Bahn RS 1995 A polymorphism in the extracellular domain
of the thyrotropin receptor is highly associated with autoimmune thyroid disease in females. Thyroid 5:89-95
17
polymorphism of the thyrotropin receptor gene and Graves' disease in United Kingdom and Hong Kong Chinese patients: case control and family-based studies. Thyroid 8:777-80
17. Pickerill AP, Watson PF, Tandon N, Weetman AP 1993 T cell receptor beta chain gene
polymorphisms in Graves' disease. Acta Endocrinol (Copenh) 128:499-502
18. Yanagawa T, Hidaka Y, Guimaraes V, Soliman M, DeGroot LJ 1995 CTLA-4 gene
polymorphism associated with Graves' disease in a Caucasian population. J Clin Endocrinol Metab 80:41-5
19. Donner H, Rau H, Walfish PG, et al. 1997 CTLA4 alanine-17 confers genetic
susceptibility to Graves' disease and to type 1 diabetes mellitus. J Clin Endocrinol Metab 82:143-6
20. Yanagawa T, Taniyama M, Enomoto S, et al. 1997 CTLA4 gene polymorphism confers
susceptibility to Graves' disease in Japanese. Thyroid 7:843-6
21. Braun J, Donner H, Siegmund T, Walfish PG, Usadel KH, Badenhoop K 1998
CTLA-4 promoter variants in patients with Graves' disease and Hashimoto's thyroiditis. Tissue Antigens 51:563-6
22. Heward JM, Allahabadia A, Carr-Smith J, et al. 1998 No evidence for allelic
association of a human CTLA-4 promoter polymorphism with autoimmune thyroid disease in either population-based case-control or family-based studies. Clin Endocrinol (Oxf) 49:331-4
23. Djilali-Saiah I, Larger E, Harfouch-Hammoud E, et al. 1998 No major role for the
CTLA-4 gene in the association of autoimmune thyroid disease with IDDM. Diabetes 47:125-7
24. Badenhoop K, Schwarz G, Schleusener H, et al. 1992 Tumor necrosis factor beta gene
polymorphisms in Graves' disease. J Clin Endocrinol Metab 74:287-91
25. Rau H, Donner H, Usadel KH, Badenhoop K 1997 Polymorphisms of tumor necrosis
factor receptor 2 are not associated with insulin-dependent diabetes mellitus or Graves' disease. Tissue Antigens 49:535-6
26. Ban Y, Taniyama M 2000 Vitamin D receptor gene polymorphism is associated with
Graves' disease in the Japanese population. J Clin Endocrinol Metab 85:4639-43
27. Tomer Y, Barbesino G, Greenberg DA, Concepcion E, Davies TF 1999 Mapping the
major susceptibility loci for familial Graves' and Hashimoto's diseases: evidence for genetic heterogeneity and gene interactions. J Clin Endocrinol Metab 84:4656-64
28. Sakai K, Shirasawa S, Ishikawa N, et al. 2001 Identification of susceptibility loci for
autoimmune thyroid disease to 5q31-q33 and Hashimoto's thyroiditis to 8q23-q24 by multipoint affected sib-pair linkage analysis in Japanese. Hum Mol Genet 10:1379-86
29. Jin Y, Teng W, Ben S, et al. 2003 Genome-wide scan of graves' disease: evidence for
linkage on chromosome 5q31 in chinese han pedigrees. J Clin Endocrinol Metab 88:1798-803
18
major susceptibility locus for Graves' disease (GD-1) to chromosome 14q31. J Clin Endocrinol Metab 82:1645-8
31. Vaidya B, Imrie H, Perros P, et al. 1999 Cytotoxic T lymphocyte antigen-4 (CTLA-4)
gene polymorphism confers susceptibility to thyroid associated orbitopathy. Lancet 354:743-4
32. Vaidya B, Imrie H, Perros P, et al. 2000 Evidence for a new Graves disease
susceptibility locus at chromosome 18q21. Am J Hum Genet 66:1710-4
33. Imrie H, Vaidya B, Perros P, et al. 2001 Evidence for a Graves' disease susceptibility
locus at chromosome Xp11 in a United Kingdom population. J Clin Endocrinol Metab 86:626-30
34. Pearce SH, Vaidya B, Imrie H, et al. 1999 Further evidence for a susceptibility locus on
chromosome 20q13.11 in families with dominant transmission of Graves disease. Am J Hum Genet 65:1462-5
35. Vaidya B, Imrie H, Perros P, et al. 1999 The cytotoxic T lymphocyte antigen-4 is a
major Graves' disease locus. Hum Mol Genet 8:1195-9
36. Heward JM, Allahabadia A, Armitage M, et al. 1999 The development of Graves'
disease and the CTLA-4 gene on chromosome 2q33. J Clin Endocrinol Metab 84:2398-401
37. Kristiansen OP, Larsen ZM, Pociot F 2000 CTLA-4 in autoimmune diseases--a general
susceptibility gene to autoimmunity? Genes Immun 1:170-84
38. Kotsa K, Watson PF, Weetman AP 1997 A CTLA-4 gene polymorphism is associated
with both Graves disease and autoimmune hypothyroidism. Clin Endocrinol (Oxf) 46:551-4
39. Awata T, Kurihara S, Iitaka M, et al. 1998 Association of CTLA-4 gene A-G
polymorphism (IDDM12 locus) with acute-onset and insulin-depleted IDDM as well as autoimmune thyroid disease (Graves' disease and Hashimoto's thyroiditis) in the Japanese population. Diabetes 47:128-9
40. Hadj Kacem H, Bellassoued M, Bougacha-Elleuch N, Abid M, Ayadi H 2001 CTLA-4
gene polymorphisms in Tunisian patients with Graves' disease. Clin Immunol 101:361-5
41. Allahabadia A, Heward JM, Nithiyananthan R, et al. 2001 MHC class II region,
CTLA4 gene, and ophthalmopathy in patients with Graves' disease. Lancet 358:984-5
42. Park YJ, Chung HK, Park DJ, et al. 2000 Polymorphism in the promoter and exon 1 of
the cytotoxic T lymphocyte antigen-4 gene associated with autoimmune thyroid disease in Koreans. Thyroid 10:453-9
43. Maalej A, Bougacha N, Rebai A, et al. 2001 Lack of linkage and association between
autoimmune thyroid diseases and the CTLA-4 gene in a large Tunisian family. Hum Immunol 62:1245-50
44. Kruglyak L, Daly MJ, Reeve-Daly MP, Lander ES 1996 Parametric and nonparametric
linkage analysis: a unified multipoint approach. Am J Hum Genet 58:1347-63
19
tests of association. Genet Epidemiol 19 Suppl 1:S36-42
46. Lander E, Kruglyak L 1995 Genetic dissection of complex traits: guidelines for
interpreting and reporting linkage results. Nat Genet 11:241-7
47. Ioannidis JP, Ntzani EE, Trikalinos TA, Contopoulos-Ioannidis DG 2001 Replication
validity of genetic association studies. Nat Genet 29:306-9
48. Dahlman I, Eaves IA, Kosoy R, et al. 2002 Parameters for reliable results in genetic
association studies in common disease. Nat Genet 30:149-50
49. Long AD, Langley CH 1999 The power of association studies to detect the contribution
of candidate genetic loci to variation in complex traits. Genome Res 9:720-31
50. Cardon LR, Bell JI 2001 Association study designs for complex diseases. Nat Rev Genet
2:91-9
51. Risch NJ 2000 Searching for genetic determinants in the new millennium. Nature
405:847-56
52. Glazier AM, Nadeau JH, Aitman TJ 2002 Finding genes that underlie complex traits.
Science 298:2345-9
53. Schork NJ, Cardon LR, Xu X 1998 The future of genetic epidemiology. Trends Genet
14:266-72
54. Risch N, Merikangas K 1996 The future of genetic studies of complex human diseases.
Science 273:1516-7
55. Altmuller J, Palmer LJ, Fischer G, Scherb H, Wjst M 2001 Genomewide scans of
complex human diseases: true linkage is hard to find. Am J Hum Genet 69:936-50
56. Spielman RS, McGinnis RE, Ewens WJ 1993 Transmission test for linkage
disequilibrium: the insulin gene region and insulin-dependent diabetes mellitus (IDDM). Am J Hum Genet 52:506-16
57. Morton NE, Collins A 1998 Tests and estimates of allelic association in complex
inheritance. Proc Natl Acad Sci U S A 95:11389-93
58. Gu C, Rao DC 1997 A linkage strategy for detection of human quantitative-trait loci. I.
Generalized relative risk ratios and power of sib pairs with extreme trait values. Am J Hum Genet 61:200-10
59. Risch N, Zhang H 1995 Extreme discordant sib pairs for mapping quantitative trait loci
in humans. Science 268:1584-9