國 立 交 通 大 學
生物資訊研究所
碩 士 論 文
使用結構字元集的RNA三級結構比對與
其軟體工具的開發
Alignments of RNA Tertiary Structures
Using a Structural Alphabet and
Development of Their Software Tools
研究生:張演富
指導教授:盧錦隆 博士
使用結構字元集的
RNA 三級結構比對與
其軟體工具的開發
Alignments of RNA Tertiary Structures Using a Structural
Alphabet and Development of Their Software Tools
研究生:張演富 Student:Yen-Fu Chang
指導教授:盧錦隆 博士 Advisor:Dr. Chin Lung Lu
國 立 交 通 大 學
生 物 資 訊 研 究 所
碩 士 論 文
A Thesis Submitted to Institute of Bioinformatics
College of Biological Science and Technology
National Chiao Tung University in partial Fulfillment of the
Requirements for the Degree of Master in
Biological Science and Technology
June 2008
中文摘要
近年來的研究顯示 RNA 分子在細胞內有多樣且重要的生物功能。 以演化的角度而言,RNA 分子結構的保留性會比其分子序列訊息來的 高而不容易改變,因此偵測 RNA 分子三維結構的相似度將有助於了解 RNA 分子本身的功能以及演化關係,而這些關係是無法單靠序列訊息 就可以偵測出來的。然而,在目前存入 PDB 與 NDB 資料庫中 RNA 三 維結構的數量愈來愈多且大小愈來愈大,這些都將造成人工方式去比較 分析這些 RNA 三維結構的困難度。因此,開發出一個快速且精確的自 動化工具程式就變得愈來愈重要。 在本研究中,我們利用向量量子化 (vector quantization) 的分群方 法推導出一個含有 23 個核苷酸結構字元的結構字元集,接著利用此結 構字元集將 RNA 三維結構轉成一維的結構字元序列,最後再利用傳統 的序列比對的方法來比較這些結構字元的一維序列,進而判斷出原RNA 分子三維結構的相似度。除此之外,根據上述的方法,我們也開發出一 個稱之為SARSA 的工具程式可供使用者作線上的分析。在 SARSA 中, 我們提供了兩個工具:可比對兩個RNA 三維結構的 PARTS 與可比對多 個 RNA 三維結構的 MARTS。特別的是在 PARTS 中,我們針對不同的 應用實作出四種比對的方法:(1)用於判斷整個結構相似程度的全域比 對;(2)用於偵測結構模組的半全域比對;(3)用在尋找相似子結構的區域 比對;(4)可去除區域比對中馬賽克效應的正規化區域比對。PARTS 與MARTS 接受 PDB 格式的 RNA 三維結構作為輸入的資料,同時在輸出 結果中,它們都提供圖形的顯示以便使用者可以目視、旋轉、放大與縮 小所比對出來的 RNA 三維的重疊結構。除此之外,我們的實驗結果也 顯示出由PARTS 產生的比對結果是可以與 DIAL 的結果相互比較的,而 且 PARTS 的計算效能也優於 DIAL。實際上在一些例子中,PARTS 比 DIAL 更能夠產生出較正確的全域、半全域、與區域的兩兩比對結果。 SARSA 的 工 具 可 連 結 到 以 下 網 址 使 用 http://bioalgorithm.life.nctu.edu.tw/SARSA/
Abstract
Recently, it has become clear that RNA molecules have a variety of important biological functions in cells. Since structures are typically more evolutionarily conserved than sequences, detecting structural similarities among RNA three-dimensional (3D) structures can bring more significant insights into their functional and even evolutionary relationships that would not be detected by sequence information alone. However, the number and size of RNA 3D structures deposited in the PDB and NDB databases have been substantially and rapidly increasing recently, making it difficult and time-consuming to manually compare and analyze these RNA 3D structures. Therefore, it has become more and more crucial to develop automatic tools that are able to efficiently and accurately perform RNA structural comparison.
In this study, we first use the vector quantization approach to derive a structural alphabet (SA) of 23 nucleotide conformations, and then transform RNA 3D structures into 1D sequences of SA letters, and finally utilize classical sequence alignment methods to compare these 1D SA-encoded sequences for determining their structural similarities. In addition, based on such an SA-based approach, we have developed a novel web-based tool, called SARSA, for public online analysis. In SARSA, we provide two RNA structural alignment tools, PARTS for pairwise alignment of RNA 3D structures and MARTS for multiple alignment of RNA 3D structures. Particularly in PARTS, we have implemented four kinds of pairwise
alignments for a variety of practical applications: (a) global alignment for comparing whole structural similarity, (b) semiglobal alignment for detecting structural motifs, (c) local alignment for finding locally similar substructures, and (d) normalized local alignment for eliminating the mosaic effect of local alignment. Both tools in SARSA take as input RNA 3D structures in the PDB format and in their outputs provide graphical display that allows the user to visually view, rotate and enlarge the superposition of aligned RNA molecules. In addition, our experiments have shown that the pairwise alignments produced by our PARTS were comparable to those obtained by DIAL and the performance computation of PARTS was generally faster than that of DIAL. In some cases, our PARTS can actually produce more accurate global, semiglobal and local pairwise alignments when compared with DIAL. SARSA is available online at http://bioalgorithm.life.nctu.edu.tw/SARSA/.
Acknowledgement
首先我要感謝盧老師兩年來的指導,在研究中突破許多瓶頸,完成 這份論文研究。另外也讓我在報告上、問題思考上修正以往不正確或不 好的習慣與觀念。我也要感謝實驗室的每位同學,除了在研究、課程的 討論上能互相提攜,也讓我研究所生活充實了許多。感謝禮瑋同學不離 不棄,在這兩年一起奮鬥;感謝彥菱學姊兩年來的帶領,讓我可以吃到 新竹各式的美食;感謝慶恩學弟,帶我認識了世界上各種不同的人種以 及歷史傳統,例如土耳其人善用火藥、哥德人雖然只有木牆,但是他們 能訓練出螞蟻般的軍隊,奮勇抵抗外侮;游牧的匈奴人逐水草而居,是 不需要蓋小屋的…;感謝志偉學弟在研究上的幫忙整理數據,讓我能加 快腳步完成研究;感謝智先學弟,讓我在實驗室研究的空檔,能陪我丟 棒球做運動,雖然我曲球太犀利你接不到,科科;感謝忠翰學弟,讓我 知道素食也可吃的很豐盛,也可以吃的很健康。最後感謝交通大學能提 供美好舒適的研究環境,讓我在當中得到無比的收穫。Contents
Chinsese abstract ...I
Abstract... III
Acknowledgement ... V
Centents ... VI
List of tables ...VII
List of figures... VIII
Chapter 1 Introduction... 1
Chapter 2 Methods... 5
2.1 Structural alphabet ... 5
2.2 Hamming-distance-based and BLOSUM-like scoring matrices... 9
2.3 Normalized local alignment... 11
Chapter 3 Implementation of Software Tools ... 15
3.1 Usage of PARTS ... 15
3.2 Usage of MARTS... 19
Chapter 4 Experimental Results ... 22
4.1 ROC curves... 22
4.2 Pairwise global structural alignment... 24
4.3 Pairwise semiglobal structural alignment ... 26
4.4 Pairwise local structural alignment... 28
4.5 Pairwise normalized local structural alignment... 29
4.6 Multiple global structural alignment... 31
List of tables
Table 2-1. Enumeration of the bins obtained by SQ and their boundaries,
as adapted from Table 2-2 in [19]. ...8
Table 2-2. 23 conformational clusters classified by VQ based on α, γ, δ
and ζ torsion angles and their associated letters and four-digit numbers...9
List of figures
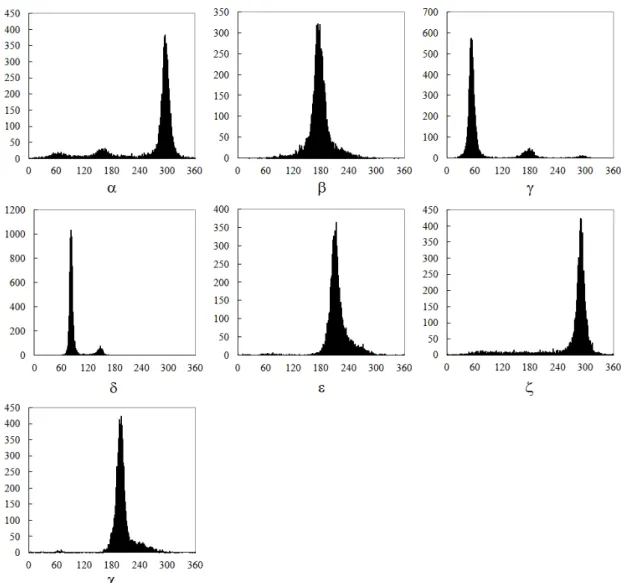
Figure 2-1. Distributions of the seven torsion angles using a dataset of 132
RNAs, where α, γ and δ have clear multiple peaks, whereas β, ε and χ have only a clear peak. Particularly note that the ζ torsion angles has a large tail not present in the other distribution,
although it visually contains a single peak...7
Figure 2-2. Hamming-distance-based scoring matrix...10
Figure 2-3. BLOSUM-like scoring matrix...12
Figure 2-4. A mosaic effect with an inclusion of a poor internal region in an alignment (adapted from [16]). ...13
Figure 2-5. Mosaic effect in a local pairwise sequence alignment (adapted from [16]). Note that the numbers written in bold are the scores of alignments identified by the corresponding rectangles, and the other numbers are the side lengths of the rectangles. That is, the long alignment (i.e., A1 with total length 600) has a score of 120, while the short alignment (i.e., A2 with total length 200) has a score of 80...14
Figure 3-1. Interface of SARSA. ...16
Figure 3-2. Interface of PARTS. ...17
Figure 3-3. The output page of PARTS...18
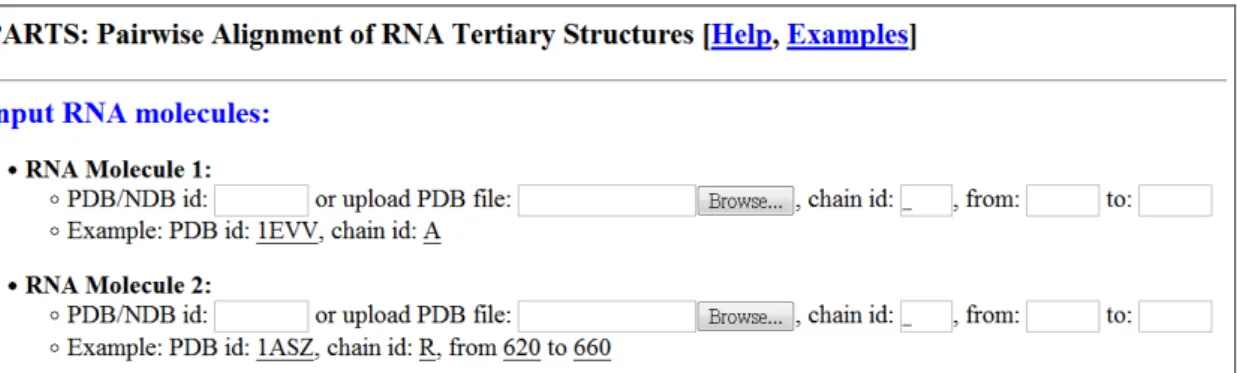
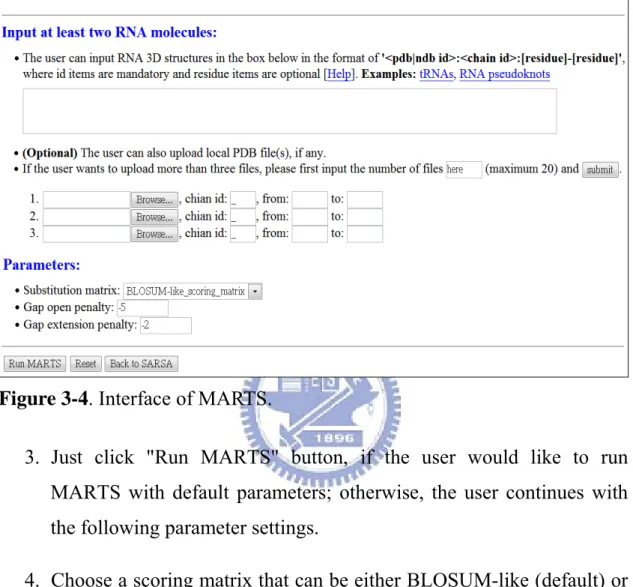
Figure 3-4. Interface of MARTS...20
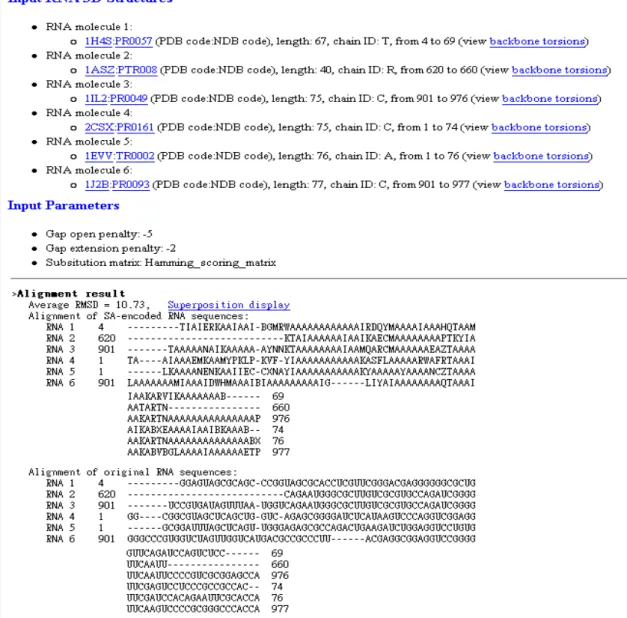
Figure 3-5. The output page of MARTS...21
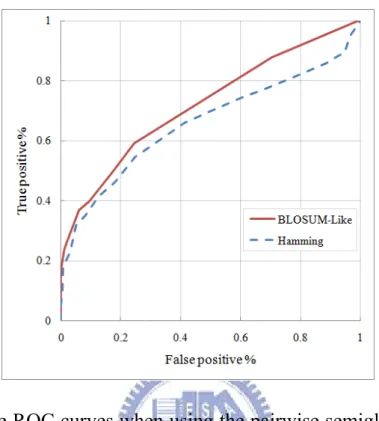
Figure 4-1. The ROC curves when using the pairwise semiglobal alignment of PARTS to align RNA structural motifs from the SCOR database with two different scoring matrices...23
Figure 4-2. The ROC curves computed by DIAL using the semiglobal alignment method with different parameter settings (derived from Figure 5 in [11]). ...24
DIAL global alignment between 1U8D:A and 1Y26:X. ...25
Figure 4-4. Superposition display of (a) PARTS global alignment and (b)
DIAL global alignment between 1U8D:A and 1Y26:X:25-72. ...26
Figure 4-5. (a) PARTS global alignment and (b) DIAL global alignment
between 1U8D:A and 1Y26:X:25-72, where DIAL mis-aligned a fragment of 1Y26 from 68 to 72 residues with a fragment of 1U8D ranging from 76 to 80 residues...26
Figure 4-6. Superposition display of (a) PARTS semiglobal alignment and
(b) DIAL semiglobal alignment using 1J5A:A:2530-2536 as a query structural motif (red) and 1HR2:A:103-260 as a target RNA molecule (green). ...27
Figure 4-7. Superposition display of (a) PARTS local alignment and (b)
DIAL local alignment for two RNA pseudoknots 1L2X:A (green) and 2A43:A (red)...28
Figure 4-8. Superposition display of (a) PARTS local alignment and (b)
DIAL local alignment between 1U8D:A (green) and 1Y26:X:39-45 (red), where DIAL mis-aligned 1Y26:X:39-45 with 1U8D:A:74-80. ...29
Figure 4-9. (a) Superposition display of (a) PARTS local alignment
between two RNA pseudoknots 1L2X:A and 2A43:A, and their (b) best and (c) second best PARTS normalized local alignments...30
Figure 4-10. Multiple structural alignments obtained by MARTS for (a) six
Chapter 1
Introduction
Recently, it has become clear that RNA molecules have a variety of important biological functions in cells, including protein synthesis (e.g., mRNAs, rRNAs and tRNAs), RNA processing (e.g., ribozymes and small nuclear RNAs (snRNAs)) and modification (e.g., small nucleolar RNAs (snoRNAs)), gene regulation (e.g., riboswitches, microRNAs (miRNAs) and small interfering RNAs (siRNAs)), chromosome replication (e.g. telomerase RNAs), and so on [1][2][3]. Since structures are typically more evolutionarily conserved than sequences, detecting structural similarities among RNA three-dimensional (3D) structures can bring more significant insights into their functional and even evolutionary relationships that would not be detected by sequence information alone. However, the number and size of RNA 3D structures deposited in the Protein Data Bank [4], as well as the Nucleic Acid Database [5], has been substantially and rapidly increasing recently, making it difficult and time-consuming to manually compare and analyze these RNA tertiary structures. Therefore, it has become more and more crucial to develop automatic tools that are able to efficiently and accurately perform RNA structural comparison.
the tertiary structure level is a difficult problem, since it has been shown to be NP-hard to find a constant ratio approximation algorithm for computing a pair of maximal substructures from two protein/RNA 3D structures with exhibiting the highest degree of similarity, if the two proteins/RNAs being compared lie in a general 3D metric (not necessarily Euclidean) space [8]. Therefore, currently available tools, such as ARTS [9][10] and DIAL [11], are all based on some heuristic approaches and particularly they are all dedicated to pairwise alignment/comparison of RNA tertiary structures. We refer the reader to [9][11] for briefly reviewing these tools and their approaches.
ARTS was implemented based on a cubic time algorithm that proceeds by a seed match followed by a greedy extension to approximately compute the largest common point set between phosphate atoms of two RNA molecules [9][10]. While ARTS can serve as an excellent tool for detecting structural motifs, it is still a little time-consuming job for ARTS to compare large RNA molecules (e.g., ribosomal RNAs) due to its cubic time complexity and sometimes the alignments produced by ARTS may be incorrect, as were demonstrated in [11].
To overcome these problems, DIAL was then developed based on a quadratic time dynamic programming algorithm by accounting for torsion/pseudo-torsion angle, nucleotide and/or base-pairing similarities [11]. DIAL is a versatile tool of pairwise RNA structural alignment, because it can perform three types of alignments: (a) global alignment, (b) local alignment and (c) semiglobal alignment (i.e., a kind of global alignment without penalizing those end gaps that appear in the beginnings and ends of the alignment). However, we observed that the global, local and semiglobal
alignments obtained by DIAL may still be incorrect for some pairs of RNA 3D structures (for details see the Experimental Results chapter).
In this study, we utilize the vector quantization (VQ) approach, a technique of high-dimensional clustering commonly used in classical signal processing [12], to derive an RNA structural alphabet of 23 letters that represent distinct and most common backbone conformations of residues in RNAs with known tertiary structures. Using this structural alphabet (SA), we reduce RNA 3D structures to 1D sequences of SA letters and then use classical and efficient sequence alignment algorithms to compare these 1D SA-encoded sequences and determine their structural similarities. Based on such an SA-based approach, we have developed a novel web-based tool, called SARSA (http://bioalgorithm.life.nctu.edu.tw/SARSA/), which provides two RNA structural alignment tools, PARTS for pairwise alignment of RNA tertiary structures and MARTS for multiple alignment of RNA tertiary structures.
For a variety of practical applications, four kinds of pairwise alignments were implemented in PARTS: (a) global alignment [13] for comparing whole structural similarity, (b) semiglobal alignment [14] for detecting structural motifs, (c) local alignment [15] for finding locally similar substructures, and (d) normalized local alignments [16] for eliminating the mosaic effect of local alignment (i.e., removing poor internal fragments in a local alignment), and a multiple global alignment [17] in MARTS. It is worth mentioning that in SARSA we provide a number of features that are not available in DIAL and other RNA structural alignment tools, such as the normalized local pairwise structural alignment in PARTS and the multiple structural alignment in MARTS. In addition, our
experiments have shown that the pairwise alignments produced by our PARTS were comparable to those obtained by DIAL and the performance computation of PARTS was generally faster than that of DIAL. In some cases, our PARTS can actually produce more accurate global, semiglobal and local pairwise alignments when compared with DIAL (for details refer to the Experimental Results chapter).
Chapter 2
Methods
The basic idea we used in this study is as follows. We first use the vector quantization approach to derive an RNA structural alphabet of 23 letters that represent distinct and most common backbone conformations. According to this structural alphabet, we then transform RNA 3D structures to 1D sequence of SA-encoded letters. Finally, we utilize classical and efficient sequence alignment algorithms to compare these 1D SA-encoded sequences and determine their structural similarities. In this chapter, we will describe the details of how to use the vector quantization approach to derive the structural alphabet, how to transform RNA 3D structures into 1D sequences, and how to derive the scoring matrices for aligning 1D SA-encoded sequences, and how to utilize normalized local alignment in RNA 3D structural comparison.
2.1 Structural alphabet
For protein backbones, two torsion (or dihedral) angles (φ and ψ) are sufficient to describe the conformation of each amino acid residue. In contrast, RNA molecules have much higher dimensionality, since for each
nucleotide residue there are six backbone torsion angles (α, β, γ, δ, ε and ζ) and a torsion angle of the bond between base and ribose ring (χ). Recently, Hershkovitz et al. [19] have performed a statistical analysis of RNA backbones to search for clusters in RNA conformational space using the so-called vector quantization (VQ), a technique of high-dimensional clustering commonly used in classical signal processing [18]. The advantage of employing the VQ technique is that it allows all seven dimensions of RNA conformation to be analyzed simultaneously, so that the smaller number of clusters is needed to classify the RNA structure, as compared to the manual binning method used previously in [20] by analyzing one torsion angle at a time. By applying a modified VQ method to a dataset of 132 RNA crystal structures with at least 3.0-Å resolution or better, Hershkovitz et al. [19] finally have reduced the full 7D torsion angle space to a set of 26 clusters.
In fact, as was demonstrated in [19] by plotting torsion angle distributions using a collection of 132 RNAs (please refer to [19] for their detailed PDB and NDB ids), four torsion angles α, γ, δ and ζ are sufficient for specifying fundamental RNA conformations, since the others are either dependent on these four angles or have distributions with a single peak (Figure 2-1). Based on this property, Hershkovitz et al. [19] also utilized the so-called scalar quantization (SQ), which can be considered as a special VQ by treating torsion angles individually, to classify α, γ, δ and ζ torsion angles (Table 2-1). As was shown in Table 2-1, the ζ torsion angles were partitioned into three, rather than one, clusters, although they visually have a single peak as shown in Figure 2-1.
Figure 2-1. Distributions of the seven torsion angles using a dataset of 132
RNAs, where α, γ and δ have clear multiple peaks, whereas β, ε and χ have only a clear peak. Particularly note that the ζ torsion angles has a large tail not present in the other distribution, although it visually contains a single peak.
Here, we utilized the VQ approach, followed by a cluster merging, to classify all the residues in the dataset of 132 RNA crystal structures, as was used in [19], only according to their four torsion angles of α, γ, δ and ζ. Consequently, we divided a total of 9,826 residues into a collection of 23 conformational clusters, as was shown in Table 2-2. In addition, we
Table 2-1. Enumeration of the bins obtained by SQ and their boundaries, as
adapted from Table 2-2 in [19].
Bin Index 1 2 3
α [0-115] [115-220] [220-360]
γ [0-120] [120-220] [220-360]
δ [50-118] [118-170]
ζ [10-130] [130-220] [220-360]
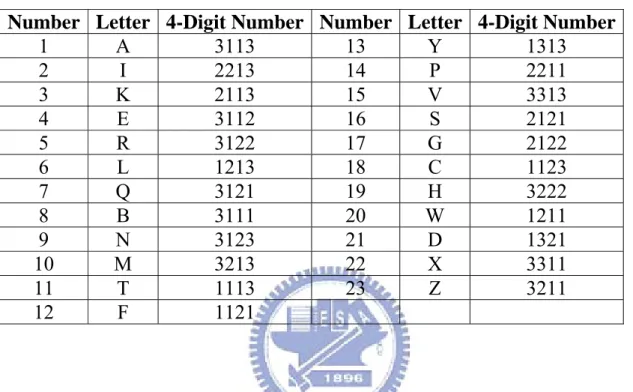
calculated the center of each cluster (i.e., the average of all the residues in the cluster) and assigned it (and its corresponding cluster) a four-digit number nαnγnδnζ, where each digit represents the bin index, as listed in Table
2-1, to which the corresponding torsion angle of the center belongs. For example, the first cluster in Table 2-2 was assigned a four-digit number of 3113, because the torsion angle values of α, γ, δ and ζ of its center are in the bins indexed as 3, 1, 1 and 3, respectively, in Table 2-1. For our purpose of transforming RNA 3D structures into 1D sequences, we further assigned a letter to each of 23 clusters, as named in Table 2-2. We used the set of these 23 letters as a structural alphabet (SA) and then encoded RNA 3D structures as 1D sequences of SA letters by assigning each residue in the RNA molecules with the letter of the cluster whose center is nearest to the residue being encoded, where the distance between the residue and each center is the square root of the sum of all squared torsion differences. Like ordinary nucleotide sequences, these SA-encoded 1D sequences can then be aligned using classical sequence alignment methods.
Table 2-2. 23 conformational clusters classified by VQ based on α, γ, δ and
ζ torsion angles and their associated letters and four-digit numbers.
Number Letter 4-Digit Number Number Letter 4-Digit Number
1 A 3113 13 Y 1313 2 I 2213 14 P 2211 3 K 2113 15 V 3313 4 E 3112 16 S 2121 5 R 3122 17 G 2122 6 L 1213 18 C 1123 7 Q 3121 19 H 3222 8 B 3111 20 W 1211 9 N 3123 21 D 1321 10 M 3213 22 X 3311 11 T 1113 23 Z 3211 12 F 1121
2.2 Hamming-distance-based and BLOSUM-like scoring matrices
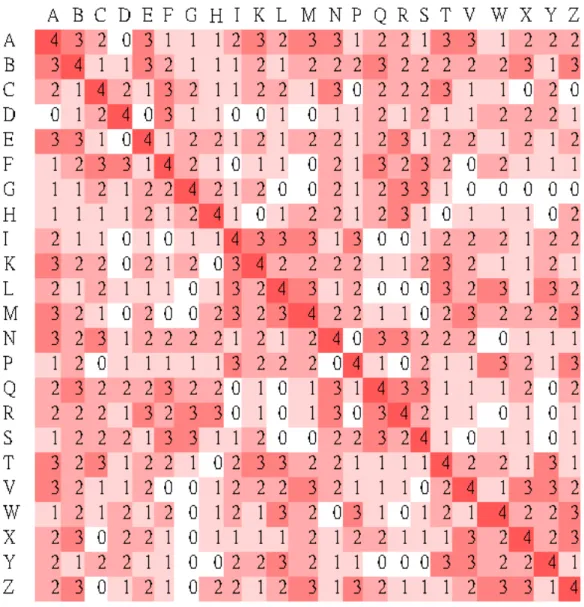
For the accuracy of alignment, we derived a 23 × 23 scoring matrix in which every possible identity and substitution, say X aligned with Y, is assigned a score, denoted by score(X, Y), based on the Hamming distance between the two 4-digit numbers, say x1x2x3x4 and y1y2y3y4, associated with X
and Y, respectively. The so-called Hamming distance Δ(X, Y) between X and
Y is defined to be the number of digits for which the corresponding numbers
are different, that is, Δ(X, Y) = |{i : xi ≠ yi for 1 ≤ i ≤ 4}|. Then the score
between X and Y we used here equals to 4 − Δ(X, Y), that is, score(X, Y) = 4
− Δ(X, Y). For instance, suppose that X = A and Y = K. Then Δ(X, Y) = Δ(A,
K) = Δ(3113, 2113) = 1 and therefore score(A, K) = 4 − Δ(A, K) = 3. The complete scoring matrix is shown in Figure 2-2.
Figure 2-2. Hamming-distance-based scoring matrix.
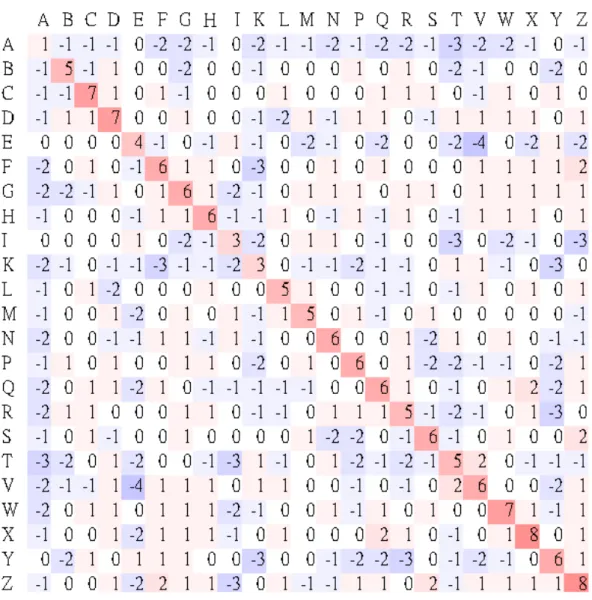
In addition to above Hamming-distance-based scoring matrix, we constructed a log-odds matrix for SA-letter substitution using the statistical method that was used by Henikoff and Henikoff [21] to derive the BLOSUM family of substitution matrices as follows. Denote by {a1, a2, …,
a23} the structural alphabet of 23 SA letters, and let fij be the observed
qij of an SA-letter pair (ai, aj) is
∑ ∑
= = = 23 1 1 k k l kl ij ij f f q . The frequency ofoccurrence of SA letter ai in an SA-letter pair (ai, aj) is
2 23 , 1
∑
= ≠ + = k k i ik ii ij q q p .The expected frequency eij for a substitution of an SA-letter pair (ai, aj) is
then pipj for i = j and pipj + pjpi = 2pipj for i ≠ j. Finally, the logarithm of the
odds matrix is calculated by score(ai, aj) = ⎟⎟ ⎠ ⎞ ⎜ ⎜ ⎝ ⎛ ij ij e q 2 log λ , where λ is a positive scale factor. For the purpose of constructing this BLOSUM-like matrix, a dataset of structurally similar RNA pairs was obtained from the SCOR database (5, 6) based on the following criteria: (1) motifs must belong to a structural family, (2) motifs must not be fragmented, (3) motifs must have length > 3 nt (4) motifs must have specified starting and ending positions in the chain, and (5) motif pairs must have no 100% sequence identity. In total, 2,152 RNA motif pairs from 102 SCOR subclasses were analyzed, which accounted for 6,214 SA-letter pairs. The λ value used in SARSA was set to 1.2 for the best performance, by testing various values ranging from 1 to 2.
2.3 Normalized local alignment
Currently, four different types of pairwise alignments, global, semiglobal, local and normalized local alignments, as well as a multiple global alignment, were implemented in our web server for a variety of practical applications. Recall that the Smith-Waterman algorithm for the local alignment was originally designed to discard non-similar initial and terminal
Figure 2-3. BLOSUM-like scoring matrix.
fragments in the sequence alignment, but it was not able to exclude non-similar internal fragments, leading to a so-called mosaic effect by including poor internal fragments in a local alignment [13]. As was shown in Figure 2-4 for an illustration, if a region of negative score −X is sandwiched between two regions scoring more than X, then the Smith-Waterman algorithm will join these three regions into a single alignment that may not be biologically adequate. In fact, such a mosaic effect can be observed in the
Figure 2-4. A mosaic effect with an inclusion of a poor internal region in an
alignment (adapted from [16]).
comparison of RNA tertiary structures, as illustrated in the Experimental Results chapter.
To overcome the mosaic effect in local alignment, Arslan et al. [16] introduced the normalized local alignment problem that aims to find the subsequences, say I and J, of two given sequences that maximizes S(I, J)/(|I| + |J|) among all subsequences I and J with |I| + |J| ≥ T, where S(I, J) is the alignment score between I and J, and T is a threshold for the minimal overall length of I and J. Note that the above length constraint of requiring |I|+|J| ≥
T is necessary, because length normalization favors short alignment but the
alignment should be sufficiently long to be biologically meaningful. As illustrated in Figure 2-5, the long alignment has higher ordinary score, whereas the short alignment has higher normalized score. Hence, if we use ordinary scores as the similarity measure, then the long alignment with a non-similar internal fragment will be chosen as an optimal local alignment. However, if we use normalized scores instead, then the alignment to be chosen will depend on the value of T. If T ≤ 200, then the short alignment is chosen as an optimal normalized local alignment; otherwise, the long alignment is chosen. In [16], Arslan et al. have also proposed a polynomial-time algorithm to solve the normalized local alignment problem. Here, we have implemented such an algorithm for the normalized local alignment of the SA-encoded sequences of two RNA 3D structures.
Figure 2-5. Mosaic effect in a local pairwise sequence alignment (adapted
from [16]). Note that the numbers written in bold are the scores of alignments identified by the corresponding rectangles, and the other numbers are the side lengths of the rectangles. That is, the long alignment (i.e., A1 with total length 600) has a score of 120, while the short alignment (i.e., A2 with total length 200) has a score of 80.
Chapter 3
Implementation of Software Tools
Based on the SA-based approach described in the previous chapter, we have developed a novel web-based tool, called SARSA (short for Structural Alignment of RNA using a Structural Alphabet) (see Figure 3-1), which provides two RNA structural alignment tools that are PARTS (short for Pairwise Alignment for RNA Tertiary Structures) for pairwise alignment of RNA tertiary structures and MARTS (short for Multiple Alignment for RNA Tertiary Structures) for multiple alignment of RNA tertiary structures. In the following, we will describe the details of how to use PARTS and MARTS for structural alignments of pairwise and multiple RNA 3D structures, respectively.
3.1 Usage of PARTS
PARTS (refer to Figure 3-2) allows the user to compare two RNA 3D structures by performing global, semiglobal, local, and normalized local alignments. Below, we describe the details of its usage step by step.
Figure 3-1. Interface of SARSA. 3.1.1 Input of PARTS
1. Enter the PDB/NDB id (4-/6-character code) or upload the file in the PDB format, as well as its chain id and starting and ending residue numbers in sequence, for RNA molecule 1. Note that PDB/NDB id or uploading the file is mandatory, and others are optional but the user has to specify a chain id, if the given RNA molecule has multiple chains.
2. Enter the PDB/NDB id (4-/6-character code) or upload the file in the PDB format, as well as its chain id and starting and ending residue numbers in sequence, for RNA molecule 2. Note that PDB/NDB id or uploading the file is mandatory, and others are optional but the user has to specify a chain id, if the given RNA molecule has multiple chains.
3. Just click "Run PARTS" button, if the user would like to run PARTS with default parameters; otherwise, the user continues with the following parameter settings.
Figure 3-2. Interface of PARTS.
4. Select a pairwise alignment that can be either global, semiglobal, local, or normalized local alignment.
5. Choose a scoring matrix that can be either BLOSUM-like scoring matrix (default) or Hamming-based scoring matrix.
6. Key in two real values for gap open penalty and gap extension penalty, respectively, since the PARTS penalizes the gaps using the affine gap penalty function.
7. Specify the number of suboptimal alignments (at least 1), if the user choose semiglobal, local or normalized local alignment to run PARTS. 8. Specify the value of T whose default is 8, if the used alignment is a
normalized local alignments tend to be short; otherwise, they tend to be long normalized local alignments, in which may contain some non-similar internal fragments.
3.1.2 Output of PARTS
In the output page, PARTS will first show the details of input RNA molecules, as well as user-specified parameters. Next, PARTS will show its alignment result(s), including alignment score based on the pre-defined scoring matrix, RMSD (root mean square deviation), and detailed alignment of SA-encoded sequences and its corresponding alignment for original RNA
sequences. In addition, the user can click the "Superposition display" link to visually view, rotate and enlarge the 3D structures of input RNAs and the superposition of their aligned 3D structures in a Jmol window. Please refer to Figure 3-3 for an example.
3.2 Usage of MARTS
MPARTS (refer to Figure 3-4) allows the user to compare multiple RNA 3D structures. Below, we describe the details of how to use it step by step.
3.2.1 Input of MARTS
1. Input or paste multiple (at least two) RNA molecules in the format of '<pdb|ndb id>:<chain id>:[residue]-[residue]', where id items are mandatory and residue items, representing starting and ending residues in the input RNA sequence, are optional. For example, "1ASZ:R" (meaning the structure of the R chain in 1ASZ), "1ASZ:R:620-660" (meaning the substructure of the R chain of 1ASZ beginning at residue 620 and ending at residue 660), "1ASZ:R:620-" (meaning the substructure of the R chain of 1ASZ beginning at residue 620 and ending at the last residue), and "1ASZ:R:-660" (meaning the substructure of the R chain of 1ASZ beginning at the first residue and ending at residue 660) are all legal.
2. It is optional for the user to upload local PDB file(s) if any. MARTS allows the user to upload at most 20 PDB files.
Figure 3-4. Interface of MARTS.
3. Just click "Run MARTS" button, if the user would like to run MARTS with default parameters; otherwise, the user continues with the following parameter settings.
4. Choose a scoring matrix that can be either BLOSUM-like (default) or Hamming-based.
5. Key in two real values for gap open penalty and gap extension penalty, respectively, since the MARTS penalizes the gaps using the affine gap penalty function.
3.2.2 Output of MARTS
In the output page, MARTS will first show the details of input RNA molecules and user-specified parameters. Next, MARTS will show the
resulting multiple global alignment of SA-encoded sequences and its corresponding alignment for original RNA sequences. In addition, the user can click the "Superposition display" link to visually view, rotate and enlarge the 3D structures of input RNAs and the superposition of their aligned 3D structures in a Jmol window. Please refer to Figure 3-5 for an example.
Chapter 4
Experimental Results
In this chapter, we will describe some experimental results we obtained by testing our PARTS and MARTS on several instances of RNA 3D structures. In addition, we will compare our testing results of pairwise global, semiglobal, and local structural alignments to those results obtained by using DIAL. Unless otherwise specified, all the experiments were run using our PARTS and MARTS, as well as DIAL, with their default parameters.
4.1 ROC curves
To assess the accuracy of our PARTS, we calculated its receiver operating characteristic (ROC) curves, depicting the trade-off between true positive rate (i.e., sensitivity) and false positive rate (i.e., 1 minus specificity), and compared them with the best ROC curve of DIAL. By following the procedure that was used by Ferr`e et al. [11] to compute DIAL's ROC curves, we obtained a filtered, non-redundant dataset that consisted of 51 families and altogether 186 non-fragmented motifs from the SCOR database [22][23], which currently organizes many RNA structural motifs in a
Figure 4-1. The ROC curves when using the pairwise semiglobal alignment
of PARTS to align RNA structural motifs from the SCOR database with two different scoring matrices.
hierarchical classification system similar to the SCOP database for protein domains [24]. According to this dataset, we computed the ROC curves using the semiglobal alignment of PARTS with two different scoring matrices. As illustrated in Figure 4-1, the ROC curve using BLOSUM-like scoring matrix performed better than that using Hamming scoring matrix, where the AUC (area under ROC curve) of the former ROC curve is 0.75, while the AUC of the latter is just 0.66. In fact, the alignment results of our PARTS were still comparable to those obtained by DIAL, because as demonstrated in [11] the AUCs of the ROC curves computed by DIAL using the semiglobal alignment method with different parameter settings are between 0.69 and 0.80 (refer to Figure 4-2). In addition, the performance computation of our PARTS was faster than that of DIAL, even though DIAL was executed on a
Figure 4-2. The ROC curves computed by DIAL using the semiglobal
alignment method with different parameter settings (derived from Figure 5 in [11]).
Linux cluster with 20 computational nodes, each with double CPUs of 1.3-3 GHz and 2 GB RAM, while our PARTS was run only on a single Linux PC with 2.8 GHz CPU and 3 GB RAM. Actually, in some cases as will be demonstrated below, our PARTS produced more accurate global, semiglobal and local pairwise alignments when compared with DIAL.
4.2 Pairwise global structural alignment
First of all, we used the tertiary structures of two riboswitches to test our PARTS and DIAL for their capabilities of globally aligning two RNA 3D structures. They are 1U8D (chain A) and 1Y26 (chain X), where 1U8D is the aptamer domain of the guanine-specific riboswitch from the xpt-pbuX operon of B. subtilis, and 1Y26 is the aptamer domain of the
adenine-specific riboswitch from the V. vulnificus add gene. In fact, these two riboswitches have nearly identical tertiary structure, although they share only less than 60% sequence identity [25]. Consequently, both PARTS and DIAL globally aligned their tertiary structures very well, as shown in Figure 4-3. To demonstrate the difference in global alignment accuracy of PARTS and DIAL, we tested them again by using complete 1U8D:A structure and incomplete 1Y26:X structure that ranges from 25 to 72 residues (1Y26:X:25-72) (i.e., two similar RNA tertiary structures with a little difference in length). As a result, our PARTS globally aligned 1U8D:A and 1Y26:X:25-72 with an RMSD of 1.70 Å (Figure 4-4a), whereas DIAL globally aligned them with an RMSD of 12.03 Å (Figure 4-4b). The reason for DIAL’s result is that DIAL mis-aligned a fragment of 1Y26:X:68-72 with a fragment of 1U8D:A:76-80,as was illustrated in Figure 4-5b, but actually it should be aligned with 1U8D:X:68-72 as shown in Figure 4-5a.
Figure 4-3. Superposition display of (a) PARTS global alignment and (b)
Figure 4-4. Superposition display of (a) PARTS global alignment and (b)
DIAL global alignment between 1U8D:A and 1Y26:X:25-72.
Figure 4-5. (a) PARTS global alignment and (b) DIAL global alignment
between 1U8D:A and 1Y26:X:25-72, where DIAL mis-aligned a fragment of 1Y26 from 68 to 72 residues with a fragment of 1U8D ranging from 76 to 80 residues.
4.3 Pairwise semiglobal structural alignment
Note that Ferr`e et al. [11] were the first to utilize the semiglobal alignment, a kind of global alignment without penalizing those end gaps appearing in the beginnings and ends of the alignment, for the detection of structural motifs in RNA 3D structures. In this experiment, we tested our PARTS, as
well as DIAL, by using 1J5A:A with residues 2530-2536 as a query structural motif and 1HR2:A with residues 103-260 as a target RNA molecule. Consequently, our PARTS correctly detected the position of the query structural motif in the target RNA molecule and also returned a semiglobal alignment of IJ5A:A:2530-2536 and 1HR2:A:149-155 with an RMSD of 1.63 Å (Figure 4-6a). However, DIAL mis-aligned the query structural motif with a different portion of the target RNA molecule (i.e., 1HR2:A:234-240) and returned their semiglobal alignment with an RMSD of 2.43 Å (Figure 4-6b).
Figure 4-6. Superposition display of (a) PARTS semiglobal alignment and
(b) DIAL semiglobal alignment using 1J5A:A:2530-2536 as a query structural motif (red) and 1HR2:A:103-260 as a target RNA molecule (green).
4.4 Pairwise local structural alignment
Here, we first used both PARTS and DIAL to locally compare two RNA pseudoknots 1L2X:A (a viral RNA pseudoknot) and 2A43:A (a luteoviral RNA pseudoknot). Consequently, both of them produced good local alignments for these two RNA pseudoknots as were demonstrated in Figure 4-7.
Next, to illustrate the difference in local alignment accuracy of PARTS and DIAL, we applied them to a complete structure of riboswitch 1U8D:A and a partial structure of riboswitch 1Y26:X ranging from 39 to 45 residues (1Y26:X:39-45). Basically, as mentioned above, both of 1Y26:X and 1U8D:A have nearly identical tertiary structure and hence the partial structure 1Y26:X:39-45 should be aligned together with its corresponding substructure in 1U8D (i.e., 1U8D:A:39-45).
Figure 4-7. Superposition display of (a) PARTS local alignment and (b)
DIAL local alignment for two RNA pseudoknots 1L2X:A (green) and 2A43:A (red).
Figure 4-8. Superposition display of (a) PARTS local alignment and (b)
DIAL local alignment between 1U8D:A (green) and 1Y26:X:39-45 (red), where DIAL mis-aligned 1Y26:X:39-45 with 1U8D:A:74-80.
Consequently, our PARTS aligned them by shifting a residue position, producing a alignment of 1Y26:X:39-45 and 1U8D:A:40-46 with an RMSD of 0.70 Å (Figure 4-8a). However, DIAL completely mis-aligned 1Y26:X:39-45 with 1U8D:A:74-80 in its local alignment that has an RMSD of 1.32 Å (Figure 4-8b).
4.5 Pairwise normalized local structural alignment
In fact, it can be observed that a long local alignment between two RNA 3D structures may contain some non-similar internal fragments (i.e., the so-called mosaic effect). For instance, Figure 4-9a displays the structural superposition for the optimal local alignment of two RNA pseudoknots
1L2X:A and 2A43:A that was obtained by our PARTS using Hamming scoring matrix with default parameters (RMSD = 2.40Å). As shown in this figure, the similar substructures in the initial and terminal regions were very well fitted, but the non-similar substructures in the internal region, ranging from residues 13 to 20, was not fitted well. This mosaic effect in the ordinary local alignment can actually be improved using the normalized local alignment method as implemented in PARTS. For instance, if we run PARTS normalized local alignment by using Hamming scoring matrix and specifying two for the number of suboptimal alignments and 16 for the value of T, then the substructures in the returned normalized local alignments, as shown in Figure 4-9b and Figure 4-9c, are fitted very well and have RMSDs of 0.20Å and 0.26Å, respectively. As mentioned before, the setting value of
T can affect the results of normalized local alignments. For example, if T is
set to a large value (e.g., T = 46), then PARTS returns a long normalized local alignment, similar to the one depicted in Figure 5a, with non-similar internal substructures.
Figure 4-9. (a) Superposition display of (a) PARTS local alignment between
two RNA pseudoknots 1L2X:A and 2A43:A, and their (b) best and (c) second best PARTS normalized local alignments.
4.6 Multiple global structural alignment
We demonstrated the multiple alignment capability of our MARTS by applying it to six tRNA structures (i.e., 1H4S:T, 1ASZ:R:620-660, 1IL2:C, 2CSX:C, 1EVV:A, and 1J2B:C) and five RNA pseudoknots (i.e., 1L2X:A, 2AP5:A, 1KPY:A, 2AP0:A, and 1YG4:A). Consequently, our MARTS returned a global alignment of the six tRNA 3D structures with an RMSD of 10.73 Å(Figure 4-10a) and a global alignment of the five RNA pseudoknotted structures with an RMSD of 5.89 Å(Figure 4-10b). Note that the RMSD we used here for the multiple RNA structural alignment is defined to be the square root of the average sum of all squared pairwise distances.
Figure 4-10. Multiple structural alignments obtained by MARTS for (a) six
Chapter 5
Conclusions
In this study, we have used the SA-based approach to develop a web tool SARSA by providing two RNA structural alignment tools that are PARTS that can perform global, semiglobal, local and normalized local pairwise alignments of RNA 3D structures, and MARTS that can perform global multiple alignment of RNA 3D structures. The basic idea behind SARSA is that we use the vector quantization approach to derive a structural alphabet (SA) of 23 nucleotide conformations, via which we transform RNA 3D structures into 1D sequences of SA letters and then utilize classical sequence alignment methods to compare these 1D SA-encoded sequences and determine their structural similarities. It is worth mentioning that the pairwise normalized local structural alignment in PARTS and the multiple structural alignment in MARTS are not available in other RNA structural alignment tools. In addition, according to our experiments, our PARTS indeed can quickly produce global, semiglobal and local pairwise structural alignments that are comparable to those obtained by DIAL. Therefore, we believe that our SARSA can serve as a useful tool in the study of structural biology.
Reference
[1] Doudna, J. A. (2000) Structural genomics of RNA. Nature Structural
Biology, 7, 954–956.
[2] Eddy, S. R. (2001) Non-coding RNA genes and the modern RNA world. Nature Reviews Genetics, 2, 919–929.
[3] Storz, G. (2002) An expanding universe of noncoding RNAs. Science, 296, 1260–1263.
[4] Berman, H. M., Westbrook, J., Feng, Z., Gilliland, G., Bhat, T. N., Weissig, H., Shindyalov, I. N., and Bourne, P. E. (2000) The protein data bank. Nucleic Acids Research, 28, 235–242.
[5] Berman, H. M., Olson, W. K., Beveridge, D. L., Westbrook, J., Gelbin, A., Demeny, T., Hsieh, S. H., Srinivasan, A. R., and Schneider, B. (1992) The nucleic acid database: a comprehensive relational database of three-dimensional structures of nucleic acids. Biophysical Journal, 63, 751–759.
[6] Duarte, C.M. and Pyle, A. (1998) Stepping through an RNA structure: a novel approach to conformational analysis. Journal of Molecular Biology, 284, 1465-1478.
[7] Duarte, C.M., Wadley, L.M. and Pyle, A. (2003) RNA structure comparison, motif search and discovery using a reduced representation
of RNA conformational space. Nucleic Acids Research, 31, 4755-4761. [8] Kolodny, R. and Linial, N. (2004) Approximate protein structural
alignment in polynomial time. Proceedings of the National Academy of Sciences of the United States of America, 101, 12201–12206.
[9] Dror, O., Nussinov, R., and Wolfson, H. (2005) ARTS: alignment of RNA tertiary structures. Bioinformatics, 21 Suppl. 2, 47–53.
[10] Dror, O., Nussinov, R., and Wolfson, H. J. (2006) The ARTS web server for aligning RNA tertiary structures. Nucleic Acids Research, 34, W412–W415.
[11] Ferr`e, F., Ponty, Y., Lorenz, W. A., and Clote, P. (2007) DIAL: a web server for the pairwise alignment of two RNA three-dimensional structures using nucleotide, dihedral angle and base-pairing similarities. Nucleic Acids Research, 35, W659–W668.
[12] Linde, Y., Buzo, A., and Gray, R. M. (1980) An algorithm for vector quantizer design. IEEE Transactions on Communications, 28, 84–95. [13] Needleman, S. and Wunsch, C. (1970) A general method applicable to
the search for similarities in the amino acid sequence of two proteins. Journal of Molecular Evolution, 48, 443–453.
[14] Setubal, J. and Meidanis, J. (1997) Introduction to Computational Molecular Biology, PWS Publishing Company, .
[15] Smith, T. and Waterman, M. (1981) Identification of common molecular subsequences. Journal of Molecular Biology, 147, 195–197.
[16] Arslan, A. N., E˘gecio˘glu, O., and Pevzner, P. A. (2001) A new approach to sequence comparison: normalized sequence alignment. Bioinformatics, 17, 327–337.
[17] Thompson, J. D., Higgins, D. G., and Gibson, T. J. (1994) CLUSTAL W: improving the sensitivity of progressive multiple sequence alignment through sequence weighting, position-specific gap penalties and weight matrix choice. Nucleic Acids Research, 22, 4673– 4680. [18] Linde, Y., Buzo, A., and Gray, R.M. (1980) An algorithm for vector
quantizer design. IEEE Transactions on Communications, 28, 84-95. [19] Hershkovitz, E., Sapiro, G., Tannenbaum, A., and Williams, L. D.
(2006) Statistical analysis of RNA backbone. IEEE/ACM Transaction on Computational Biology and Bioinformatics, 3, 33–46.
[20] Hershkovitz, E., Tannenbaum, E., Howerton, S. B., Sheth, A., Tannenbaum, A., and Williams, L. D. (2003) Automated identification of RNA conformational motifs: theory and application to the HM LSU 23S rRNA. Nucleic Acids Research, 31, 6249–6257.
[21] Henikoff, S. and Henikoff, J. G. (1992) Amino acid substitution matrices from protein blocks. Proceedings of the National Academy of Sciences of the United States of America, 89, 10915–10919.
[22] Klosterman, P. S., Tamura, M., Holbrook, S. R., and Brenner, S. E. (2002) SCOR: a structural classification of RNA database. Nucleic Acids Research, 30, 392–394.
Brenner, S. E., and Holbrook, S. R. (2004) SCOR: Structural classification of RNA, version 2.0. Nucleic Acids Research, 32, D182–D184.
[24] Murzin, A. G., Brenner, S. E., Hubbard, T., and Chothia, C. (1995) SCOP: a structural classification of proteins database for the investigation of sequences and structures. Journal of Molecular Biology, 247, 536–540.
[25] Serganov, A., Yuan, Y. R., Pikovskaya, O., Polonskaia, A., Malinina, L., Phan, A. T., Hobartner, C., Micura, R., Breaker, R. R., and Patel, D. J. (2004) Structural basis for discriminative regulation of gene expression by adenine- and guanine-sensing mRNAs. Chemistry and Biology, 11, 1729–1741.
![Figure 2-4. A mosaic effect with an inclusion of a poor internal region in an alignment (adapted from [16])](https://thumb-ap.123doks.com/thumbv2/9libinfo/8150547.167078/24.892.127.765.167.252/figure-mosaic-effect-inclusion-internal-region-alignment-adapted.webp)
![Figure 2-5. Mosaic effect in a local pairwise sequence alignment (adapted from [16])](https://thumb-ap.123doks.com/thumbv2/9libinfo/8150547.167078/25.892.164.729.187.680/figure-mosaic-effect-local-pairwise-sequence-alignment-adapted.webp)