JOURNAL OF
CHROMATOGRAPHY A
ELSEVIER
Journal of Chromatography A, 768 ( 1997) 334-341Short communication
Determination of preservatives in food products by
cyclodextrin-modified capillary electrophoresis with multiwavelength detection
Kuang-Lung Kuo, You-Zung Hsieh”
Department of Applied Chemistry, National Chiao Tung University, Hsinchu Taiwan, R.0.C
Received 27 August 1996; revised 20 December 1996; accepted 23 December 1996
Abstract
A high-performance capillary electrophoretic method with multiwavelength detection was developed to analyze frequently used preservatives. The effects of a-cyclodextrin and P-cyclodextrin on migration behaviours of nine preservatives were investigated. The preservatives were successfully separated within 9 min using a borax-NaOH buffer (pH 10.0) modified with 2 mM o-cyclodextrin. In optimized separation conditions, the reproducibilities of the migration times of the preservatives were satisfactory (R.S.D. values <0.99%). The correlation coefficients of the linear calibration graphs for the preservatives, ranging between 5 and 500 kg ml- ‘, exceeded 0.99 I. By employing this reliable capillary electrophoresis method, preservatives in three different food products were determined.
Keywords: Food analysis; Benzoic acid; Sorbic acid; Hydroxybenzoates
1. Introduction
Preservatives having antimicrobial properties are permitted food additives in various food products to preserve them from decay [l-4]. For instance, benzoic acid inhibits bacterial development. Sorbic acid is an antifungal preservative against molds and yeasts [1,2]. Esters of p-hydroxybenzoic acid, such as methyl, ethyl, propyl and butyl p-hydroxy-benzoate, also possess antifungal properties. The antimicrobial activities of these esters increase with increasing alkyl chain length, but esters with longer alkyl chains are of limited application owing to their lower solubility in water [3,4]. Although these preservatives are frequently used in various food products, they are harmful at higher than permitted
*Corresponding author.
safety levels. Therefore, developing an appropriate analytical method to separate and determine pre-servatives is essential.
High-performance liquid chromatography (HPLC) with UV or fluorescence detection has been found appropriate for the above purposes [l-6], although most HPLC methods may be employed to analyze only one kind of preservative. Ion-pair HPLC, however, may simultaneously analyze benzoic acid, sorbic acid, and six p-hydroxybenzoates in food, but the separation takes 30 min [5,6].
Capillary electrophoresis (CE), a highly effective analytical technique, has developed rapidly over the recent decade [7-lo]. It possesses the advantages of high separation efficiency, excellent resolution and short analysis time. Also, it consumes less solvent and sample than HPLC. Moreover, CE methods employing cyclodextrins as modifiers can satisfac-torily separate enantiomers and chiral drugs [ 1 I, 121. 0021.9673/97/$17.00 Copyright 0 1997 Elsevier Science B.V All rights reserved
K.-L. Km. Y.-Z. Hsieh I J. Chromatogr. A 768 (1997) 334-341 335
In addition, CE buffer modified by various cyclo-dextrins of different cavity sizes can analyze a series of compounds that have different substitutes [ 13,141. With these advantages, CE has highly promising potential as a method to analyze preservatives in food products and, as expected, has already been employed to that end in certain drinks and food products [ 1% 171. Nevertheless, these analytical methods have so far only analyzed benzoic acid and/or sorbic acid.
This study presents a CE method to simultaneous-ly separate and determine commonsimultaneous-ly used preserva-tives, including benzoic acid, sorbic acid, p-hy-droxybenzoic acid, and six alkyl esters of p-hydroxy-benzoic acid (methyl, ethyl, n-propyl, n-butyl, iso-propyl and isobutyl p-hydroxybenzoate). The effects of buffer conditions and cyclodextrin modifiers on the separation were also investigated. Variation in the interactions between preservatives and cyclodextrins is discussed on the basis of migration velocities. Preservatives in three food products were analyzed at the optimum CE conditions. The recoveries of preservatives by different extraction methods are discussed.
2. Experimental
2.1. Apparatus
A Beckman P/ACE 5500 capillary electrophoresis system (Beckman Instruments, Palo Alto, CA, USA) equipped with a UV-Vis diode-array detector was used. A personal computer using System Gold software controlled the P/ACE instrument. Data analyses were also performed on System Gold software. A 50 pm I.D. fused-silica capillary tube (Polymicro Technologies, Phoenix, AZ, USA) was used at a total length of 47 cm (40 cm to the detector). The capillary column was assembled in a cartridge format. Temperature of the capillary tube during electrophoresis was maintained at 25°C by the P/ACE thermostating system. The electrophoretic separation was performed with an electric potential of 20 kV. Samples were pressure injected at 0.034 bar (0.5 p.s.i.).
2.2. Chemicals
Benzoic acid and sodium hydroxide were pur-chased from Fluka (Buchs, Switzerland). u-Cyclo-dextrin, B-cyclou-Cyclo-dextrin, borax, sorbic acid, p-hy-droxybenzoic acid, methyl, ethyl, propyl and n-butyl p-hydroxybenzoates, were purchased from Sigma (St. Louis, MO, USA). Isobutyl and isopropyl p-hydroxybenzoates were bought from Tokyo Chemical Industry (Tokyo, Japan). Ethanol was obtained from Merck (Darmstadt, Germany). Water was purified with a Milli-Q water system (Millipore, Bedford, MA, USA) and filtered through a 0.22+m filter. Food samples, i.e., plum preserves, dried bean curd, and two brands of soy sauce (denoted by WC and WW), were brought from the market.
2.3. Sample preparation
The solid food samples were finely ground prior to extraction. Two grams of plum preserves were transferred into a lOO-ml beaker, to which 10 ml of ethanol were added before extracting the preserva-tives in an ultrasonic bath for 20 min. The extraction procedure was repeated twice for a total of 20 ml. The extracted solution was ready for sample in-jection. The same procedure was used for dried bean curd except that the extraction solvent was methanol. After extraction, the extracted solution was cen-trifuged at 2000 t-pm for 5 min, and made ready for direct injection and analysis. The extraction recovery study followed the same procedure described above. The amount of each spiked preservative was 1 mg. Soy sauce samples were prepared by mixing 50 ~1 WC soy sauce or 200 pl WW soy sauce with 200 pl ethanol-water (1: 1, v Iv) solution. Without any filtra-tion, the diluted soy sauce was ready for CE analysis.
2.4. Procedure
Standard solutions of the preservatives (5 mg ml-‘) were dissolved in ethanol. Sample solu-tions at various concentrasolu-tions were prepared with an ethanol-water (1:3, v/v) solution, Running buffer solutions were prepared by dissolving l-5 mM (Y-cyclodextrin or B-(Y-cyclodextrin in a 0.035 M borax-NaOH buffer (pH 10.0). Standard solutions (pH 7.0
336 K.-L. Kuo. Y.-Z. Hsieh I J. Chromatogr. A 768 (1997) 334-341 8.5 45 7 5.6 3.4 1.2
I
E°F
I
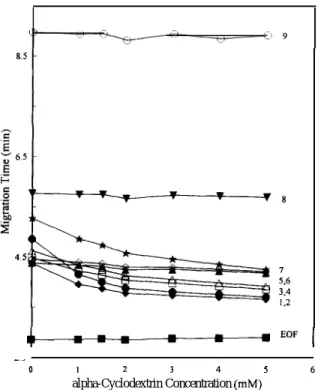
__ 0 I 2 3 4 5 6 alpha-Cyclodextrin Concentration (mM)Fig. I. Effect of o-cyclodextrin concentration on the migration time of nine preservatives. EOF (W)=electroosmotic flow; 1 (+)=a-butyl p-hydroxybenzoate; 2 (O)=methyl hydroxy-benzoate; 3 (O)=n-propyl hydroxyhydroxy-benzoate; 4 (A)=ethyl p-hydroxybenzoate; 5 (A)= isobutyl p-p-hydroxybenzoate; 6 (0) = isopropyl p-hydroxybenzoate; 7 (t)=sorbic acid; 8 (V)=benzoic acid; 9 (O)=p-hydroxybenzoic acid. Conditions: separation solu-tion, a-cyclodextrin in 0.035 M borax-NaOH buffer (pH 10.0); capillary, 47 cm (40 cm to the detector)X50 p,m I.D.; applied voltage, 20 kV; detection wavelength, 195 nm; concentration of each analyte, 125 (Ig ml-‘; pressure injection, 3 s; column temperature, 25°C.
and pH 10.0) obtained from Beckman were em-ployed for calibrating a Beckman a50 pH meter.
3. Results and discussion
In this study, nine preservatives, i.e., sorbic acid, benzoic acid, p-hydroxybenzoic acid and six alkyl esters of p-hydroxybenzoic acid, were analyzed by CE. Their molecular masses vary from 112-194 u. The six p-hydroxybenzoates have similar pK, values, around 8.4. The differences between these esters exist only in their alkyl groups. Therefore, they exhibited a quite similar absorbance spectrum in the
UV-visible region; two absorbance maximums for each spectrum were around 195 and 295 nm. The other three analytes possessed obviously different spectra in the UV-visible region. Sorbic acid had maximum absorbance at 254 nm, while those of benzoic acid and p-hydroxybenzoic acid were at 195 nm. Owing to the difference in maximum absor-bances, a detector with a multiwavelength detection capability was necessary, which is why a diode-array detector was selected for this investigation.
3.1. The effects of the pH value of the buffer on
separation
The present study employed buffers with pH values ranging from 8.0-10.0 to investigate the effects of pH values on the separation of the nine preservatives. The buffers’ concentrations were ad-justed to obtain the migration times of electroosmotic flow (measured by the peak of ethanol) at around 3 min for different pH values. Sorbic acid, benzoic acid and p-hydroxybenzoic acid, all of which have pK, values below 5, could totally dissociate under these conditions and migrated more slowly than the electroosmotic flow. The migration time of p-hy-droxybenzoic acid was significantly longer than that of the other eight analytes and increased significantly as the buffer pH changed from 8.0-10.0. Such results are due to the hydroxyl group of p-hydroxy-benzoic acid at the benzene ring dissociating and causing p-hydroxybenzoic acid to carry two negative charges at a higher pH buffer.
Since the pK, values of the six p-hydroxy-benzoates are around 8.4, they possessed similar migration velocities which were close to the velocity of the electroosmotic flow in the pH 8.0 buffer. Methyl, ethyl, n-propyl and n-butyl p-hydroxy-benzoates could be separated at the pH 9.0 and pH 10.0 conditions. Since these esters have similar pK, values, their migration velocities depend on their molecular masses. An ester with a higher molecular mass (i.e. a smaller charge-to-mass ratio) has a lower electrophoretic mobility towards the anode that leads to a more rapid migration toward cathode. However, the migration velocity of isobutyl p-hydroxybenzoate was identical to that of n-butyl p-hydroxybenzoate. The same result occurred for isopropyl and n-propyl hydroxybenzoates. This phenomenon can be
ac-K.-L. Kuo. Y.-Z. Hsieh I J. Chromarogr. A 768 (1997) 334-341 331
counted for by the fact that these geometric isomers not only are similar in pK, values, but are also of identical molecular mass. Thus, different migration velocities for these isomers cannot be achieved only by varying the pH value of the buffer. Consequently, the influences of other buffer modifiers on separating these analytes must be investigated further.
3.2. The effects of cyclodextrins on separation a-Cyclodextrin and B-cyclodextrin are frequently employed modifiers for the running buffers of CE. In addition, their hydrophobic interiors and cavity sizes may not only facilitate the formation of inclusion complexes with the preservatives but also improve the separation. For these reasons, a-cyclodextrin and B-cyclodextrin were selected to separate the analytes. Regardless of the cyclodextrin types, the separation results from adding cyclodextrins in pH 10.0 buffer were far superior to those in pH 9.0 buffer, although the analysis time was somewhat longer. Consequent-ly, the pH 10.0 buffer was selected for further investigation. The results for addition of cyclodex-trins to pH 10.0 buffer are discussed below.
Fig. 1 illustrates the effects of different con-centrations of a-cyclodextrin on migration behav-iours of the nine analytes. The migration velocities of benzoic acid and p-hydroxybenzoic acid did not alter when a-cyclodextrin concentration was in-creased from O-5 r&l. This indicates that these two compounds could not form stable inclusion complex-es with a-cyclodextrin. The focus now is on the bottom seven curves in Fig. 1. The migration times of sorbic acid and the six p-hydroxybenzoates de-creased with an increase in a-cyclodextrin concen-tration. In addition, the changes in the migration velocities of isopropyl and isobutyl p-hydroxy-benzoate were less than those of the other five analytes. This finding suggests that the latter five have stronger interactions with o-cyclodextrin than the former two. Moreover, adding a-cyclodextrin exerted a pronounced effect on methyl p-hydroxy-benzoate because its migration sequence exhibited the largest shift. This is probably due to the fact that, among these analytes, methyl p-hydroxybenzoate forms the most stable inclusion complex with CL-cyclodextrin.
Experimental results demonstrate that n-butyl and
n-propyl p-hydroxybenzoates interact more strongly with o-cyclodextrin than their isomers do. The differences between n-butyl p-hydroxybenzoate and isobutyl p-hydroxybenzoate, and between n-propyl p-hydroxybenzoate and isopropyl p-hydroxybenzoate lie only in the geometrical shape. This finding implies that the structure of the alkyl group is a critical factor for the p-hydroxybenzoates to have different degrees of interactions with cw-cyclodextrin. The main interaction force between the analytes and a-cyclodextrin appears to be the hydrophobic inter-action in the cyclodextrin’s cavity. Therefore, the cavity size of cyclodextrin may play a significant role in separating the analytes.
Because the cavity size of B-cyclodextrin is larger than that of a-cyclodextrin, the former was used as an alternative modifier to examine its influence on separation. The results revealed that all preservatives except sorbic acid were influenced by B-cyclodex-trin. The migration times of benzoic acid and p-hydroxybenzoic acid decreased with an increase in B-cyclodextrin concentration. This finding suggests that the interactions between the hydrophobic cavity of B-cyclodextrin and these two preservatives are sufficiently strong to form inclusion complexes. However, sorbic acid had a much weaker interaction with B-cyclodextrin than with a-cyclodextrin. Such a weak interaction may be due to the linear molecular structure of sorbic acid, which can thus form a more stable inclusion complex with ol-cyclodextrin since the interior of a-cyclodextrin is smaller. The migra-tion sequences of the six p-hydroxybenzoate were not changed by increasing the B-cyclodextrin con-centration from O-5 n&f. These esters have similar degrees of interaction with B-cyclodextrin, although their sizes, shapes and carbon chain lengths differ in their alkyl groups. These findings were quite differ-ent from those where a-cyclodextrin was the modi-fier. The results demonstrate that the cavity size of cyclodextrin plays a prominent role with respect to the interactions between the preservatives and cyclo-dextrins.
Even though most analytes interacted with B-cyclodextrin, n-propyl and isopropyl p-hydroxy-benzoates could not be resolved by adding B-cyclo-dextrin to the running buffer. However, these ana-lytes were successfully separated using 2 mA4 CL-cyclodextrin as a modifier in the running buffer.
K.-L. Kuo. Y.-Z. Hsieh I J. Chromarqr. A 768 (1997) 3_34-341
I
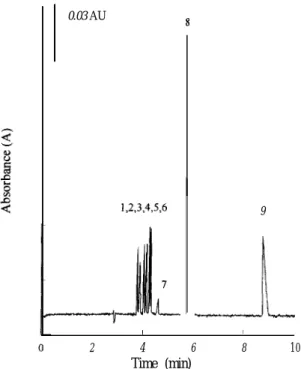
0.03 AU 1,2,3,4,X6 8 9 __.&_l_ I 1 2 4 6 Time (min) 8 1 0Fig. 2. Separation of nine preservatives by CE. Conditions: separation solution, 0.035 M borax-NaOH buffer (pH 10.0) containing 2 mM a-cyclodextrin. Other conditions as in Fig. I.
Thus, o-cyclodextrin was selected as the modifier to analyze the preservatives.
Fig. 2 displays the electropherogram of the nine preservatives at the optimum conditions. The satis-factory separation was completed within 9 min using the borax-NaOH buffer (pH 10.0) containing 2 n&I a-cyclodextrin. Table 1 lists the average migration times, reproducibilities, slopes, intercepts and
corre-lation coefficients of analytes’ calibration graphs. The R.S.D. values of the migration times were less than 0.99%. Peak area of the electropherogram was employed for the quantitation of preservatives. The linearities of the calibration graphs for those analytes were of at least two orders from 5 to 500 p,g ml-’ with correlation coefficients exceeding 0.99 1. The limits of detection for those preservatives ranged from 0.4 to 2.2 t_t,g ml -‘.
Table I
Average migration times, reproducibilites, slopes, intercepts, and correlation coefficients of preservatives’ calibration graphs
Analyte Migration R.S.D. Slope Intercept
time (min)” (So)
Correlation coefficient of calibration graph (r)
I
002AU Benzoic acid / 0 2 4 6 Time (min) 8 IOFig. 3. Determination of preservatives in plum preserves. Con-ditions as in Fig. 2. n-Butyl p-hydroxybenzoate 3.79 0.59 0.00934 0.0194 0.999 Methyl p-hydroxybenzoate 3.89 0.66 0.00976 -0.0225 0.994 n-Propyl p-hydroxybenzoate 4.05 0.63 0.01087 -0.0198 0.998 Ethyl p-hydroxybenzoate 4.14 0.65 0.01149 -0.0714 0.991 Isobutyl p-hydroxybenzoate 4.26 0.75 0.01107 -0.0118 0.999 Isopropyl p-hydroxybenzoate 4.32 0.63 0.01130 -0.0888 0.998 Sorbic acid 4.63 0.82 0.02475 -0.2116 0.999 Benzoic acid 5.74 0.99 0.03986 -0.1089 0.999 p-Hydroxybenzoic acid 8.79 0.96 0.0422 I -0.1195 0.999 “n=8.
K.-L. Kuo, Y.-Z. Hsieh / J. Chromarogr. A 768 (1997) 334-341 339
I
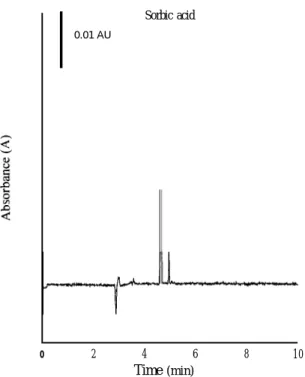
0.01 AU Sorbic acid 0 2 4 6 Time (min) 8 1 0Fig. 4. Determination of preservatives in dried bean curd. Con-ditions: detection wavelength, 254 nm. Other conditions as in Fig.
L.
3.3. Extracting and analyzing preservatives from
selected food products
Ethanol and methanol provided high solubility for the preservatives in this study and had good mis-cibility with aqueous solution. Thus, they were
Table 2
The extraction recoveries of preservatives in food products
selected to extract preservatives in plum preserves and dried bean curd. Ethanol was an excellent solvent for extracting plum preservatives. However, extracting the preservative in dried bean curd by ethanol took longer and required more solvent than the methanol-based method. Therefore, methanol was used as the solvent for dried bean curd.
To determine the preservatives in the samples, each peak was identified by comparing both the migration times of the standards and the UV-Vis spectra of the standards acquired by a diode-array detector. Moreover, a standard addition method was employed to further confirm the identity of the preservatives in the actual samples.
Fig. 3 depicts the results of determining benzoic acid in plum preserves. According to these results, the extraction method was highly selective, since only two peaks appeared in the electropherogram. Moreover, the CE method can successfully deter-mine benzoic acid. Fig. 4 shows the results of determining sorbic acid in dried bean curd. Several compounds in this product were extracted by metha-nol after ultrasonic agitation. Nevertheless, sorbic acid could be separated from these compounds using optimum separation conditions.
Table 2 presents the extraction recoveries for the nine preservatives spiked in plum preserves and dried bean curd. Satisfactory results were obtained by the ultrasonic extraction method. The recoveries of preservatives ranged from 93.2-107.6%. The R.S.D. values of the recoveries were all below 4.8%.
Analyte Plum preserves”
Recovery h (%) n-Butyl p-hydroxybenzoate 96.9 Methyl p-hydroxybenzoate 98.9 n-propyl p-hydroxybenzoate 94.9 Ethyl p-hydroxybenzoate 98.2 Isobutyl p-hydroxybenzoate 96.6 Isopropyl p-hydroxybenzoate 100.8 Sorbic acid 97.5 Benzoic acid 101.3 p-Hydroxybenzoic acid 96.5
a The extraction procedure was described in Section 2.3. h n=3. R.S.D. (%) 3.4 3.3 3.6 4.0 1.6 4.8 1.9 3.2 0.5
Dried bean curd” Recoveryh (%) 102.0 98.9 94.9 103.0 107.6 96.4 93.2 101.4 100.6 R.S.D. (%) 2.6 3.6 0.5 2.5 2.0 2.7 4.1 3.4 4.7
340
Table 3
K.-L. Kuo, Y.-Z. Hsieh I J. Chromatogr. A 768 (1997) 334-341
Determination of the amounts of preservatives in selected food products
Food sample Preservative Concentration (p,g ml-‘)
(R.S.D., %)h
Plum preserves Benzoic acid
Dried bean curd Sorbic acid
Soy sauce (WC)” Benzoic acid
Soy sauce (WW)” n-Butyl p-hydroxybenzoate
’ Soy sauces (WC and WW) are manufactured by different companies. hn=3.
430.4 (1.1) 1276.1 (1.2) 615.7 (2.7) 49.3 (2.2)
Table 3 lists the amounts of benzoic acid in plum preserves and of sorbic acid in dried bean curd. The R.S.D. values of those results were less than 1.2%. The above results therefore suggest that the CE method coupled with the simple extraction method is more than adequate for analyzing preservatives in solid food.
Fig. 5a,b display the electropherograms of
pre-0.02 AU
I
Bemic acid (a)I 0 2 4 6 8 IO Time (min)
II
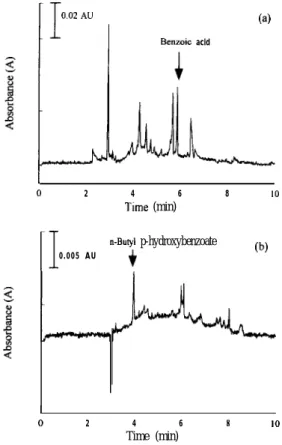
n8utyl p-hydroxybenzoate 0.005 AU + @) I 0 2 4 6 8 IOTime (min) References
Fig. 5. Determination of preservatives in (a) WC soy source and 111 G. Burini and P. Damiani, J. Chromatogr., 543 (1991) 69. (b) WW soy sauce. Conditions: detection wavelengths, (a) 195 nm [2] A. Montafio, A.H. Sinchez and L. Rejano, Analyst, 120 and (b) 295 nm. Other conditions as in Fig. 2. (1995) 2483.
servatives in two soy sauces manufactured by differ-ent companies. More than five peaks appeared in those figures. However, the preservative peaks were clearly differentiated from the unknown compounds in soy sauce. According to the experimental results, determining preservatives in soy sauce required no extraction procedure because they could be directly analyzed by the CE method. Therefore, the CE method proposed here offers a technique with high selectivity, high precision and rapid analysis for the determination of preservatives in soy sauce. Table 3 lists the quantities of preservatives in two soy sauces. In Taiwan, the maximum permitted amounts of benzoic acid or the six p-hydroxybenzoate in soy sauce are 600 and 250 mg kg-‘, respectively. The above analytical results indicate that the amounts of preservatives added in those two soy sauces are below the limits prescribed by governmental regula-tions. As a final remark, this study has successfully determined preservatives of selected food products. Thus, this CE method
analyze preservatives in products.
Acknowledgments
should be applicable to a wider range of food
This research was supported by 2 113-M-009-007 from the National of Taiwan, Republic of China.
Grant NSC 85 Science Council
K.-L. Kuo, Y.-Z. Hsieh I J. Chromatogr. A 768 (1997) 334-341 341 [3] D. Ivanovic, M. Medenica, E. Nivaud-Guemet and M.
Guemet, Chromatographia, 40 (1995) 652. [4] G. Burini, J. Chromatogr. A, 664 (1994) 213.
[5] H. Terada and Y. Sakabe, J. Chromatogr., 346 (1985) -333. [6] B.H. Chen and S.C. Fu, Chromatographia, 41 (1995) 43. [7] P.D. Grossman and J.C. Colbum (Editors), Capillary
Electro-phoresis-Theory and Practice, Academic Press, San Diego, CA, 1992.
[8] F. Fore& L. Krivankova and P. Bocek, Capillary Zone Electrophoresis, VCH, Weinheim, 1993.
[9] N.A. Guzman (Editor), Capillary Electrophoresis Technolo-gy, Marcel Dekker, New York, 1993.
[IO] S.F.Y. Li, Capillary Electrophoresis, Elsevier, Amsterdam, 1993.
[l I] M. Novotny, H. Soini and M. Stefansson, Anal. Chem., 66 (1994) 646 A.
[12] H. Nishi and S. Terabe, J. Chromatogr. A, 735 (1996) 3. [ 131 J. Snopek, I. Jelinek and E. Smolkova-Keulemansovl, J.
Chromatogr., 452 (1988) 571.
[14] Y.-Z. Hsieh and H.-Y. Huang, J. Chromatogr. A, 745 (1996) 217.
[ 151 D. Kaniansky, M. Ma&, V. Madajovi and J. Mar& J. Chromatogr. A, 677 (1994) 179.
[16] C.O. Thompson, V.C. Trenerry and B. Kemmery, J. Chroma-togr. A, 694 (1995) 507.
[ 171 C.O. Thompson, VC. Trenerry and B. Kemmery, J. Chroma-togr. A, 704 (1995) 203.