國 立 交 通 大 學
材料科學與工程學系
博 士 論 文
奈米結構性材料之製作與合成及其於
直接甲醇燃料電池之應用
Fabrication and Synthesis of Nanostructured
Materials for Direct Methanol Fuel Cell Applications
研 究 生 : Jitendra Nath Tiwari
指導教授 : 潘扶民教授
奈米結構性材料之製作與合成及其於
直接甲醇燃料電池之應用
Fabrication and Synthesis of Nanostructured Materials for
Direct Methanol Fuel Cell Applications
研 究 生: Jitendra Nath Tiwari Student: Jitendra Nath Tiwari
指導教授: 潘扶民 博士 Advisor: Dr. Fu-Ming Pan
國 立 交 通 大 學
材料科學與工程學系
博士論文
A Dissertation
Submitted to Department of Materials Science and Engineering
College of Engineering
National Chiao Tung University
in Partial Fulfillment of the Requirements
for the Degree of Doctor of Philosophy
in Materials Science and Engineering
July 2009
Hsinchu, Taiwan, Republic of China
奈米結構性材料之製作與合成及其於直接
甲醇燃料電池之應用
研究生: Jitendra N. Tiwari 指導教授: 潘扶民 博士
國 立 交 通 大 學
材料科學與工程學系
摘要
現今奈米尺度的科學與科技快速發展下,將化學能轉換成電能與低環境汙染優點 的高效率直接甲醇燃料電池(DMFC) 提供了一個新的契機與方向。藉由奈米結構材料的 大表面積,提供高分散性的鉑與鉑釕合金承載,因此提升直接甲醇燃料電池的功率密 度。在這論文裡,我們研究奈米結構陽極觸媒的合成技術以及奈米結構觸媒的電催化特 性。 製備觸媒載體採用兩個不同的方法,分別為奈米結構材料陽極氧化鋁(AAO)模板 以及奈米孔洞的石墨化碳(g-C)。關於氧化鋁(AAO)模板方式,首先在矽晶片上成長矽奈 米尖錐(SNCs)和非晶型碳(α-C)覆蓋的矽奈米尖錐陣列,用來做為觸媒的的載體,接著電 鍍奈米鉑觸媒。有序排列的非晶型碳包覆矽奈米錐(ACNC)陣列產生,所造成的氧化 鋁孔隙通道陣列安排模式,藉由電漿蝕刻在微波電漿化學氣相沉積(MPCVD)系統,轉移 到有氧化鈦TiOx 光罩的矽載體。在 MPCVD 過程,一層約 5 奈米厚的 α-C 在矽奈米尖 錐上沉澱。為了獲得高電流密度和重量活性,利用雙極性脈衝電鍍粒徑分佈均勻低於5 奈米的奈米鉑沉積在有秩序的矽奈米尖錐和α-C 包覆矽奈米尖錐上。藉著包覆一層奈米 結晶石墨化碳,可以增加在矽奈米錐上的鉑奈米球分散度。根據電化學測量,奈米結構
對甲醇氧化反應的催化活性優於全部覆蓋像平板狀的陽極。 此外,我們開發了一種新方法,形成奈米孔洞的石墨化碳,這是用來作為承載鉑 和鉑釕合金催化劑,所使用的金剛烷火焰。電化學測試結果表明,鉑釕承載在奈米孔洞 的石墨化碳對於甲醇電化學氧化有很好的催化活性和穩定性。良好的催化活性歸因於較 高表面積的石墨化碳。 為了瞭解對於甲醇氧化反應在鉑觸媒的形態上的電催化活性的相關性,藉由在 25○C 下,直接雙極脈衝電化學沉積合成二維和三維鉑奈米結構材料。我們同時成功的 在室溫下,合成了不同形狀的奈米鉑,如四面體和立方體在矽基板上。電化學研究中, 二維和三維和形狀控制鉑的奈米結構顯示出對於直接甲醇燃料電池效率有潛在的應用。
Fabrication and Synthesis of Nanostructured
Materials for Direct Methanol Fuel Cell
Applications
Student: Jitendra N. Tiwari Advisor: Dr. Fu-Ming Pan
Department of Materials Science and Engineering
National Chiao Tung University
Abstract
Nanostructured materials can provide a large surface area for the loading of highly dispersed catalyst nanoparticles, such as Pt and Pt-Ru, thereby improving the power density of direct methanol fuel cells (DMFCs). The thesis prepares various nanostructured anode electrocatalysts, and investigates electrocatalytic characteristics of the nanostructured catalysts.
Two different approaches are adopted to prepare electrocatalyst supports, which are anodic aluminum oxide (AAO) templated nanostructured materials and nanoporous graphitic carbon (g-C). For the AAO templation approach, Si nanocones (SNCs) and amorphous carbon (α-C) coated Si nanocones arrays are first fabricated on the Si wafer for the use as the catalyst support, followed by electrodeposition of Pt nanoparticles. Well-ordered α-C coated Si nanocone (ACNC) arrays were produced as a result of the arrangement pattern transfer of AAO pore channel arrays to Si substrates with TiOx nanomasks by the plasma etch in the
microwave plasma chemical vapor deposition (MPCVD) system. A layer of α-C about 5 nm thick was in-situ deposited on the SNCs during the MPCVD process. In order to obtain the high current density and mass activity, well dispersed Pt nanoparticles with a uniform size distribution below 5 nm were deposited on ordered SNC and ACNC by bipolar pulse
NCTU MSE
electrodeposition. The dispersion of Pt nanoparticles on SNC was improved by coating a nanocrystalline g-C. The electrocatalytic activity of the nanostructured anodes toward methanol oxidation reaction (MOR) are superior to anodes with a blanket surface according to electrochemical measurements.
In addition, we developed a new method to form nanoporous g-C, which was utilized as the support for Pt and Pt-Ru alloy catalysts, by the used of an adamantane flame. Electrochemical tests and results show the Pt-Ru supported on nanoporous g-C had excellent catalytic activity and stability toward methanol electrooxidation. The excellent catalytic activity may be attributed to the higher surface area of g-C.
To investigate the dependence of electrocatalytic activity toward MOR on the morphology of Pt catalyst, the two dimensional (2D) and three dimensional (3D) Pt nanostrucutred materials were also synthesized by direct bipolar pulse electrochemical deposition at 25○C. We have also successfully synthesized Pt nanoparticles of different shapes such as tetrahedron and cube by fasten silicon at room temperature. An electrochemical study of 2D, 3D and the shape-controlled Pt nanostructures were showing its potential application for efficient DMFCs.
Acknowledgements
Ph.D. study at National Chiao Tung University (NCTU) will be a precious experience in my life. I would like to thank all the people who have supported and helped me during this period.
First of all, I would like to express my sincere thanks to my supervisor, Prof. Fu-Ming Pan, for introducing me to the area of fuel cells and his inspiring and encouraging way to guide me to a deep understanding of knowledge work. Prof. Pan is an excellent teacher and an example of how to do research. His intelligent guidance, invaluable comments and detailed training during the whole work with this dissertation are deeply appreciated. His strict and preciseness in pursuing knowledge and hardworking impressed and encouraged me to fulfill my dissertation in the past years. He has been a great mentor with his enthusiasm, understanding and willingness to help students professionally and personally. I also appreciate Dr. K.-K. Lin and Dr. T.-M. Chen for serving as my experimental supports and for their precious suggestions to my study. I would like to express my thanks to all my group members for their friendship: C.-C. Chang, C.-S. Chen, Y.-F. Hsieh, Y.-M. Chang, C.-H. Lai, K.-D. Ko, Dr. C.-C. Lin, Dr. P.-Y. Kuo, C.-J. Huang and Dr. C.-H. Tsai.
Most of all, I would like to dedicate this work to my parents, my sister and brother for their endless love and supports throughout my life. Their encouragement has been a source of inspiration that led to the completion of this thesis.
The financial support of my Ph.D. research work by a grant from the Ministry of Economic Affairs (MOEA), Taiwan, R.O.C., and NCTU, Taiwan, R.O.C. is grateful acknowledged.
Contents
Abstract (in Chinese)……….. I Abstract (in English) ………III Acknowledgements………V Contents………VI Abbreviations………X Table Captions………XIII Figure Captions………XIV Chapter 1 Introduction………1 1.1 Background………1 1.2 Motivation………...………..…………3
Chapter 2 Literature Review………...5
2.1 Fuel cells…………...………...5
2.1.1 Introduction………...………...5
2.1.2 Principles of fuel cells………...5
2.1.3 Types of fuel cells………...7
2.2 Direct methanol fuel cells (DMFCs)………...12
2.2.1 Introduction………...12
2.2.2 Principle of DMFC operation………...13
2.2.3 DMFC anode………..15
2.2.4 DMFC cathode………...17
2.3 Mechanism of methanol oxidation………..18
2.4 Features………...19
2.6 Anode catalysts for DMFC……….20
2.6.1 Pt nanostructures………...21
2.6.2 New cost-effective synthesis routes………...22
2.6.3 Binary and multiple catalysts………...23
2.6.4 New catalyst supports………...29
2.7 Pulse electrodeposition………...30
2.7.1 Pulse waveform………..30
2.7.2 Potentiostatic bipolar pulse electrodeposition………...31
2.7.3 Advantages of pulse plating………...33
2.7.4 Theory of pulse plating………..34
2.8 Structure of the thesis………..35
Chapter 3 Experimental methods………..37
3.1 Experimental flowcharts………...37
3.2 Deposition of TiN and Al films………..39
3.3 Anodic aluminum oxide………..40
3.4 Reactive-ion-etch system………...41
3.5 MPCVD system………..43
3.6 Electrodeposition of Pt nanostructures………...44
3.7 Material analysis methods………...45
3.7.1 Raman spectroscopy………..45
3.7.2 SEM………...45
3.7.3 TEM………...46
3.7.4 AES and XPS………...48
3.8 Electrochemical measurements………...49
Chapter 4 Pt Nanoparticles Supported on Ordered Si Nanocones as Catalyst for Methanol Oxidation………..50
4.1 Introduction………...50
4.2 Fabrication procedure of the SNC array………...51
4.3 Electrodeposition of Pt nanoparticles on SNC array………..53
4.4 Structural characterization of SNC array………...53
4.5 Structural characterization of Pt/SNC array………...56
4.6 Electrochemical characterization………...59
4.7 Summary……….65
Chapter 5 Fabrication and Electrocatalytic Properties of Pt Nanoparticles Electrodeposited on Amorphous Carbon Coated Silicon Nanocones………..66
5.1 Introduction………...66
5.2 Fabrication procedure of the ACNC array………...67
5.3 Electrodeposition of Pt nanoparticles………...70
5.4 Material properties of the Pt-ACNC electrode………...71
5.5 Electrocatalytic activity………...76
5.6 Summary……….83
Chapter 6 Novel New Approach to the Synthesis of Nanoporous Graphitic Carbon as a Unique Electrocatalysts Support for Methanol Oxidation………...85
6.1 Introduction………...85
6.2 Synthesis of 3D nanoporous g-C, Pt/3D nanoporous g-C and Pt50-Ru50/3D nanoporous g-C……….86
6.3 Physico-chemical characterization………...87
6.4 Electrocatalytic activity ………..92
6.5 Summary……….98
Chapter 7 Synthesis of 2D Continuous Pt Island Networks for Methanol Electrooxidation...99
7.1 Introduction………...99
7.3 Structural characterization ………...101
7.4 Electrochemical measurements………...103
7.5 Summary……….108
Chapter 8 Synthesis of 3D Platinum Nanoflowers and Their Electrochemical Characteristics………110
8.1 Introduction………...110
8.2 Synthesis of the 3D Pt nanoflowers………..110
8.3 Characterization of the 3D Pt nanoflowers………...111
8.4 Electrochemical characteristics………...114
8.5 Summary……….121
Chapter 9 Controlled Synthesis and Growth of Perfect Platinum Nanocubes by Fasten Silicon at NTP………122
9.1 Introduction………...122
9.2 Synthesis process of Pt nanostructures……….123
9.3 Structural characterization of Pt nanostructures………...124
9.4 Electrocatalytic activity……….136
9.5 Summary……….139
Chapter 10 Conclusions and Future Works………140
10.1 Conclusions………140
10.2 Future Works………..144
References………...146
Appendix………..174
Abbreviations
AAO Anodic aluminum oxides
ACNC Amorphous carbon coated Si nanocone
α-C Amorphous carbon
AFC Alkaline fuel cell
Ec Average current density AES Auger electron spectroscopy
BPPE Bipolar potentiostatic pulse electrodeposition
CNT Carbon nanotube
CA Chronoamperometry
CV Cyclic voltammetry
Rct Charge-transfer resistance
CPE Constant phase element DMFC Direct methanol fuel cell DEFC Direct ethanol fuel cell
DMF Dimethyl formamide
DC Direct current
EOR Ethanol oxygen reaction
EDX Energy-dispersive X-ray analysis EELS Electron energy loss spectroscopy
EIS Electrochemical impedance spectroscopy ESA Electroactive surface area
F Faraday’s constant
∆G Free energy change
FS Fasten silicon
FFT Fast Fourier transform g-C Graphitic carbon
QH Hydrogen adsorption charge
HDP High-density plasma
HRTEM High-resolution TEM HHV Higher-heating value
VH High potential
ICP-RIE Inductively coupled plasma reactive ion etch
VL Lower potential
LHV Lower-heating value
MOR Methanol oxidation reaction
MPCVD Microwave plasma chemical vapor deposition
MEA Membrane electrode assembly
MCFC Molten carbonate fuel cell NTP Normal temperature and pressure
n Number of moles
η Overpotential
ηo Overpotential at the exchange potential
ORR Oxygen reduction reaction PPE Potentiostatic pulse electrodeposition
Ton Potential on time
Toff Potential off time
PAFC Phosphoric acid fuel cell
PEMFC Polymer electrolyte membrane fuel cells PBPP Potentiostatic bipolar pulse plating
PRC Pulse reverse current RIE Reactive-ion-etch
Er Reversible potential
E○r Reversible cell voltage
SCE Saturated calomel electrode SAED Selected area electron diffraction
SAD Selected area electron diffraction Rs Solution resistance
SOFC Solid oxide fuel cell
SNC Si nanocone SEM Scanning electron microscope
2D Two dimensional
3D Three dimensional
TiOx Titanium oxide
TEM Transmission electron microscopy
Table Captions
Table 2-1 Compilation of calculated segregation energies on the closest packed surface of all binary combinations of the transition metals………25 Table 2-2 Shifts in d-band centres of surface impurities (A) and overlayers (B) relative to the clean metal values (bold)………25 Table 2-3 Possible occurrence of segregation and possible shift in d-band centre for the
elements of the trimetallic Pt-Ru-M alloy with metals (M) as Mo, W, Co, Fe, Ni, Cu, Sn and Au………28
Figure Captions
Figure 2-1 Simplistic representation of a various types of fuel cells….….………...8 Figure 2-2 Schematic diagram of the DMFCs………..14 Figure 2-3 TEM images of Pt hollow nanospheres………..22 Figure 2-4 The simple template-free electrochemical lithiation synthesis of nanoporous
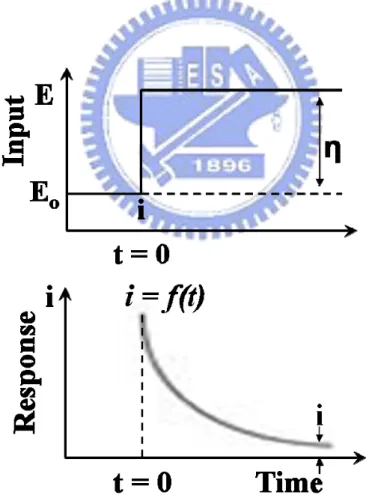
structures……….23 Figure 2-5 shows the electronegativities (eV) of the transition metals………24 Figure 2-6 shows the Bulk Wigner-Seitz radius [a.u.] of the transition metals………24 Figure 2-7 shows the schematic diagram of apparatus for potentiostatic measurements; E,
controlled potential; e1, test electrode; e2, reference electrode; e3, counter
electrode………..32 Figure 2-8 shows the variation of current with time during potentiostatic electrolysis………32 Figure 2-9 shows the schematic diagram of potential pulse waveform and pulse-current
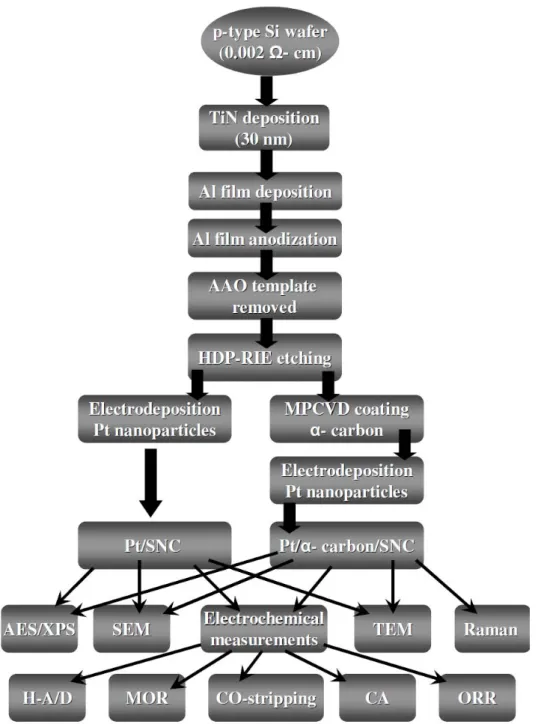
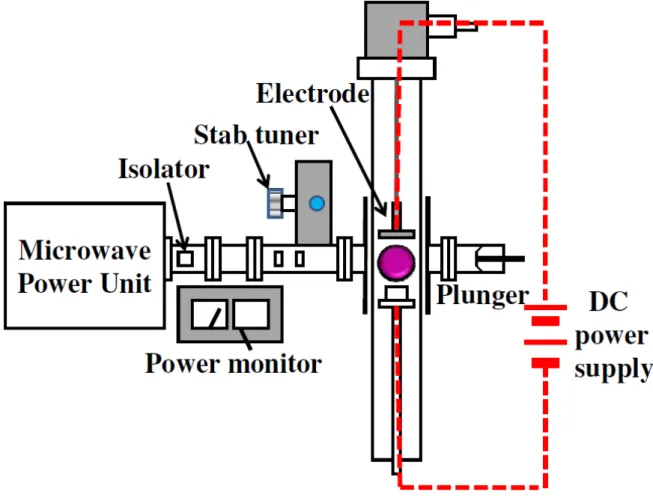
waveform………..33 Figure 3-1 Experimental flowchart of fabrications and analyses of Pt/SNC and Pt/ACNC
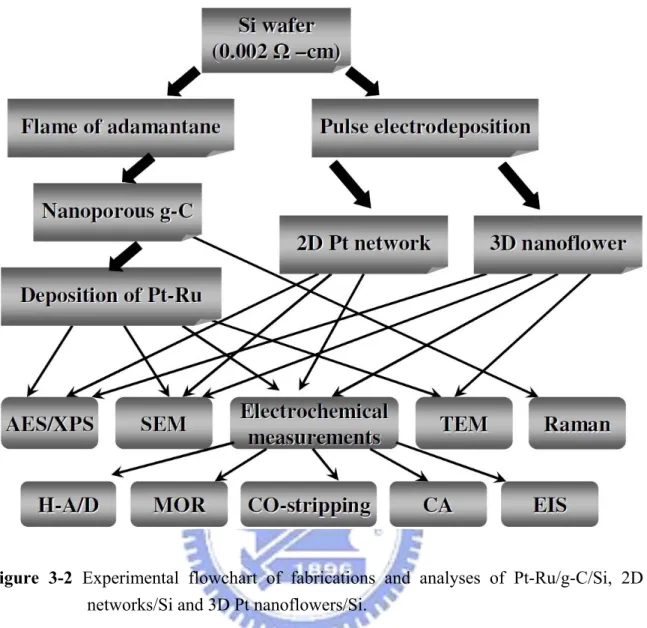
arrays……….…….….38 Figure 3-2 Experimental flowchart of fabrications and analyses of Pt-Ru/g-C/Si, 2D Pt
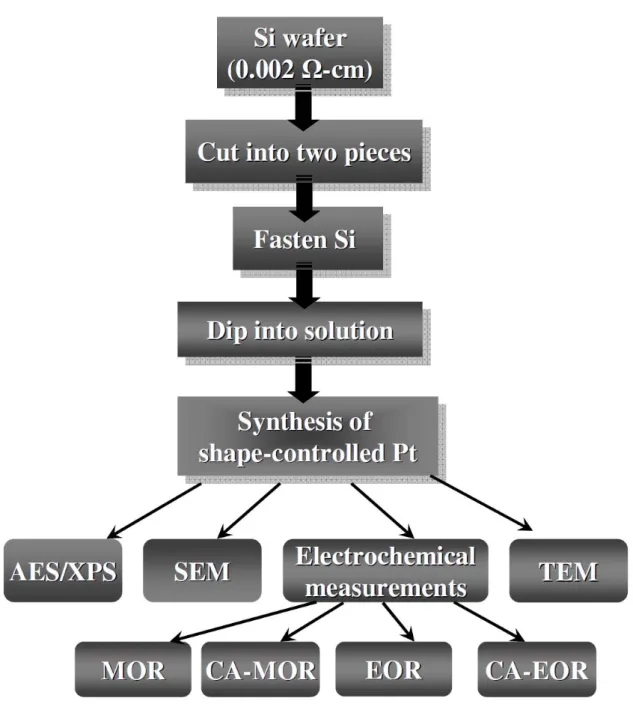
networks/Si and 3D Pt nanoflowers/Si………39 Figure 3-3 Experimental flowchart of synthesis and analyses of shape-controlled Pt
nanoparticles……….…….….40 Figure 3-4 Schematic diagram of experiment setup for aluminum anodization….…….….41 Figure 3-5 Schematic diagram of ICP chamber………42
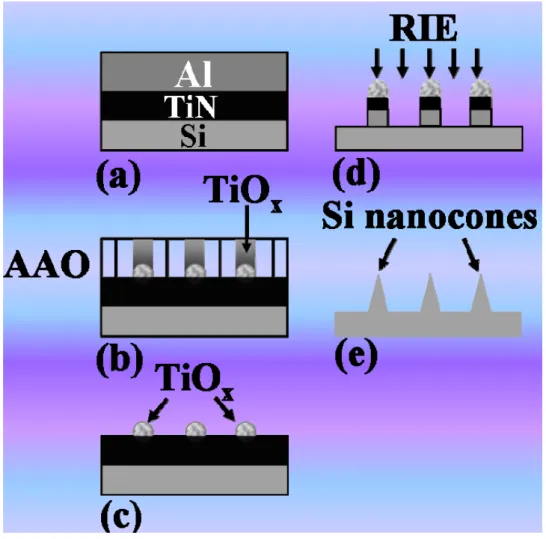
Figure 3-6 Schematic diagram of the bias assisted microwave plasma chemical vapor deposition system……….…….….43 Figure 3-7 Schematic diagram of the electrochemical deposition setup……….…….…44 Figure 3-8 Schematic drawing of the basic principle of the SEM………46 Figure 3-9 Schematic diagram of the TEM image modes (a) Bright field image (b) Dark field image……….…….…47 Figure 3-10 Schematic diagram of the electrochemical measurements setup……….…….…49 Figure 4-1 shows the fabrication scheme of SNC arrays: (a) deposition of TiN and Al thin film on the Si wafer by sputter deposition and thermal evaporation, respectively, (b) anodic oxidation of the Al film and formation of TiOx nanodots, (c) removal of
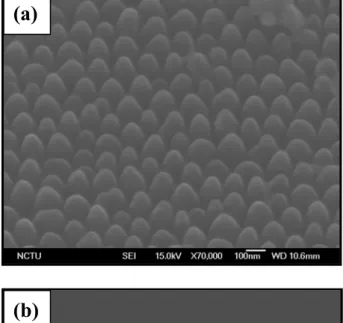
the AAO by wet etch, (d) reactive ion etch (RIE) of the remaining TiN and the Si substrate, and (e) formation of the SNC arrays……….…….52 Figure 4-2 shows the side-view SEM images of the fabrication of SNC arrays: (a) TiOx
nanomasks after the removal of the AAO layer by wet etch, (b) the TiOx/TiN/SNC arrays after the RIE etch by SF6, Cl2 and O2 for 40 sec. and (c)
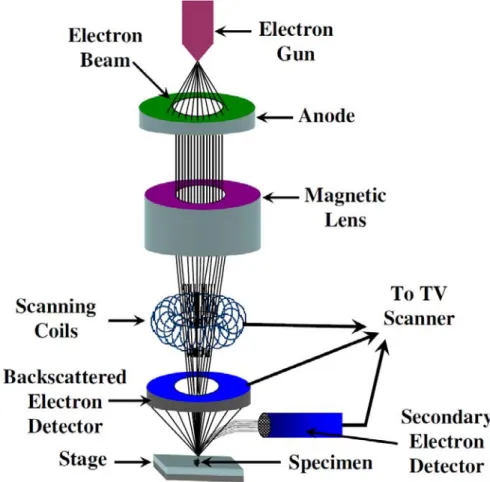
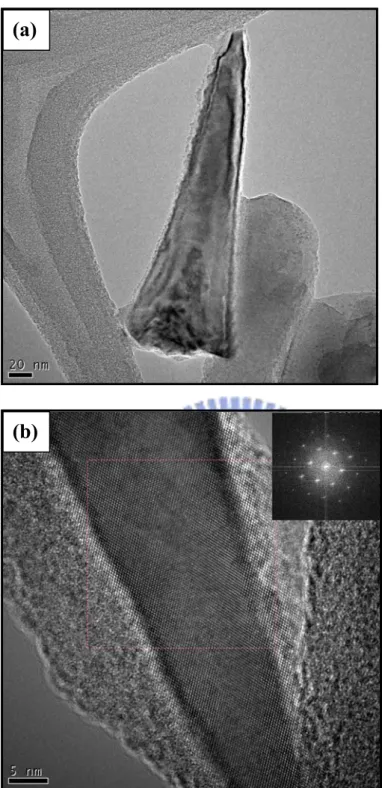
removal of the oxide layer by wet chemical etch and the formation of highly ordered SNC arrays………54 Figure 4-3 shows (a) TEM image of the SNC array and (b) high-resolution TEM image of the SNC array in which the inset reveals the selected area diffraction pattern………55 Figure 4-4 shows SEM images of the SNC array with electrodeposited Pt nanoparticles; (a) a side view, and (b) cross-sectional view……….…….57 Figure 4-5 shows the XPS spectrum of the Pt/SNC arrays………58 Figure 4-6 shows HRTEM image of the Pt/SNC array in which the inset reveals the selected area diffraction pattern of the nanocone……….…….….58 Figure 4-7 EELS mapping images of (a) Silicon, and (b) Pt for the Pt nanoparticles loaded
Figure 4-8 CO stripping cyclic voltammograms of (a) Pt nanoparticles electrodeposited on the ordered SNCs and (b) the Pt film electrodeposited on the flat silicon substrate in a CO saturated 1M H2SO4 solution. The scan rate is 20 mVs-1………60
Figure 4-9 Cyclic voltammograms for Pt/SNC electrode in 1M H2SO4 aqueous solution at
room temperature and with a scan rate of 25 mVs-1: (a) the 2nd cycle and (b) the 1000th cycle………61
Figure 4-10 shows the plot of electroactive surface area (ESA) as a function of the number of the cyclic voltammetric scan for (a) the Pt film electrodeposited on the flat Si substrate and, (b) the ordered Pt/SNC electrode………61 Figure 4-11 shows the cyclic voltammograms of (a) the Pt catalyst nanoparticles on the
ordered SNC array and (b) the Pt film electrodeposited on the flat silicon substrate in an argon saturated 1 M CH3OH/1 M H2SO4 aqueous solution. The
scan rate is 25mVs-1………62
Figure 4-12 shows the chronoamperometric response of (a) Pt nanoparticles electrodeposited on the ordered SNCs, and (b) the Pt film electrodeposited on the flat Si substrate in a saturated 1 M CH3OH/1 M H2SO4 aqueous solution at 0.3V (SCE) for 2 h.
The scale of curve b is multiplies by 100………63 Figure 5-1 shows the fabrication processes of the ordered α-C coated SNC array: (a)
deposition of TiN and Al thin films on the Si wafer by sputter deposition and thermal evaporation, respectively, (b) formation of the porous AAO template (c) formation of TiOx nanodots in the AAO pore channels, (d) removal of AAO by
wet etch, (e) RIE of the remaining TiN and silicon substrate, forming Si nanocones, and (f) deposition of the α-C layer on SNCs by MPCVD…………68 Figure 5-2 shows the side-view SEM image of TiOx nanopillars after the removal of the AAO
layer by wet etch. The inset shows the plane-view SEM image of TiOx nanopillar
arrays………69 Figure 5-3 shows the side-view SEM images of the α-C coated SNC array (A) before and (B) after the electrodeposition of Pt nanoparticles………72 Figure 5-4 shows TEM images (A) Bright-field TEM image of the α-C coated SNC with
electrodeposited Pt nanoparticles, (B) high resolution TEM image of the α-C coated SNC with Pt nanoparticles; (C) the SAD pattern, and (D) bright-field image of the
α-C coated SNC without the Pt nanoparticle………73 Figure 5-5 shows the wide scan XPS of the Pt nanoparticles deposited on the ACNC array, (B) the C(1s) XPS spectrum with curve fitted peaks, and (C) the Pt(4f) XPS spectrum………74 Figure 5-6 shows the Raman spectrum of the α-C coated SNCs without Pt nanoparticles…75 Figure 5-7 shows the room temperature cyclic voltammograms of (a) Pt/ACNC and (b) Pt film/Si electrodes measured at 25 mV s-1 in 1 M H2SO4………76
Figure 5-8 shows the CO stripping cyclic voltammograms of the Pt/ACNCs electrode in a CO saturated 1 M H2SO4 solution. The scan rate was 25 mV s-1………77
Figure 5-9 (A) Current density and mass activity of the Pt/ACNC electrode (solid rectangle) and the Pt film/Si electrode (open rectangle). (B) Loss of the Pt electrochemical surface area of (a) the Pt/ACNC electrode and (b) the Pt film/Si electrode as a function of the number of CV cycles in argon saturated 1 M H2SO4 aqueous
solution at room temperature (scan rate: 25 mV s-1)………79
Figure 5-10 (A) Cyclic voltammograms of ORR in O2 saturated 1 M H2SO4 aqueous solution
at 25oC for (a) the Pt/ACNC electrode and (b) the Pt film/Si electrode; and (B) ORR current density loss as a function of the number of CV cycles in oxygen saturated 1 M H2SO4 at room temperature for (a) the Pt/ACNC electrode and (b)
the Pt film/Si electrode (scan rate: 25 mV s-1)………82
Figure 6-1 shows the synthesis scheme of 3D nanoporous g-C: (a) the Si wafer was cut into 2 x 2 cm2 dimension (b) SiO2 layer was removed by treating with 10 % HF for 5 min
and dried by N2 gas (c) the cleaned sample was immediately placed in front of
flame adamantane for 7 minute, and (d) finally, sample was heated at 300○C for one hour to obtain a good depositing of 3D nanoporous g-C over the silicon substrate………87 Figure 6-2 shows the SEM image of the resulting 3D nanoporous g-C………….…………..87 Figure 6-3 Raman spectrum of 3D nanoporous g-C deposited on Si substrate……….….…..88 Figure 6-4 shows the plane-view SEM images (A) Pt/3D nanoporous g-C, and (B) typical Pt50-Ru50/3D nanoporous g-C………89
Figure 6-5 shows the TEM images (A) Pt/3D nanoporous g-C, and (B) typical Pt50-Ru50/3D
nanoporous g-C……….90 Figure 6-6 shows the EDX spectrum of the Pt catalyst on the g-C……….….91 Figure 6-7 shows the EDX spectrum of the Pt50-Ru50 alloy catalyst on the g-C, showing the
presence of Pt and Ru nanoparticles on the 3D nanoporous g-C………91 Figure 6-8 shows the XPS survey spectrum of the 3D nanoporous g-C supported Pt and Pt-Ru alloy catalysts……….92 Figure 6-9 shows the cyclic voltammograms of the Pt50-Ru50/3D nanoporous g-C and Pt/3D
nanoporous g-C electrodes in aqueous solution in N2 saturated aqueous solution of
1 M H2SO4. The scan rate was 25 mV s-1………93
Figure 6-10 shows the CO-stripping CVs in a CO saturated 1 M H2SO4 solution (A) the 3D
nanoporous g-C electrode; and (B) the Pt50-Ru50/3D nanoporous g-C electrode.
The scan rate was 25 mV s-1………95
Figure 6-11 (A) CVs of the Pt50-Ru50/3D nanoporous g-C and Pt/3D nanoporous g-C
electrodes in aqueous solution of 1 M H2SO4 - 1 M CH3OH at a scan rate of 25
mV s-1, and (B) Chronoamperometric curves for the Pt50-Ru50/3D nanoporous g-C
and Pt/3D nanoporous g-C electrodes in aqueous solution of 1 M H2SO4 - 1 M
CH3OH at a constant potential of 0.4 V vs. SCE………97
Figure 7-1 shows a schematic illustration of the continuous Pt island network on the flat silicon substrate. The right hand side exhibits the bifunctional mechanism of CO electrooxidation. The adsorbed oxygen containing species on the surface of SiO2
can facilitate the oxidation of CO-like poisoning species adsorbed on the active Pt sites………100 Figure 7-2 shows the SEM images: (A) blanket Pt on flat Si substrate; and (B) Ru on
blanket Pt/Si………101 Figure 7-3 shows the SEM image of the continuous Pt island network on the flat silicon
substrate………102 Figure 7-4 shows the x-ray photoelectron spectrum (XPS) of (a) blanket Pt/Si; (b) Ru
decorated blanket Pt; and (c) continuous Pt island network………102 Figure 7-5 shows the CO stripping cyclic voltammetry curves recorded at room temperature in a CO saturated 1 M H2SO4 solution at a scan rate of 20 mV s-1………103
Figure 7-6 shows the cyclic voltammograms in 1 M CH3OH+1 M H2SO4 at a scan rate of 25
mV s-1………105
Figure 7-7 shows the chronoamperometry curves in 1 M CH3OH+1 M H2SO4 at the potential
of 0.4 V………106 Figure 7-8 shows the Tafel plots for the electrochemical oxidation of 1 M CH3OH/1 M H2SO4
aqueous solution at a scan rate of 1 mV s-1………107
Figure 7-9 shows the electrochemical impedance spectra in 1 M CH3OH + 1 M H2SO4 at the
potential 0.3 V. The inset in figure shows the equivalent circuit model………108 Figure 8-1 shows the scanning electron micrographs of the 3D Pt nanoflower on the Si
substrate………111 Figure 8-2 shows the XPS survey spectrum of the 3D Pt nanoflower on the silicon
substrate………112 Figure 8-3 shows the energy window of Pt (4f) electrons………112 Figure 8-4 shows the TEM of nanopetals mechanical scratched off the 3D Pt nanoflower/Si
sample. The inset shows the SAED pattern, and (B) a high resolution TEM image of a nanopetal………113 Figure 8-5 shows the CVs of the 3D Pt nanoflower/Si and the Pt thin film /Si electrodes in the 1 M H2SO4 solution. The scan rate was 20 mV s-1………115
Figure 8-6 shows the CVs of the 3D Pt nanoflower/Si and the Pt thin film /Si electrodes in the 1 M CH3OH/1 M H2SO4 solution. The scan rate was 25 mV s-1………….….117
Figure 8-7 shows the CO stripping CVs of the 3D Pt nanoflower/Si and the Pt thin film /Si electrodes in the CO saturated 1 M H2SO4 solution. The scan rate was 25 mV
Figure 8-8 shows the chronoamperograms of the 3D Pt nanoflower/Si and the Pt thin film /Si electrodes in the 1 M CH3OH/1 M H2SO4 solution at the polarization potential of
0.4 V……….….119 Figure 8-9 shows the Nyquist plot of electrochemical impedance spectra (EIS) of the 3D Pt nanoflowers and the Pt thin film catalysts in the 1 M CH3OH + 1 M H2SO4
solution at the potential of 0.3 V. Insert is the equivalent circuit model used to fit the impedance spectra………120 Figure 9-1 shows the synthesis procedure of Pt nanostructures: (A) the Si-wafer is cut into 1.5 x 2 cm2 samples, (B) dipped into HF aqueous solution for 5 minutes in order to remove any native oxide layer on the Si samples, (C) then the polished side of cut two identical piece of the Si-wafer was fasten together and dipped into stirred 1 M H2PtCl6 + 1 M H2SO4 aqueous solutions, {after stirring for (a) 3 hr and (b) 5 hr
to form the truncated (cubes + tetrahedron) and truncated cubes respectively}, (D) furthermore, the perfect Pt nanocubes produced by mixing 1 M HCl into 1 M H2PtCl6 + 1 M H2SO4 aqueous solutions (vigorous stirring for 5 hr) ……….123
Figure 9-2 shows the SEM images of truncated Pt (cubes + tetrahedron) deposited on the FS sample at NTP for (A) 10, (B) 13, and (C) 15 min; (solution stirring for 3 hr). (D) Low-magnification TEM image of individual truncated Pt tetrahedron synthesized with the FS sample. (E) High-resolution TEM lattice image of the square region in single truncated Pt tetrahedron. The d-spacing between the fringes was ~0.23 nm, which was identified {111} plane of Pt; the inset shows the FFT of the lattice image gives the optical diffractogram, which clearly shows the presence of {111} p l a n e … … … 1 2 6 Figure 9-3 shows the SEM images of truncated Pt nanocubes deposited on the FS sample at NTP for (A) 13, (B) 15, and (C) 20 min; (solution stirring for 5 hr) …………127 Figure 9-4 (A) Low-magnification TEM image of individual truncated Pt nanocubes and (B) High-resolution TEM lattice image of the square region in single truncated Pt nanocubes. The d-spacing between the fringes was ~0.20 nm, which was identified {200} plane of Pt………127 Figure 9-5 Shows the SEM images of Pt nanostructures formed by immersing FS samples into aqueous solutions of H2SO4- H2PtCl6 for 20 min at NTP (stirring time = 5 h). The
images clearly show the presence of Pt nanocrystals with cube and rod shapes. The mechanism of rod growth is Ostwald ripening, define as the dissolution of the fine
particles and their redeposition on large particles [198]. According to the well-known Gibbs–Thomson law, there is energy difference between large particles and small particles result in vanishing of smaller particles and formation of longer nanorods with the reaction in progress [199] ………128 Figure 9-6 FFT image obtained from fig. 3E. The FFT pattern exhibits only a diffraction spots,
revealing a good single-crystal property……….….….….….….………128 Figure 9-7 SAED image obtained from fig. 9-5 (A). SAED pattern also confirms the single crystal structure of the truncated Pt nanocubes……….….….….….….129 Figure 9-8 shows the SEM images of perfect Pt nanocubes deposited on the FS sample at NTP for (A) 10, (B) 13, and (C) 15 min; (solution stirring for 5 hr) ………130 Figure 9-9 shows the typical XPS survey spectrum of perfect Pt nanocubes deposited on the surface of FS sample. XPS clearly show the presence of Pt nanocube catalyst………130 Figure 9-10 XPS deconvoluted Pt(4f) doublet of perfect Pt nanocubes deposited on the
surface of FS sample. The peaks can be attributed to Pt(4f7/2) and Pt(4f5/2) of
metallic Pt, respectively………131 Figure 9-11 Cl(2p) XPS narrow scan spectra of the perfect Pt nanocubes deposited on the
surface of FS sample. This figure clearly shows the complete absence of chloride ion at the perfect Pt nanocubes………132 Figure 9-12 (A) High-resolution TEM image of individual perfect Pt nanocube. The d-spacing between the fringes was ~0.20 nm, which was identified {200} plane of Pt; the inset shows the FFT of the lattice image gives the optical diffractogram, which clearly shows the presence of {200} plane and (B) Corresponding SAED pattern, showing the single crystal structure of the perfect Pt nanocubes………133 Figure 9-13 Plane views SEM images of the silicon after electroless deposition of Pt for 6 h. Compositions of solutions were (A) 2 M H2PtCl6 + 1 M H2SO4 + 1 HCl and (B) 2
M H2PtCl6 + 1 M H2SO4. Both the aqueous solution was stirred continuously for
5 h………134 Figure 9-14 (A) FE-SEM image of the electrodeposited polycrystalline Pt nanosphere on
sphere, showing that the surfaces are covered by Pt nanoparticles of a few nanometers in size, and the Pt nanocrystallites dominated by {111}-type exposed surface. (C) SAED pattern showing that the formed nanoparticles are polycrystalline. The as-labelled diffraction rings 1–4 correspond to {111}, {200}, {220}, and {311} reflections, respectively, all of which reveal the fcc crystal structure………137 Figure 9-15 Comparison of catalytic activity and stability of the Pt nanoshapes. (A) and (B) Cyclic voltammograms for (a) perfect Pt nanocubes, (b) truncated Pt nanocubes, (c) truncated Pt (cubes + tetrahedron), and (d) spherical Pt nanoparticles were obtained at a scan rate 25 mVs-1 in 1 M H2SO4 + 1 M methanol and 1 M H2SO4 +
1 M ethanol respectively. (C) and (D) Chronoamperometric curves for (a) perfect Pt nanocubes, (b) truncated Pt nanocubes, (c) truncated Pt (cubes + tetrahedron), and (d) spherical Pt nanoparticles were recorded at 0.40 V in oxygen free 1 M H2SO4 + 1 M methanol and 1 M H2SO4 + 1 M ethanol, respectively. The results
demonstrate that the perfect Pt nanocube electrode showed excellent catalytic activity and stability for oxidation of methanol and ethanol………138
Chapter 1
Introduction
1.1 Background
One of the great challenges in the 21st century is unquestionably electrochemical energy conversion. In response to the needs of modern society and emerging ecological concerns, it is highly desirable to find new, low-cost and environmentally friendly electrochemical energy conversion for powering an increasingly diverse range of applications, ranging from portable power for consumer electronics to potential transport applications [1-2]. This allowed for rapid research in electrochemical energy conversion devices such as polymer electrolyte membrane fuel cells (PEMFCs), direct methanol fuel cells (DMFCs), and direct ethanol fuel cells (DEFCs). As the performance of these devices depends intimately on the properties of their materials, considerable attention has been given to the research and development of key materials [2-7]. Micrometer sized bulk materials are reaching their inherent limits in performance and cannot fully satisfy the increasing desires of consumer devices. Therefore, rapid development of new materials with high performance is essential. Nanostructured materials are becoming increasingly important in the development of electrochemical energy conversion devices and hence have attracted great interest in recent years. A variety of nanometer size effects have been found in the materials used in electrochemical energy conversion, which can be divided into two types: (i) ‘trivial size effects’, which rely solely on the increased surface-to volume ratio and (ii) ‘true size effects’, which also involve changes of local materials properties [7]. Many approaches are used to accomplish nanostructures for DMFC applications. One approach to the synthesis of nanostructured materials has centered on the replication of nanostructured silica templates followed by template removal. Various lengths and shapes of monometallic nanowires templated by various silica structures have been reported [8–10]. Bimetallic structures templated by nanostructured silica have also been
reported which include Pt–Rh and Pt–Pd nanowires [11]. The synthesis of nanostructured Pt– Ru electrocatalysts includes the synthesis of a bimetallic Pt–Ru nanowire network templated by mesoporous silica, specifically SBA-15 [12]. The SBA-15 silica template is synthesized separately and is then immersed in a solution of Pt and Ru precursors. This infiltration procedure has to be repeated numerous times, usually about ten, before full pore infiltration can be accomplished [12]. Following this approach, a significant increase in the electrocatalytic current was found when compared to a commercial Pt–Ru black. Impregnation synthesis of a bimetallic network in mesoporous silica presents an interesting material design approach, although it is limited in application due to its complexity, parameter variability and time-consuming synthesis. Alternative approach that utilizes the advantages of anodic aluminum oxide (AAO) templates for the synthesis of Pt and Pt alloy catalysts nanostructured materials [13, 14]. A mesoporous platinum film was prepared by electrodeposition of Pt into a liquid crystal surfactant template [15-18]. With this method it is easy to control the size of the porous structures, but it is difficult and time-consuming to implement and to scale up the liquid crystal template techniques. Other promising areas of nanostructure development are in microemulsions [19], lyotropic liquid crystalline phases [20], microwave irradiation [21], sonochemistry [22, 23], electrochemical deposition [24], and sol-gel processing [25]. Recent work has been done by Liang et al. [3] to make hollow nanospheres of Pt by a redox replacement reaction from Co nanosphere precursors. Additionally, Jiang and Kucernak [26] reported high surface area mesoporous microspheres of Pt/Ru by electrocoreduction of the two precursor salts within a surfactant template. These works are only a fraction of the entire effort in this field, and it is expected that such routes will bridge the gap to the discovery of new materials.
1.2 Motivation
Recently, substantial attention has been paid to the development of fuel cells with solid polymeric electrolytes that operate on liquid fuel, in particular, methanol, in which methanol directly oxidizes on the anode, i.e. the so-called direct methanol fuel cells (DMFCs). Although the technology of such fuel cells was developed to an extent, some fundamental problems remain unclear and only their solution can result in wide-scale commercialization of DMFC, especially as the efficient current sources for portable devices. The most important problem is the development of efficient catalysts, which would provide the long-term (for several thousand hours) operation of fuel cells without sacrificing their characteristics. However, their sluggish electrochemical reactions result in inevitable high Pt-catalyst loading and low catalyst utilization, in addition to the well-known methanol crossover problem. It is essential to improve Pt-catalyst utilization in DMFCs, because the high cost of Pt-based catalyst understandably dominates the material cost of membrane electrode assembly (MEA) for low temperature fuel cells. There are two way to overcome this problem. First, the synthesis of ordered nanostructure materials with high surface area as a supports of Pt or Pt alloy catalysts. Secondly, direct synthesis of nanostructure materials (Pt or Pt alloy catalysts) with high surface area. Moreover, an appropriate synthetic route ultimately determines the success or failure of nanostructured materials synthesis, because the physical properties and applications of nanostructured materials are heavily dependent upon their synthetic method. As a result, there have been tremendous efforts toward the development of new synthetic methodologies for several decades.
In this study, we have proposed very simple methods for fabrication and synthesis of nanostructured materials for supporting nanoparticles Pt or Pt alloy catalysts. Well-ordered arrays of Si nanocones (SNCs) were fabricated using the combination of anodic aluminum oxide (AAO) templating and dry etching techniques. The self-organized nanodot array of
titanium oxide (TiOX) in use is prepared from TiN/Al film on the silicon substrate by
electrochemical anodization. This novel method can not only reveal highly ordered nanostructures but also overcome lithography limitation. TiOX nanodots were then used as
nanomasks to etch TiN layers and the underlying layers in an inductively coupled plasma reactive ion etch (ICP-RIE) system. The ICP-RIE is a plasma-based dry etching technique characterized by a combination of physical sputtering and chemical activity of reactive species. Owing to the well-controlled etching depth and profile for nanostructures, TiOx
nanodots were used as nanomasks to fabricate well ordered SNC arrays. Then Pt nanoparticles were electrochemically deposited on the SNCs for fuel cell electrode. An amorphous carbon coated Si nanocones (ACNCs) were used to obtain well-dispersed Pt nanoparticles with high mass activity, where bipolar pulse electrodeposition was used to deposit Pt nanoparticles.
In order to increase the performance of DMFCs electrode, we synthesized the graphitic carbon (g-C) with a high surface area on the Si substrate and thus were used as a support of Pt and Pt-Ru alloy catalysts.
We have also developed new simple and efficient techniques for direct synthesis of Pt nanostructures. In this regards, we have synthesized the two-dimensional (2D) continuous Pt island networks and three-dimensional (3D) Pt nanoflowers for DMFCs electrodes. In addition, we have synthesized the shape-controlled Pt nanoparticles by fasten silicon and study there electrochemical performance for DMFCs application.
Chapter 2
Literature Review
2.1 Fuel cells
2.1.1 Introduction
The first fuel cell was demonstrated by Sir William Grove in 1839. Namely, a fuel cell is an electrochemical cell that directly converts chemical energy into electric energy. Hence, a fuel cell is a converter which enables the energy conversion via the electrochemical reaction, like the well-known electrochemical batteries. However, fuel cells are unique in that they consume reactants, which must be replenished, while batteries store electrical energy chemically in a closed system. Additionally, while the electrodes within a battery react and change as a battery is charged or discharged, a fuel cell's electrodes are catalytic and relatively stable. But its commercialization has been limited by high cost, material limitations, and low operational efficiencies. The first successful application of a fuel cell was demonstrated by NASA in the Gemini and Apollo space programs as a way to deliver potable water to the astronaut crew [27]. Today research has focused on developing fuel cells for stationary, automotive, portable, and military power applications. Fuel cells are attractive because they provide an innovative alternative to current power sources with higher efficiencies, renewable fuels, and a lower environmental cost.
2.1.2 Principles of fuel cells
A schematic representation of a various types of fuel cells is shown in Fig. 2-1. The main active components of a fuel cell are fuel electrode (anode), oxidant electrode (cathode), and electrolyte sandwiched between them. Figure 2-1 shows the basic operational principle of a fuel cell with the reactant/product gases and the ion conduction flow directions. In a typical
fuel cell, fuels are fed continuously to the anode (negative electrode) and an oxidant (i.e., pure oxygen or air) is fed continuously to the cathode (positive electrode); the electrochemical. Reactions take place at the electrodes. The fuel is oxidized at the anode to gives up electrons which travel through the external load to provide the power while ions migrate through the electrolyte from one electrode to the other. On the cathode, the oxidant combines with the ions and incoming electrons by a reduction reaction to complete the process. Usually, the basic physical structure of an electrode consists of an electrolyte layer in contact with a porous anode and cathode on each side. Triple phase boundaries are established among the reactants, electrolyte, and catalyst in the region of the porous electrode. The nature of this interface plays a critical role in the electrochemical performance of a fuel cell, particularly in those fuel cells with liquid electrolytes. In such fuel cells, the reactant gases diffuse through a thin electrolyte film that wets portions of the porous electrode and react electrochemically on their respective electrode surface. In order to maximize the efficiency of fuel cell, a delicate balance must be maintained among the electrode, electrolyte, and gaseous phases in the porous electrode structure. The electrolyte in fuel cell not only transports dissolved reactants to the electrode, but also conducts ionic charge between the electrodes and thereby completes the cell electric circuit. In addition, it also provides a physical barrier to prevent the fuel and oxidant gas streams from directly mixing.
The simplest and most common reaction encountered fuel cell reaction is:
H2 + ½ O2 → H2O (2.1)
From a thermodynamic point of view, the maximum-electric work obtained from the above reaction corresponds to the free-energy change (available energy in an isothermal process) of the reaction. Gibbs-free energy is more useful than the change in Helmholtz-free energy, since it is more practical to carry out chemical reactions at a constant temperature and pressure rather than constant temperature and volume.
energy of the products is less than that of the reactants. The standard free energy change of the fuel cell reaction is represented by the equation:
ΔG = ─ nFEr (2.2)
where ∆G is the free energy change, n is the number of moles of electrons involved, Er is the
reversible potential, and F is Faraday’s constant. If the reactants and the products are in their standard states i.e., at a temperature of 25○C and 1 atm pressure, the equation can be rewritten as:
∆G = ─ nFE○r (2.3)
Accordingly, the reversible cell voltage (E○r) of a fuel cell can be calculated from:
E○r = ─∆G○/nF (2.4)
For the reaction (2.1), ∆G○ is –229 kJ/mol, n = 2, F = 96,500 C/eq and, hence, the calculated value of E○r is ~1.29 V.
Water is the product of the fuel cell reaction and can be produced either as liquid water or steam. The higher-heating value (HHV) corresponds to the released heat when water is produced as liquid water and the lower-heating value (LHV) when water is produced as steam. The difference in the HHV and LHV is the heat required to vaporize the product water.
2.1.3 Types of fuel cells
There are a number of different fuel cells being investigated, which are classified based on the electrolyte used. Each type of fuel cell has intended applications based on power output limitations, operating temperature, and size of the power system. There are presently five major fuel cell types at varying stages of development and commercialization: (1) alkaline fuel cell (AFC), (2) phosphoric acid fuel cell (PAFC), (3) solid oxide fuel cells (SOFC), (4) molten carbonate fuel cells (MCFC), and (5) polymer electrolyte membrane fuel cells (PEMFC). Figure 2-1 shows the operational characteristics of each fuel cell family. A brief
description of different electrolyte cells is as follows.
[1] Alkaline fuel cell (AFC)
The AFCs typically utilize KOH as the electrolyte with the concentration of 35-50 wt% and have the highest electrical efficiency of all fuel cells but suffer economically from the necessity for ultra pure gases for its fuel. The electrolyte is retained in a matrix (usually asbestos), and a wide spectrum of electrocatalysts can be used (e.g., Ni, Ag, metal oxides, spinals, and noble metals). The operating temperature for AFCs is below 100○C, but higher temperatures are desirable for improved hydrogen oxidation kinetics. Furthermore, the AFCs are among the first fuel cells to have been studied and taken into development for practical applications, and they are the first type of fuel cells to have reached successful routine applications, mainly in space programs such as space shuttle missions. However, almost all of the AFC development activities have come to an end now.
The major challenge is that alkaline electrolytes, like potassium or sodium hydroxide, do not reject carbon dioxide, even the 300-350 ppm of carbon dioxide in atmospheric air is not tolerated, whereas terrestrial applications almost invariably require the use of atmospheric air as oxidant due to technical and economic considerations. The expected power output of an AFC is in the range of tens of MW [27].
[2] Phosphoric acid fuel cell (PAFC)
The PAFCs are commercially the most advanced system due to simple construction and the thermal and chemical stability of the phosphoric acid electrolyte at an operating temperature in the range of 150-200○C. Phosphoric acid concentrated up to 100% is used as the electrolyte in PAFC. The matrix universally used to retain the acid is silicon carbide, and the electrocatalyst in both the anode and cathode is the platinum catalyst. The stability of concentrated phosphoric acid is relatively high compared to other common acids; consequently, PAFC is capable of operating at the high end of the temperature range (100 to 220○C) among the acid-type fuel cells. It is mainly used for stationary power ranging from dispersed power to on-site generation plants. Power outputs of 0.2-20 MW are able to supply shopping malls and hospitals with electricity, heat and hot water and are commonly used as primary or backup power for these sites [27].There are several disadvantages associated with the PAFC design. These include the need to use the expensive noble metal, platinum, as electrodes. Furthermore the electrodes are susceptible to CO poisoning and the electrolyte in the fuel cells is a corrosive liquid which, is consumed during operation [28].
[3] Solid Oxide Fuel Cell (SOFC)
The electrolyte in this fuel cell is a solid, nonporous metal oxide, usually Y2O3- stabilized
ZrO2. The fuel cell operates at 800-1000○C where ionic conduction by oxygen ions takes
noble-metal catalysts. Typically, the anode is Co-ZrO2 or Ni-ZrO2 cermet, and the cathode is
Sr-doped LaMnO3. The fuel may be gaseous hydrogen, H2/CO mixture, or hydrocarbons
because internal in-situ reforming of hydrocarbons with water vapor can occur at high temperatures.
The SOFC has been investigated for applications ranging from industrial and home generators, telecommunication systems, and in hybrid electric vehicles. The SOFC provides high-quality waste heat that can be utilized for cogeneration applications or combined cycle operation for additional electric power generation. The operating condition of SOFC is also compatible with the coal gasification process, which makes the systems highly efficient when using coal as the primary fuel. It has been estimated that the chemical to electrical energy conversion efficiency is 50–60%, even though some estimates go as high as 70%–80%. Also, nitrogen oxides are not produced, and the amount of carbon dioxide released per kWh is around 50% less than for power sources based on combustion because of the high efficiency. There are several advantages to using SOFC systems for practical power generation as compared with the other types of fuel cell. SOFCs have a solid electrolyte, which eliminates the corrosion and liquid management problems of the PAFCs [27].
[4] Molten carbonate fuel cell (MCFC)
The MCFCs uses liquid lithium potassium or lithium sodium carbonate stabilized in a matrix as the electrolyte for the system, which is supported on Al2O3 fibers for mechanical
strength. The fuel cell operates at 600 to 800○C where the alkali carbonates form a highly conductive molten salt, with carbonate ions providing ionic conduction. At the high operating temperatures in MCFCs, Ni (anode) and nickel oxide (cathode) can promote reaction; therefore, noble metals are not required.
MCFCs are aimed at stationary application such as the distributed power plants for industrial and commercial applications. The MCFCs system can attain efficiencies of up to
50 %, or up to 70 % with the combination with other power generators. MCFCs can operate on a wide range of different fuels and are not prone to CO or CO2 contamination, as is the
case for low temperature cells.
[5] Polymer electrolyte membrane fuel cell (PEMFC)
The PEMFCs uses a proton-conducting polymer membrane as the electrolyte at an operating temperature of 80-105○C. The most commonly used reactants for this system are hydrogen and methanol. Due to its low operating temperature, hydrogen and methanol fuel cells are popular for use in automotive and portable electronic applications. The standard membrane is a perfluorinated sulfonic acid membrane developed by DuPont and trademarked as Nafion®. The platinum catalyst is widely employed as the catalyst in both the anode and cathode electrode.
Moreover, the PEMFC has fast-start capability and yields the highest output power density among all types of the fuel cells. Because of the solid membrane as the electrolyte, there is no corrosive fluid spillage hazard, and there is lower sensitivity to orientation. It has no volatile electrolyte and has minimal corrosion concerns. It has truly zero pollutant emissions with potable liquid product water when hydrogen is used as fuel. As a result, the PEMFC is particularly suited for vehicular power applications, although it is also being considered for stationary power applications to a lesser degree [29]. The fuel – gas hydrogen can be produced by steam reforming or partial oxidation of hydrocarbons; however, reforming these fuels produces impurities such as carbon monoxide, to which the Pt-based electro-catalyst have very low tolerance. Even a trace amount of CO drastically reduces the performance levels, although CO poisoning effect is reversible and does not cause permanent damages to the PEMFC system [30]. Furthermore, the performance reduction due to CO poisoning takes a long time (on the order of two hours) to reach steady state. This transient effect may have profound implication for transportation applications. Therefore, the PEMFC
requires the use of a fuel virtually free of CO (must be less than a few ppm). Purifying the fuel stream through a water gas shift reaction and preferential oxidation adds both extra equipments and costs to a fuel cell system. Therefore, a fuel cell researcher’s dream is to directly electrooxidize an organic fuel, rather than process it to hydrogen. Methanol is one alternative because it is a common, widely used and inexpensive substance that can be easily achieved from natural gas. Methanol offers other advantages over gas hydrogen, including liquid state at room temperature, ease to fuel-feeding, distribute and store. Hence, direct methanol fuel cell (DMFC) can be regarded as a subcategory of PEMFC, in which liquid methanol is directly converted into the electrical energy without the further use of reformer. In this thesis we shall focus our attention on the DMFCs and described in more detail below.
2.2 Direct methanol fuel cell (DMFCs)
2.2.1 Introduction
DMFCs using polymer electrolyte membranes are promising candidates for transportation applications and portable power sources such as replacing batteries. By eliminating reformer, DMFC offer simple system design and potentially higher overall efficiency than the reformate-fed fuel cells. Significant advances in H2/air polymer electrolyte fuel cells have
been reported including the low electrocatalyst consumption and high power density. However, fuel processor-fuel cell stack system on board the vehicle presents problems of packaging, complexity, and an overall system efficiency significantly lower than that of the fuel cell itself. Moreover, methanol is the liquid fuel that has substantial electroactivity and can be directly oxidized to CO2 and water on catalytically active anodes in DMFC. In addition
to high efficiency and environmental compatibility, liquid methanol is inexpensive, widely available and can be handled and distributed to consumers to such an extent that the present supply networks of gasoline can be used for methanol without difficulty. There are several
conditions, which fuel cells must meet in order to become a real alternative to the internal combustion engines. One of the most important requirements is system size, because of the need to generate sufficient power within limited space on car board. This requirement is not met by liquid electrolyte fuel cells as they have considerably lower power density than solid electrolyte fuel cells. Highly efficient molten carbonate and solid oxide electrolytes, operating at temperatures in the range 700 to 1000○
C require extended, power consuming periods to reach working temperature. Therefore, they cannot start rapidly and respond quickly to the change in power demand of the particular vehicle. Using a gaseous fuel (commonly hydrogen) is not suitable for small light duty electric cars due to difficulties with fuel distribution and safe handling, and on-vehicle space and weight constraints. Currently methanol and also other organic fuels are steam reformed to hydrogen rich gas before entry into the anode area of a cell. This fuel feed usually contains traces of carbon monoxide, which acts as catalyst poison and needs to be purified. Purification of the fuel feed with water gas shift reaction will reduce the overall system efficiency and increase the weight, volume and start-up time of the device. From the point of view of system simplicity and convenience in operation the direct methanol fuel cell where methanol fuel is supplied directly to the anode is a most attractive technological solution for automotive application. The specific advantages in comparison to other fuel cell types such as high energy efficiency (weight and volume) stationary electrolyte, hence no corrosive liquids, self starting at ambient temperature, long-term experience, up to several 10000 h, stability, etc. make the PEM-DMFC the most promising transportation power source.
2.2.2 Principle of DMFC operation
A schematic drawing of a DMFC is given in Fig. 2-2, which demonstrates the principle of operation of a DMFC. The DMFC works by oxidizing the liquid methanol to CO2 and water.
This eliminates the need for an external hydrogen supply. A proton conducting solid membrane, used both as electrolyte and separator between anode and cathode, is sandwiched between porous structures (i.e. carbon). The latter serve as current collectors and at the same time as a support for catalyst particles. Before catalyst deposition the current collectors are impregnated with polymer electrolyte to provide the intimate contact of the metal particles both with electron and proton conductors. At the anode a methanol molecule reacts with a water molecule liberating CO2, six protons which are free to migrate through the electrolyte
towards cathode, and six electrons which can pass through the external load. The CO2
produced in the reaction is rejected by the acid electrolyte.
Figure 2-2 Schematic diagram of the DMFCs.
The protons, migrating through electrolyte and electrons, moving via external loaded circuit, have to reach a particle of catalyst on the cathode, where oxygen is electro-catalytically reduced producing water. The water produced is removed by the oxygen flowing through the cathode compartment. An electric potential appears between the electrodes because of the excess of electrons at the anode (where they are generated) compared with the
cathode (where they are consumed). It is this potential difference that drives current through the external load, making fuel cell a real source of power. The maximum voltage attainable from the overall reaction in the methanol-air fuel cell in theory is ~1.21 V with a theoretical efficiency of 96.5%, but in practice it is not achieved due to the poor electrode kinetics and ohmic losses the electrolyte.
The relevant electrochemical reactions at the electrode are:
Anode reaction: CH3OH + H2O → CO2 + 6H+ + 6e- E0 = 0.02 V (2.5)
Cathode reaction: 3/2 O2 + 6H+ + 6e- → 3H2O E0 = 1.23 V (2.6)
Overall reaction: CH3OH + 3/2O2 → CO2 + 2H2O E0 = 1.21 V (2.7)
2.2.3 DMFC Anode
The electrooxidation of methanol requires the presence of Pt-based catalysts. Pt is involved in the two key steps occurring during oxidation route. One is the dehydrogenation step and the second is the chemisorption of CO. The methanol electrooxidation reaction is a slow process and it involves the transfer of six electrons to the electrode for complete oxidation to carbon dioxide. Various reaction intermediates may be formed during methanol oxidation. Some of CO-like species are irreversibly adsorbed on the surface of the electrocatalyst and severely poison Pt for the occurance of the overall reaction, which has the effect of significantly reducing the fuel consumption efficiency and the power density of fuel cell. Thus it is very important to develop new electrocatalysts to inhibit the poisoning and significantly increase the rate of electro-oxidation by at least a factor of two to three times. Until now Pt is proved to be the only effective anode catalyst for DMFC. The research in methanol electrooxidation using Pt anode reached important breakthroughs during the last 15 years. The most significant issue in the development of useful low-cost high efficiency methanol fuel cells for generating electric current is the poisoning of the platinum anode by
carbon monoxide that is generated during the oxidation. Carbon monoxide molecules formed from the early steps of methanol oxidation adsorb on and block polycrystalline platinum electrode surfaces and are not oxidized away by the reaction with water to make carbon dioxide unless the anode potential is increased to about 0.6 V (SHE). The net result of doing this is an unacceptable loss of cell voltage and efficiency. It has been found that carbon monoxide can be oxidized at a lower potential by adding oxygen to the system, but the gain in the cell voltage is not large. Furthermore, there is a loss of power because no current is generated when carbon monoxide is oxidized by oxygen on the anode surface whereas, on the other hand, oxidation of carbon monoxide by water yields two electrons and two protons and the COads poison that forms is oxidized by water
COads + H2O → CO2 + 2H+ + 2e- (2.8)
It was proposed that reaction (2-8) proceeds by direct attack by a H2O molecule on the
adsorbed CO [31]. A molecular orbital study on Pt(111) suggested that for this to occur the H2O molecule would not need to be adsorbed on the surface [32]. Results of the kinetic
isotope study were consistent with the formation of an activated complex of H2O and COads
for which deprotonation was not rate limiting [33]. The involvement of OHads, formed from
H2O decomposition on electrode surfaces in oxidizing organic fuels was proposed four
decades ago [34]. Its formation was advanced as the rate-determining step for the electrooxidation process.
Studies involving partial substitution of Pt with other transition metals like W, Pd, Ni, Ti, Rh, Mo have not yielded fruitful results [35]. Accordingly, most work has addressed to the modification of the Pt environment by alloying it with other elements or through the synthesis of multifunctional electrocatalyst. Until now the most successful results have been obtained through the alloying route. Thus the electrocatalyst activity of the new material for anodic oxidation of methanol is ambiguous. The mechanism of oxidation of methanol is discussed in section 2.3.
2.2.4 DMFC Cathode
In the direct methanol fuel cell the oxygen is reduced at the cathode, and so the electrode configuration is the same as that of H2/O2 fuel cell because of the same cathodic reaction. So,
most of the cathodes developed originally for H2/O2 fuel cells are used in DMFC, which is Pt
supported on carbon. In direct methanol fuel cell using polymer electrolyte membrane, there is a serious problem of methanol crossover from the anode region to cathode region, which causes a decrease in cathode performance leading to a loss in overall fuel cell efficiency. Not much is known about the chemical and electrochemical processes which methanol is undergoing at the cathode of an operating DMFC. Wang et al. [36] found that methanol is oxidized to carbon dioxide by oxygen in the presence of platinum, which inhibits the oxygen reduction reaction and results in lower cathode potential (depolarization). Keeping in mind that the highest cathode potential is 1V in practice, this kind of loss is certainly a serious problem that needs to be resolved. Some work is being done to develop methanol tolerant catalyst (cathode), however, even if the cathode depolarization is resolved, the methanol crossover is still an issue of considerable significance, which results in a decrease in fuel cell efficiency. From a practical point of view it should be important to stop this methanol crossover through the membrane. Beside the methanol crossover, a general problem related with Pt cathode still exists. The equilibrium potential for oxygen gas reduction to water according to equation 2 is 1.23 V (RHE) at 25○
C. In practice the cathode potential on Pt/C electrode does not exceed 1 V. The main reason for this voltage loss is the formation of an oxide film (OHads) and the presence of strong water dipole, which interacts with positively
charged metal surface. It is concluded that the neutral oxygen molecules are unable to displace the water dipoles from the surface when the potential is above 1 V. Consequently, the oxygen molecules are unable to exert their maximum thermodynamic potential in Pt electrode
system.
2.3 Mechanism of methanol oxidation
The basic mechanism for methanol oxidation was reviewed in 1988 [37], and can be summarized in terms of two basic functionalities [38]:
(a) Electrosorption of methanol onto the substrate.
(b) Addition of oxygen to adsorbed carbon-containing intermediates to generate CO2.
Very few electrode materials are capable of adsorption of methanol; in acid solution only platinum and platinum-based catalysts have been found both to show sensible activity and stability, and almost all mechanistic studies have concentrated on these materials. On platinum itself, adsorption of methanol is now believed to take place through a sequence of steps as: CH3OH + Pt(s) → Pt-CH2OH + H+ + e- (2.9) Pt-CH2OH + Pt(s) → Pt2-CHOH + H+ + e- (2.10) Pt2CHOH + Pt(s) → Pt3-COH + H+ + e- (2.11) Pt3COH → Pt-CO + 2Pt(s) + H+ + e- (2.12) Pt(s) + H2O → Pt-OH + H+ + e- (2.13)
PtOH + Pt-CO → Pt-COOH (2.14)
Or
Pt-CO + H2O + Pt-COOH + H+ + e- (2.15)
Pt-COOH + Pt(s) + CO2H+ + e- (2.16)
Additional reactions that have also been suggested include:
Pt-CH2OH → Pt(s) + HCHO + H+ + e- (2.17)
Pt2CHOH+Pt-OH → 3Pt(s) + HCOOH + H+ + e- (2.18)
Pt2CHOH + H2O → 2Pt(s) + HCOOH + 2H+ + e- (2.19)
Pt3C-OH + Pt - OH→ 3Pt(s) + Pt-COOH +H+ + e- (2.20)
Or
Pt3C-OH + H2O → 2Pt(s) + Pt-COOH +2H+ + 2e- (2.21)
Reactions (2.9, 2.12) are electrosorption processes, whereas subsequent reactions involve oxygen transfer or oxidation of surface bonded intermediates. Considerable controversy surrounds the relative rates of the above processes and the identity of the dominant species on the surface.
2.4 Features
DMFCs possess a wide spectrum of advantages as compared with PEMFCs that use hydrogen as the fuel. The theoretical energy conversion efficiency of all DMFCs exceeds 90%, which is higher than that of PEMFCs (83%). More importantly, liquid methanol has a much higher volumetric energy density than does gas hydrogen. Hence, DMFCs require much smaller fuel cartridges and they are thus much more compact systems. In addition, methanol is easily handled, the small size, low working temperature, easy fuel-feeding, transported and stored. Unlike hydrogen-feed PEMFCs, liquid fuel-feed DMFCs do not need humidification and separate thermal management ancillary systems. All these features make DMFCs particularly suitable for portable and mobile applications [35].
2.5 Challenges
Currently there are some obstacles which need to be overcome before large scale commercialization of DMFC: (a) the high cost of Nafion membrane in the range of US$ 800-2000/ m2; (b) the reduction of oxygen on cathode is also low though the problems are not so serious as with aqueous mineral acid electrolytes; (c) the permeability of the current
perfluorosulfonic acid membranes (Nafion) to methanol, which allow considerable crossover of methanol from anode region to cathode region. This leads both to degradation of performance, since mixed potential develops at the cathode, and to deterioration of fuel utilization. Methanol vapor also appears in the cathode exhaust, from which it would have to be removed. (d) and perhaps of greatest concern at the moment is the low activity and high cost of anode electrocatalyst, the anode reaction has poor electrode kinetics, particularly at lower temperatures, making it highly desirable to identify improved catalysts and to work at as high a temperature as possible. With regard to new DMFC anode catalysts, there are two major challenges, namely, the performance, including activity, reliability and durability, and cost reduction.
2.6 Anode catalysts of DMFC
For DMFC anode catalyst performance improvement, the exploration of new catalyst materials including noble and non-noble metals is necessary. In this respect, an alloying strategy is one of the R&D directions. With the help of fast activity screening, a breakthrough could be accelerated to meet the requirements for DMFC commercialization. The other is a support strategy. Rapid development of nanotechnology, especially in the area of the synthesis of carbon nanostructured materials, will create more stable and active supported catalysts. Nanoparticle supported catalysts are believed to be the most promising materials for catalysis in DMFCs. In recent years, significant progresses have been made to improve the performance of DMFCs. And the research activities are mainly focused on the development of the materials including the electrocatalysts and the electrolyte membranes, which are important in DMFC.
Regarding cost reduction, for early DMFC commercialization, DMFC anode catalyst loadings must drop to a level of <1.0 mg cm−2 from the present 2.0–8.0 mg cm−2, depending
![Figure 2-4 The simple template-free electrochemical lithiation synthesis of nanoporous structures [48]](https://thumb-ap.123doks.com/thumbv2/9libinfo/8411028.179843/47.892.124.794.357.727/figure-simple-template-electrochemical-lithiation-synthesis-nanoporous-structures.webp)