光纖傳輸即時監控系統中受激拉曼散射效應與寬頻掺鉺光纖光源之研究
119
0
0
全文
(2) ♁ 國立中山大學 光電工程研究所 博士論文. 光纖傳輸即時監控系統中受激拉曼散射效應與寬頻掺鉺光 纖光源之研究. Study of SRS Effect in On-Line Monitoring Fiber Transmission Systems and Broadband Erbium-Doped Fiber Sources. 研究生:蔡賜琦 撰 指導教授:陳永光 教授. 中華民國九十二年六月.
(3) 誌. 謝. (Acknowledgments) 本論文得以順利完成付梓,承蒙指導教授--陳永光教授這些年 來的悉心指導與啟發,引導我在這段期間學習到豐富的實驗經驗與 如何去思考問題,及平日在生活上的關懷與照顧,由衷致謝! 此外,感謝中山大學光電所張道源教授、鄭木海教授、黃升龍 教授、朱安國教授、賴聰賢教授、張弘文教授及所上諸位老師和助 理人員在我研究所求學期間的教導與協助。 求學期間,得到許多人的幫助,感謝梁財春教授與張嘉雄學長 於實驗過程中之指導,同學許仕及學弟妹們如李建木、莊閔旭、黃 名宏、蔡昕澤、蘇鈴惠、洪詩蕾、湯家鴻、蔡宗鑑、糜漢萍、陳建 村等的協助。另外,也特別感謝台中高工控制科的同事們,在這期 間的鼓勵與支持,以及所有關心與照顧我的朋友們,在此一併致予 誠摯之謝意。 最後,將此論文獻給我最敬愛的父母親及我的太太及兩個女 兒,在這期間的生活及精神上給予關懷與鼓勵,讓我能專心完成博 士學業,特以本文表達由衷的感恩之情。. iv.
(4) 中文摘要 本 論 文 分 兩 部 分 , 第 一 部 分 為 光 時 域 反 射 儀 (Optical Time Domain Reflectometry, OTDR)即時監控光纖傳輸系統中受激拉曼散射(Stimulated Raman Scattering, SRS)效應的探討。我們在使用 1.65 µm OTDR 即時監控 1.55µm 調幅 殘旁波帶調變有線電視光纖傳輸系統中,證實了 1.65 µm OTDR 光脈波會與 1.55µm 光載波頻道產生 SRS 非線性效應並造成電視影像有微弱的水平細條紋 的失真。同時,也證實若改採用 1.31 µm OTDR 即時監控該系統則可消除 SRS 非線性效應所產生的影像失真。另外,我們各別使用 1.31 及 1.625 µm OTDR 即時監控前向及後向泵激架構之 1.55µm 分佈式光纖拉曼放大器(Fiber Raman Amplifier, FRA)傳輸系統也發現並證實 OTDR 監測軌跡會因 OTDR 光脈波與 FRA 的泵激光源產生 SRS 效應而使 OTDR 監測軌跡失真造成對系統的即時監控 能力之不可行性。 第二部分旨在研究產生長波段(L-band, 1570~1610 nm)及包含傳統與長波段 (C+L band, 1520~1610 nm)掺鉺光纖放大自發性輻射寬頻光源技術。我們證實了 在單一 1480 nm 泵激光源的架構中,僅有前向復行架構(double-pass forward pumping scheme, DPF)可以產生足以應用的 L-band ASE 光源。另外我們也提出 兩 種 使 用 1480nm 雙 泵 激 光 源 的 架 構 分 別 為 雙 向 復 行 架 構 (double-pass bi-directional pumping scheme) 及 雙 前 向 復 行 架 構 (double-pass dual forward-pumping scheme)提高了 L-band ASE 光源輸出功率及泵激轉換效率。同 時,也發現適當地調整雙前向復架構的參數,如光纖長度、有效反射率及泵激 功率,可以產生包含傳統與長波段的平坦寬頻 ASE 光源。因此,這些掺鉺光纖 ASE 寬頻光源可應用在對元件的量測及作為頻譜分割技術之 DWDM 傳輸系統 中的光源。. v.
(5) ABSTRACT In the first part of this thesis, the stimulated Raman scattering (SRS) effect in optical time domain reflectometry (OTDR) on-line monitoring fiber transmission systems are investigated. We have investigated the distortion of baseband video picture arising from the 1.65 µm OTDR-induced SRS effect in 1.55 µm amplitude modulation with vestigial sideband (AM-VSB) cable television (CATV) transmission system. The baseband video-picture distortion in appearance with “faintly white horizontal thins lines” on the TV picture is observed. The baseband video-picture distortion disappearing is demonstrated in the 1.31 µm OTDR on-line monitoring 1.55 µm AM-VSB CATV transmission system due to almost bare of SRS interaction. Moreover, we have demonstrated the 1.625 µm and 1.31 µm OTDR on-line monitoring in forward- and backward-pumping distributed fiber Raman amplifier (FRA) transmission systems. However, the distorted OTDR traces due to the SRS effect are obtained regardless of forward or backward pumping scheme and these distortions give rise to an un-accurately measured fiber-loss coefficient and reflection profile along fiber link. In the second part of this thesis, we mainly investigate the techniques to generate L-band (1570-1610 nm) and broadband, including C-band (1520-1560 nm) and L-band, erbium-doped fiber (EDF) amplified spontaneous emission (ASE) light source. In 1480 nm single-pumped configurations, only the double-pass forward (DPF) pumping scheme can generate L-band ASE light source for applications. Furthermore, we also proposed the bi-directional pumping (FB) scheme and dual forward pumping (FF) schemes with two 1480 nm pumping lights to improve the L-band ASE output power and the pumping efficiency. Meanwhile, the broadband flat ASE light source, using dual forward pumping scheme, is also demonstrated by adjusting the parameters (e.g. fiber length, pump power, effective reflectance) in an appropriate amount. Such broadband, flat, high-power ASE source is essential for both C- and L-band dense wavelength division multiplexing (DWDM) device characterization and spectrum-sliced DWDM systems.. vi.
(6) List of Contents ACKNOWLEDGMENTS ........................................................................................ iv CHINESE ABSTRACT ........................................................................................... v ENGLISH ABSTRACT............................................................................................ vi LIST OF CONTENTS ............................................................................................. vii LIST OF TABLES...................................................................................................... x LIST OF FIGURES .................................................................................................. xi LIST OF ACRONYMS............................................................................................ xv. Part I Stimulated Raman Scattering (SRS) Effect in OTDR On-Line Monitoring Fiber Transmission Systems……….....1 Chapter 1. Introduction........................................................................................... 2. 1.1 Stimulated Raman Scattering (SRS).......................................................... 3 1.2 Review of Optical Time-Domain Reflectometer (OTDR) ........................ 4 1.3 The Dissertation Organization of Part I ................................................... 6 Chapter 2 SRS Effect in 1.65 µm OTDR On-Line Monitoring 1.55 µm AM-VSB CATV Transmission System........................................... 7 2.1 Experimental Setup.................................................................................... 7 2.2 Experimental Results ................................................................................. 8 2.3 Analysis of SRS-Induced Power Depletion and CNR Degradation .......... 9 2.4 Theoretical mode of the SRS-Interaction in the CATV System ...............11 2.5 Simulation Results and Discussions ........................................................ 13 2.6 Summary……………………………………………..………………… 15 vii.
(7) Chapter 3 SRS-Induced OTDR Distortion Traces in On-Line Monitoring 1.55 µm Fiber Raman Amplifier Transmission System...................... 17 3.1 Experimental Setup.................................................................................. 17 3.2 Experimental Results and Discussions .................................................... 19 3.3 Theoretical Analysis of SRS-Induced Distorted OTDR Traces............... 21 3.4 Simulation Results for SRS-Induced Distorted OTDR Traces................ 26 3.5 Summary.................................................................................................. 27. Part II Broadband Erbium-Doped Fiber Sources..................................29 Chapter 4. Introduction......................................................................................... 30. 4.1 Review of Fiber-Optic Gyroscpes ........................................................... 30 4.2 Review of Optical Low-Coherence Reflectometry ................................. 33 4.3 Review of Spectrum-Sliced System ........................................................ 34 4.4 Basic Concept and Characteristics of ASE Fiber Source ........................ 36 4.5 The Dissertation Organization of Part II.................................................. 39 Chapter 5 Single-Pumped L-band Erbium-Doped Fiber ASE Sources........... 40 5.1 Configurations and Experimental Setup .................................................. 40 5.2 Experimental Results and Characteristics Comparison ........................... 41 5.3 Summary.................................................................................................. 43 Chapter 6 High Pumping-Efficiency L-band Erbium-Doped Fiber ASE Source Using Double-Pass Bi-directional Pumping Configuration ................. 44 6.1 Experimental Setup.................................................................................. 44 6.2 Experimental Results and Discussions .................................................... 45. viii.
(8) 6.3 Summary.................................................................................................. 47 Chapter 7 High Power Flat L-Band Erbium-Doped Fiber ASE Source Using Dual Forward-Pumping Configuration ................................................. 48 7.1 Experimental Setup.................................................................................. 48 7.2 Experimental Results and Discussions .................................................... 49 7.3 Summary.................................................................................................. 51 Chapter 8 High Pumping-Efficiency Flat Broadband Erbium-Doped Fiber ASE Light Source without External Spectral Filter............................. 52 8.1 Experimental Setup.................................................................................. 52 8.2 Experimental Results and Discussions .................................................... 53 8.3 Summary.................................................................................................. 55 Chapter 9. Conclusions.......................................................................................... 56. REFERENCES......................................................................................................... 60 APPENDIX A……………………………………………………………………....66 APPENDIX B………………………………………………………………………69 TABLES…………………………………………………………………………….72 FIGURES…………………………………………………………………………...74 BIOGRAPHY......................................................................................................... 101 PUBLICATION LIST ........................................................................................... 102. ix.
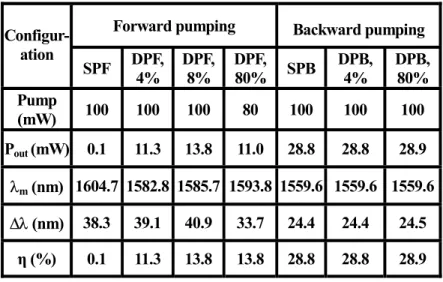
(9) List of Table Table 3.1 Raman gain variation for the 1.31 and 1.65 µm OTDR monitoring 1.55 µm FRA trasmission with forward and backward pumping scheme with the pump-ligh off and on operations................................................................ 70 Table 5.1 Characteristics of the single-pumped EDF ASE light sources in term of output power (Pout), mean wavelength (λm), and pumping efficiency. ...... 70 Table 6.1 Characteristiccomparison of the double-pass bi-directional pumping EDF ASE light source with EDF length of 93 m and 103 m for different R and pumping power. ......................................................................................... 71 Table 7.1 Charscteristics of the dual forward pumping EDF ASE light source with EDF2 length of 13 m for EDF1 lengths of 75, 80, and 85 m. ................... 71. x.
(10) List of Figure Fig. 1.1 Energy-level diagram of stimulated Raman scattering................................. 72 Fig. 1.2 Raman gain coefficient as a function of the frequency shift for silica fiber 72 Fig. 1.3 Typical OTDR trace...................................................................................... 73 Fig. 1.4 Dynamic range and measurement range....................................................... 73 Fig. 1.5 Attenuation and event dead zone.................................................................. 74 Fig. 2.1 Experimental setup of the 1.65 µm OTDR on-line monitoring 1.55 µm AM-VSB CATV transmission system ....................................................... 74 Fig. 2.2 Optical spectra of the system link at positions (a) right before and (b) right after the DEMUX....................................................................................... 75 Fig. 2.3 Baseband video picture of the detected 55.25-MHz channel at poisitions (a) B or A with OTDR off, (b) B with OTDR on, and (c) A with OTDR on. . 75 Fig. 2.4 Measured instantaneous RF spectra of (a), (b), and (c) and maximum-and -hold RF spectra of (d), (e), and (f) corresponding to Fig. 2.3(a), 2.3(b), and 2.3(c), respectively. ............................................................................. 76 Fig. 2.5 Measured OTDR trace for the in-service OTDR monitoring CATV transimission system .................................................................................. 76 Fig. 2.6 Calculated CNR versus the channel isolation of the used DEMUX ............ 77 Fig. 2.7 Calculated CNR along the SMF for 1.65 µm and 1.3 µm OTDR on-line monitoring AM-VSB CATV system.......................................................... 77 Fig. 2.8 Simulated SRS-induced noise level of CATV (a) channel 2 (55.25 MHz), (b) channel 24 (223.25 MHz), and (c) channel 78 (547.25 MHz) by using an OMI of 3%, OTDR peak power of 10 dBm, and pulsewidth of 10 µs. ..... 78 Fig. 2.9 Simulated SRS-induced noise level of CATV channel 2 (55.25 MHz) by using (a) an OMI of 3%, OTDR peak power of 4 dBm, and pulsewidth of xi.
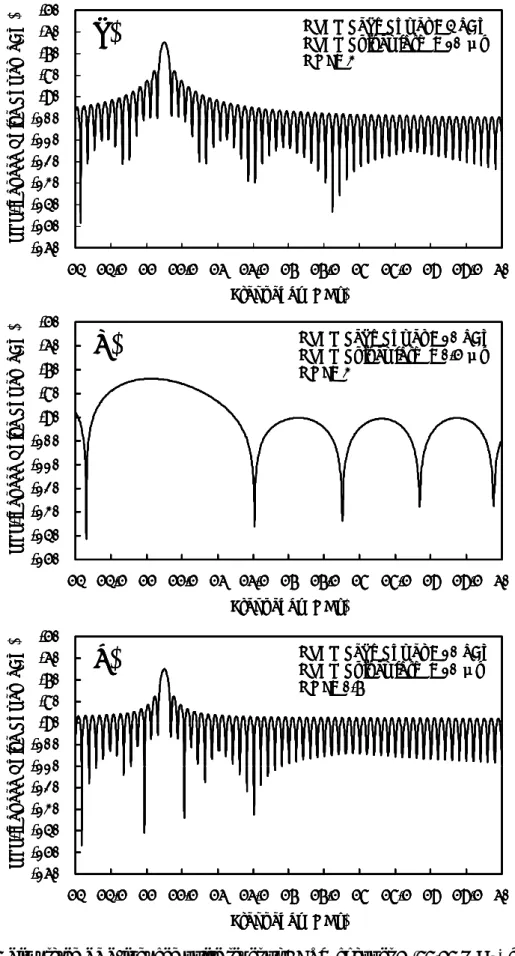
(11) 10 µs, (b) an OMI of 3%, OTDR peak power of 10 dBm, and pulsewidth of 500 ns, (c) an OMI of 0.7 %, OTDR peak power of 10 dBm, and pulsewidth of 10 µs.................................................................................... 79 Fig. 2.10 Simuated SRS-induced spectral noise versus the OTS\DR peak power. ... 80 Fig. 2.11 Simulated SRS-induced spectral noise versus the OTDR pulsewidth. ...... 80 Fig. 2.12 Simulated SRS-induced spectral noise versus the OMI of transmitter ...... 81 Fig. 3.11Experimental setup of the OTDR-monitored forward- or backward-pumping FRA transmission system........................................................................... 81 Fig. 3.2 Measured OTDR traces of (a) the forward- and (b) the backward-pumping scheme in 1.625 µm monitoring FRA transmission system with the pump-light off and on operations............................................................... 82 Fig. 3.3 Measured OTDR traces of (a) the forward- and (b) the backward-pumping scheme in 1.31 µm monitoring FRA transmission system with the pump-light off and on operations............................................................... 82 Fig. 3.4 Measured BER performances of the 10GB/s data channel in 1.31 µm OTDR monitoring 50 km distributed FRA system by using (a) forward-pumping and (b) backward-pumping scheme........................................................... 82 Fig. 3.5 Measured BER performances of the 10GB/s data channel in 1.625 µm OTDR monitoring 50 km distributed FRA system by using (a) forward-pumping and (b) backward-pumping scheme.............................. 82 Fig. 3.6 Simulated OTDR traces of (A) the pump-light off scheme without input signal, (B) the forward-pumping scheme with input signal, (C) the bakward- puming scheme with input signal, and (D) the pump-light off with input signal in 1.625 µm monitoring FRA transmission system........ 83 Fig. 3.7 Simulated OTDR traces of (A) the pump-light off scheme without input signal, (B) the forward-pumping scheme with input signal, and (C) the backward- pumping scheme with input signal in 1.31 µm monitoring FRA transmission system. .................................................................................. 83 xii.
(12) Fig. 4.1 Schematic of rotating circular loop interferometer....................................... 84 Fig. 4.2 Simplified schematic diagram of the optical low-coherence reflectometer. 84 Fig. 4.3 Schematic diagram of the spectrum-sliced light source. .............................. 85 Fig. 4.4 Schematic diagram of the Er3+ energy levels................................................ 85 Fig. 4.5 Schematic diagram of the L-band amplification. ......................................... 86 Fig. 5.1 1480 nm pumped L-band ASE light sources in (a) forward- and (b) backward-pumping configurations. ........................................................... 86 Fig. 5.2 Measured output power and linewidth of ASE source configurations versus the EDF length. .......................................................................................... 87 Fig. 5.3 Measured (a) output power, (b) mean wavelength, and (c) linewidth of the various single-pumped EDF ASE sources versus the pump power. ........... 88 Fig. 5.4 Measured output spectrum of the various single-pumped EDF ASE sources. ................................................................................................................... 89 Fig. 6.1 Proposed double-pass bidirectional pumped EDF ASE source.................... 89 Fig. 6.2 Measured output spectrum of the double-pass bidirectional pumped EDF ASE source operating at EDF of 93 m, PF of 40 mW, and PB of 130 mW with different effective mirror reflectance. ................................................ 90 Fig. 6.3 Measured characteristics of output power and spectral ripple with R of 30% as a function of the forward (PF) and backward (PB) pump powers for the double-pass bidirectional pumping configuration. .................................... 90 Fig. 6.4 Measured characteristics of mean wavelength and linewidth with R of 30% as a function of the forward (PF) and backward (PB) pump powers for the double-pass bidirectional pumping configuration. .................................... 91 Fig. 6.5 Measured pumping efficiency with R of 30% as a function of the forward (PF) and backward (PB) pump powers for the double-pass bi-directional pumping configuration............................................................................... 91 xiii.
(13) Fig. 7.1 Proposed double-pass dual forward-pumping two-staged EDF ASE source. ................................................................................................................... 92 Fig. 7.2 Measured characteristics of output power and spectral ripple as a function of the two pump powers (P1 and P2) with R of 30% for the double-pass dual forward-pumping configuration................................................................. 92 Fig. 7.3 Measured characteristics of mean wavelength and linewidth as a function of the two pump powers (P1 and P2) with R of 30% for the double-pass dual forward-pumping configuration................................................................. 93 Fig. 7.4 Measured pumping efficiency as a function of the two pump powers with R of 30% for the double-pass dual forward-pumping configuration ............ 93 Fig. 7.5 Measured output spectrum of the double-pass dual forward-pumping EDF ASE source operating at EDF1 of 80 m, EDF2 of 13 m, P1 of 60 mW, and P2 of 140 mW with different effective mirror reflectance. ........................ 94 Fig. 8.1 Measured characteristics of output linewidth,pump efficiency, and specral power as a function of the effective mirror reflectance for the double-pass dual forward-pumping configuration......................................................... 94 Fig. 8.2 Measured output spectrum of the double-pass dual forward-pumping EDF ASE source while operating at (A) LD1 of 30 mW, LD2 of 0 mW, (B) LD1 of 0 mW, LD2 od 100 mW, and (C) LD1 of 30 mW, LD2 of 100 mW. .... 95 Fig. 8.3 Measured output ASE spectra with P2 fixed at 100 mW and P1 of 20, 30, and 40 mW for the double-pass forward-pumping EDF ASE source with L1 of 90 m, L2 of 18 m, and R of 15%. ............................................................... 95 Fig. 8.4 Measured characteristics of (a) linewidth, spectral ripple and (b) output power, pump efficiency, and mean wavelength as a function of the second pump power P2 ........................................................................................... 96. xiv.
(14) List of Acronyms AM. Amplitude Modulation. AM-VSB. Amplitude Modulation with Vestigial Sideband. ASE. Amplified Spontaneous Emission. BPF. Band Pass Filter. CATV. Cable Television. CNR. Carrier to Noise Ratio. CSO. Composite Second Order. CTB. Composite Triple Beat. CW. Continuous Wave. DCF. Dispersion Compensated Fiber. DFB LD. Distributed-Feed Back Laser Diode. DR. Dynamic Range. DSF. Dispersion Shifted Fiber. DWDM. Dense Wavelength Division Multiplexing. DUT. Device Under Tset. EDF. Erbium-Doped Fiber. EDFA. Erbium-Doped Fiber Amplifier. ESA. Excited State Absorption. FBG. Fiber Bragg Grating. FOG. Fiber-Optic Gyroscopes. FRA. Fiber Raman Amplifier. FWHM. Full-Width at Half-Maximum. ISO. Optical Isolator. xv.
(15) LEAF. Large Effective Area Fiber. LED. Light-Emitting Diode. MUX/DEMUX. Multiplexer/DeMultiplexer. OBPF. Optical Band-Pass Filter. OLCR. Optical Low-Coherence Reflectometer. OTDR. Optical Time-Domain Reflectometer. PON. Passive Optical Network. PRBS. Pseudo Random Bit Sequence. RF. Radio Frequency. RX. Optical Receiver. SBS. Stimulated Brillouin Scattering. SCM. Sub-Carrier Modulation. SE. Spontaneous Emission. SLD. Superluminescent Diode. SMF. Single-Mode Fiber. SNR. Signal-to-Noise Ratio. SRS. Stimulated Raman Scattering. SWDR. Single-Way Dynamic Range. TX. Optical Transmitter. VCD. Video Compact Disk. VOA. Variable Optical Attenuator. WDM. Wavelength Division Multiplexing. xvi.
(16) Part I Stimulated Raman Scattering (SRS) Effect in OTDR On-Line Monitoring Fiber Transmission Systems. 1.
(17) Chapter 1 Introduction Nonlinear optical phenomenon in silica-based optical fiber such as stimulated Raman scattering (SRS), self-phase modulation, four-wave mixing, and stimulated Brillouin scattering (SBS) can lead to undesirable signal loss and signal distortion in optical fiber transmission systems [1]. Although the SRS effect in the fibers can be used as direct optical amplification to extend the repeater spacing in optical fiber transmission systems [2]-[4]. However, the phenomenon has been considered to be undesirable in actual optical fiber transmission systems [5], [6]. Optical Time Domain Reflectometer (OTDR) is a popular tool to offer an in-service fault-locating of fiber link in fiber-optic transmission systems [7]- [9]. The OTDR monitoring can diagnose and locate both reflective (such as fiber break/cuts) and non-reflective (resulted from fiber crush, bending, tension and pressure) faults of the fiber link. This technique is suitable for a centralized automated in-service network surveillance system to provide real-time testing and early detection of network degradations. This automated surveillance system not only saves the cost of dispatching a technician to perform routine testing, but also reduces the time taken to identify faults after an outage occurs, and thus shortening the network downtime. The 1625/1650 nm OTDRs are commercially available and are used for on-line monitoring of fibers carrying signals in the 1.55 µm window. The SRS effect will deplete the signal in the 1.55 µm window, and thus degrades the bit-error-rate performance [10] because of OTDR operating with high peak power. Hence the impact of the SRS effect for a 1.65 µm OTDR monitoring on-line monitoring amplitude modulation with vestigial sideband (AM-VSB) cable television (CATV) sub-carrier multiplexing (SCM) lightwave system has given rise to our interest. Moreover, a silica fiber Raman amplifiers (FRAs) are particularly attractive for broadband application in dense-wavelength-division-multiplexing (DWDM) transmission systems [11]-[13] since they offer the advantages of greatly extended gain bandwidth, distributed amplification, and low noise performance with the installed fibers as the gain media. With the growing deployment of distributed FRA, the system should facilitate the on-line fault-location monitoring capability to enhance system reliability. The OTDR is a popular tool to provide on-line monitoring of optical fiber links carrying live signals in 1.55 µm transmission systems. However, such a problem about SRS effect between the OTDR optical light and signal channel, or pump lights and the on-line monitoring impact on distributed FRA 2.
(18) transmission systems also have given rise to our attention.. 1.1 Stimulated Raman Scattering (SRS) SRS effect is an important nonlinear process that can turn optical fibers into broadband Raman amplifiers. It can also severely limit the performance of multi-channel optical communication systems by transferring the energy from one channel to the neighboring channels. The SRS effect is schematically depicted in Fig. 1.1. Here a photon beam corresponding to the pumped frequency ωi incidents on a molecule. The pumped photon of energy ћωi is absorbed, raising the system to some intermediate or virtual state, whereon it immediately makes a Stokes transition, emitting a scattered photon of energy ћωs which is smaller than ћωi. In conserving energy, the difference ћωi - ћωs = ћωcb goes into exciting the molecule to a higher vibrational energy |c〉. This is now called the spontaneous Raman effect which was predicted in 1923 by Adolf Smekal and observed experimentally in 1928 by Sir Chandrasekhara Vankata Raman. While another photon beam, having the scattered frequency ωs which matches the Stokes transition, simultaneously incidents on the molecule, the pumped beam loses a photon, while the scattered beam gains a photon and is subsequently amplified. The remaining energy ћωi ћωs = ћωcb is transmitted to the media. Therefore, in many nonlinear media, spontaneous Raman scattering converts a small fraction of the incident power from an optical beam to another optical beam at a frequency downshifted by an amount determined by the vibration modes of the medium. This process is called the Raman effect, and is described quantum-mechanically as a scattering of the incident photon by a molecule to a low-frequency photon while at the same time the molecule makes a transition between vibration states. The incident light acts as a pump to generate the frequency-shifted light called the Stokes wave. It was observed in 1962 that for very intense pump waves a new phenomenon of SRS can occur in which the Stokes wave grows rapidly inside the medium such that most of the pump energy appears in it. The Raman gain coefficient gr is related to the cross section of spontaneous Raman scattering, an experimentally measurable quantity. In general depends on the composition of the fiber core and can vary significantly with the use of different dopants. Figure 1.2 shows as a function of the frequency shift for fused silica at a pump wavelength of 1 µm [14]. The Raman gain spectrum of Fig. 1.2 was obtained from the measurements of the spontaneous Raman-scattering cross section. The Raman gain coefficient in fused silica extends over a large 3.
(19) frequency range (up to 40 THz) with a broad dominant peak near 13.2 THz. This is due to the noncrystalline nature of silica glass. The Raman gain in silica fibers extend continuously over a broad range. Therefore, optical fibers can act as broad-band amplifiers. If a probe light at frequency ωS is coincident with the pump light at the frequency ωP at the fiber input, it will be amplified because of the Raman gain as long as the frequency difference ωP-ωS lies within the broad width of Raman spectrum. If only the pump beam is incident at the fiber input, spontaneous Raman scattering provides a weak signal which act as a probe and is amplified with propagation. Since spontaneous Raman scattering generates photons within the entire band width of the Raman gain spectrum, all frequency components are amplified. However, the frequency component for which gr is maximum builds up most rapidly. SRS leads to generation of the Stokes wave whose frequency is determined by the peak of the Raman gain. The corresponding frequency shift is sometimes called the Raman shift or the Stokes shifts.. 1.2 Review of Optical Time-Domain Reflectometer Most optical fiber parameters like core and cladding diameter, refractive index profile, numerical aperture, or cutoff wavelength are unlikely to change after installation. However, the properties like fiber loss and attenuation are prone to alter through environmental influence like temperature, physical stress, or humidity. Fiber loss is important for installed fiber links since fiber attenuation directly determines the total loss and thus the quality of a transmission system. The OTDR backscatter measurement is an indirect method to determine the fiber attenuation. It is a nondestructive technique and requires access to only one end of the fiber. Furthermore it provides extra information about the fiber under test, like length dependence of the fiber attenuation, and insertion loss of defects, splices, bends, or connectors. The location and type of faults occurring in fiber fabrication, the homogeneity of fiber characteristics, and fiber length can all be tested.. 1.2.1 OTDR Fiber Signature The measured response typically exhibits three types of features: straight line caused by distributed Rayleigh backscattering, positive spikes caused by discrete reflections, and finally steps that can either positive or negative depending on physical fiber properties. Figure 1.3 illustrates a typical OTDR measurement display [15]. The vertical scale is the reflected signal 4.
(20) level on a logarithmic scale. The horizontal axis corresponds to the distance between the instrument and a location in the fiber test. Because an OTDR can only measure time, it translates the time base to fiber distance by using a conversion factor which is about 10-µs/km. The first event that can be seen on an OTDR trace is reflection of the front connector that mates the OTDR to the fiber under test. As the trace is plotted as power vs. distant, the slop of the straight line gives the fiber attenuation in dB/km. Fusion splice cause a sudden drop in the backscatter level. The step size corresponds to the insertion loss only if the two mated fiber are identical. A similar signature on the OTDR display, caused by a stressed curve in the fiber, is called a bend. The bend of fiber results in light reflecting out through the cladding. Fusion splice and bends show only insertion loss without a reflection. They are call non-reflective events. A mismatch in the refractive index causes Fresnel reflections leading to spikes superimposed on the backscatter signal. Mechanical splices, connectors, and cracks in general show a tiny air gap which reflects light rather than scatters it. They belong to reflective events. An open non-terminated fiber end causes a strong reflection depending on the condition of the fiber end surface.. 1.2.2 Performance Parameters The performance of an OTDR is specified by a set of parameters that describe the quality of the measurement and let the user understand how much the instrument fits the application needs. The key parameters of generic requirements for OTDR are dynamic range (DR), measurement range, dead zone, and resolution. Dynamic Range and Measurement Range:. Dynamic. range. is. an. important. parameter. It provides information not only on the maximum fiber loss that can be measured, but also on the measurement time required for a given fiber loss. Dynamic range is defined as the difference between the initial backscatter level and the noise level after 3 min of measurement time, express in decibels of on-way fiber loss. The noise level either can be defined as root-mean-square (SNR=1), or 98% peak noise level. Measurement range deals with identification of events. The measurement range is defined as the maximum attenuation that can be inserted between the ODTR and an event for which the OTDR is still able to accurately measure the event. Commonly a 0.5 dB splice is chosen as the event to be identified. Above information are indicated in Fig. 1.4 [15].. 5.
(21) Dead Zones and Resolution:. Dead zones are always related to the presence of. reflections. It occurs when the reflected signal saturates the OTDR receiver. The receiver is low to recover its sensitivity after the saturation resulting in the loss of information. If the receiver saturates due to strong signals, it will take some time to recover from this overload condition. Two different kinds of dead zones are usually specified. The event dead zone is the distance between the beginning of a reflection and the -1.5 dB point on the falling edge of reflection. The attenuation dead zone is defined as the distance from the start of a reflection to the point where the receiver has recovered to within ±0.5 dB margin. They are indicated in Fig. 1.5 [15]. Moreover, spatial resolution indicates the ability of instrument to resolve two adjacent events. Single-event resolution is also specified. For a splice with less 1 dB, the single event resolution is defined as the 10% to 90% step width. For a discrete reflection, the 50% width is used.. 1.3 The Dissertation Organization of Part I There are three chapters organized in this part of the dissertation. In Chapter 2, we investigated the SRS effect in 1.55 µm AM-VSB CATV transmission system. The baseband video-picture distortion in appearance with “faintly white horizontal thin-lines” on the TV picture was observed. The countermeasure for such SRS-induced video distortion has been achieved and the demonstration by the theory has been discussed. Chapter 3 demonstrates the SRS effect in an in-service supervisory 10-Gb/s DWDM system with silica FRAs for forward pump and backward pumping schemes using the 1.625 µm and 1.31 µm OTDR. The SRS effect in the on-line monitoring transmission system also was demonstrated by the theory.. 6.
(22) Chapter 2 SRS Effect in 1.65 µm OTDR On-Line Monitoring 1.55 µm AM-VSB CATV Transmission System The 1.65 µm OTDR is suitable for on-line monitoring of single-mode fibers (SMF’s) carrying signals in the 1.55 µm window. Because OTDR’s operate with high peak powers, the SRS effect [1], [14] will deplete the power of the 1.55 µm digital signal, and thus degrades the bit-error-rate performance [10]. Recently, due to the insufficient rejection of OTDR pulses at the receiver, the baseband video signal contaminated with the pulse-induced “brightly color horizontal streaks lines” noise appeared in the television (TV) picture has been reported in an on-line monitored AM-VSB CATV transmission system [16]. However, the impact of SRS effect, resulted from the 1.65 µm OTDR monitoring, on the AM video system performance has not yet addressed. Since both 1.55 µm AM transmitter and 1.65 µm OTDR operated with high peak power and the in-between channel separation is exactly matching the peak Raman gain coefficient of the used SMF, the SRS interaction induced power depletion of the AM signal is expected more serious in such on-line monitored AM lightwave system. In this chapter, we investigate. this. problem. experimentally. and. theoretically.. The. SRS-induced. baseband video-picture distortion is observed. The question of why such instantaneous distortion could not be examined through the averaged-process measurement of carrier to noise ratio (CNR) is also clarified.. 2.1 Experimental setup Figure 2.1 shows the experimental setup. An optical transmitter (CATV TX) was externally modulated by 80 NTSC SCM channels (with frequencies of 55.25 – 547.25 MHz). A 980 nm-pumped erbium-doped fiber amplifier (EDFA) acted as a booster with an output power of +14 dBm and noise figure of < 5 dB. A commercial OTDR operated at a repetition rate of about 380 Hz with a pulsewidth of 10 µs. The peak power of the OTDR pulse is +10 dBm. The peak wavelengths of the TX and OTDR signals are 1551 nm and 1659 nm, respectively, and the channel separation of 108 nm is exactly matching the peak Raman gain coefficient of the used SMF. At TX site, the OTDR pulses in combining with the TX signal through a 1.55/1.65 µm multiplexer (MUX) were launched into the 37.6-km SMF link, and demodulated by a 7.
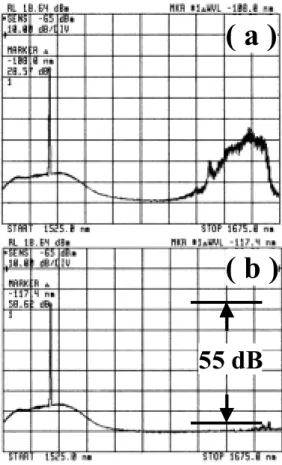
(23) demultiplexer (DEMUX). Both MUX and DEMUX have an insertion loss and channel isolation of 1 dB and 55 dB, respectively. At the receiver (RX) site, a CATV receiver was used with a received power of +1.6 dBm. The performance of CNR, composite second order (CSO), and composite triple beat (CTB) of the SCM signals are measured by using the HP8591C analyzer with a tunable RF bandpass filter (RF-BPF). For investigating the video picture quality, the signal of a video compact disk (VCD) player with the movie content up-converted to 55.25 MHz was used to replace with the 55.25-MHz CW channel at TX end, and a television set at RX site was also employed.. 2.2 Experimental Results Figure 2.2 illustrates the optical spectra of the system link at positions (a) right before and (b) right after the DEMUX. Note that the inter-channel crosstalk level of the AM signal is 55 dB relative to the OTDR signal. This is due to the high channel-isolation of the used DEMUX. We measured the CNR, CSO, and CTB for most of the SCM channels. The averaged CNR, CSO, and CTB are about 49.5 dB, 65 dBc, and 64 dBc, respectively. No serious degradations of <0.1 dB, <0.2 dB, and <0.2 dB of the CNR, CSO, and CTB, respectively, were obtained for all measured channels in the presence of the on-line monitoring as compared with the case while switching OTDR off. Fig. 2.3(a), 2.3(b), and 2.3(c) illustrates the baseband video pictures of this VCD channel (55.25 MHz) corresponding to the receiving positions (a) at either B or A with OTDR off, (b) at B with OTDR on, and (c) at A with OTDR on. The healthy baseband video picture in Fig. 2.3(a) looks clear and no distortion. While locating the RX at position A, the baseband video picture was distorted as illustrated in Fig. 2.3(c) with the “brightly color horizontal streaks lines” as like that reported in [16]. This is because the detected SCM channels contaminated directly by the OTDR pulses at the RX due to the absence of DEMUX. In Fig. 2.3(b), the baseband video picture was distorted too but with the “faintly white horizontal thin streaks lines.” This did not result from the insufficient isolation (55 dB) of the DEMUX because such strikes lines were not observed for the 1.31-µm OTDR monitoring experiment with the 10-µs pulses and the peak power of +14 dBm while using the 1.31/1.55 µm DEMUX with 55-dB isolation. The instantaneous and maximum-and-hold RF spectra of the VCD channel were then examined. Figure 2.4(a), 2.4(b), and 2.4(c) show the instantaneous spectrum corresponding to Fig. 2.3(a), 2.3(b), and 2.3(c). Figure 2.4(d), 2.4(e), and 2.4(f) shows the maximum-and-hold spectra corresponding to Fig. 2.3(a), 2.3(b), and 2.3(c). Here, the healthy spectra of Fig. 2.4(a) and 2.4(d) are also shown for comparison. In Fig. 2.4(c), the 8.
(24) OTDR pulse-train-induced randomly distributed frequency components not only brought to high noise level as shown in Fig. 2.4(f), but also gave rise to the baseband video distortion with “brightly color horizontal streaks lines” in TV picture as reported in [16]. In Fig. 2.4(b), the weakly SRS-induced noise components near the carrier frequency are difficult to observe. But when we compare Fig. 2.4(e) with 2.4(b), it is then easily to identify those noise components. These SRS-induced noise components give rise to the baseband video distortion with “faintly white horizontal thin streaks lines” in TV picture. In Fig. 2.3(c), the TV picture not only included the OTDR-pulse-induced “brightly color horizontal streaks lines”, but also concealed the SRS-induced “faintly white horizontal thin streak-lines.” However, the intensity of the latter is weaker than the former. Therefore, “faintly white thin streak-lines” were difficult to be observed in the presence of “brightly color streaks lines”. In addition, the SCM signal quality has also been examined for other video channels located in middle-frequency (e.g., 325.25 MHz) and high-frequency (e.g., 547.25 MHz) regions. The quality of middle-frequency and high-frequency signals in the presence of OTDR light was almost the same as that of Fig. 2.3(b), and Fig. 2.4(b) and 2.4(c). Figure 2.5 shows the measured OTDR probe trace in the in-service monitoring 1.55 µm AM-VSB CATV transmission system. The OTDR probe trace does not distort due to the SRS effect since the average power of 1.55 µm signal channel is low and barely Raman gain is induced in 1.65 µm OTDR probe channel. Therefore, the reflective fiber faults occurred, fiber-loss coefficient, and reflection profile in the fiber link can be still observed and identified.. 2.3 Analysis of SRS-Induced Power Depletion and CNR Degradation We consider the AM (the pump light) and OTDR signals (the signal light) with the same polarization co-propagated in the SMF. The OTDR pulses are rectangular periodic signal with repetition cycle T = 2.63 ms (= 1/380) and a pulsewidth τ = 10 µs. We started with the coupled equations in [17] describing the SRS interaction in optical fiber, and the AM signal power along the SMF is derived and approximately given by i=M. Pp (1.55 µm ) ( z , t ) = Pp 0 (1 + ∑ me. jΩ i ( t −. z. υg 2. ). ) ⋅ e −αz ⋅ [1 −. gPs 0 (1 − e −αz ). α. i =1. ]. , nT < t < nT + τ. (2.1). where Pp0 is the average AM optical power, m is the modulation index, Ωi is the subcarrier 9.
(25) angular frequency, vg2 is the group velocity of the transmitted signal, α is the fiber loss coefficient, g (= gr/Aeff). is the standard Raman gain coefficient, gr, divided by the fiber. effective area, Aeff, and Ps0 is the peak power of OTDR pulse. The first term represents the 1.55-µm AM power along the SMF, and the second term in the square bracket represents the power depletion due to the SRS interaction between the AM signal and OTDR light. The values of the above parameters are of Pp0 = 14 dBm, α = 0.25 dB/km, gr = 8.6×10⁻¹² cm/W, Aeff = 80 µm2, and Ps0 = 10 dBm. On the other hand, the resultant CNR is given by [16] (2.2). −1. CNR −1 = CNR1 + POTDR Pav − p (1.55 µm ). CNR1 =. 0.5 × m 2 × ( ρPav − p (1.55 µm ) ) 2 [2 × q × ( ρPav− p (1.55 µm ) ) + RIN × ( ρPav − p (1.55 µm ) ) 2 + I n ] × B 2. (2.3). where CNR1 is the CNR of the system using DEMUX with ideal channel isolation, POTDR is the crosstalk power from the OTDR channel in RX, and P av-p(1.55µm) is the average received AM signal power. m is the modulation index (0.03), ρ is the responsivity (0.85 mA/mW) of the used photodiode, q is 1.6×10⁻¹⁹ Coulomb, RIN is the relative intensity noise of laser source (-155 dB/Hz), In is the receiver equivalent noise current (7pA/√Hz), and B is the bandwidth (5 MHz). Figure 2.6 shows the calculated CNR as a function of the channel isolation of DEMUX. We find that the minimum isolation required to completely exclude the OTDR pulse power at the RX is about 53 dB. Hence, the 55-dB isolation of the DEMUX in the experiment is satisfied for not introducing pulse-induced distortion. There is 1-dB instantaneous CNR degradation, due to the SRS-induced power depletion, in the presence of the OTDR pulse. Fig. 2.7 shows the calculated CNR evolution along the SMF, where the “#” and “*” represent two measured CNR data of 53 dB at 0 km and 49.5 dB at 37.6 km in fiber link, respectively. Note that the calculated results agree well with the experimental data. Again, the SRS-induced instantaneous CNR degradation is 1 dB as compared with the OTDR off while employing the DEMUX with either 55-dB or ideal channel isolation. Then two reasons for why almost no 1-dB CNR degradation observed are obviously. First, most of the SRS-induced noise components as shown in Fig. 2.4(c) or 2.4(f) would be averaged out by the averaging measurement in the HP8591C analyzer. Second, the duty-cycle of OTDR is so small of 3.8 × 10⁻³ (= 10 µs/2.63 ms), then the SRS-induced averaged CNR degradation is < 0.1 dB, which also agrees with the experimental data. 10.
(26) 2.4 Theoretical Model of the SRS-Interaction in the CATV System In the on-line monitoring AM-VSB CATV transmission system, we consider both the 1.55 µm AM-VSB signal and 1.65 µm OTDR probe pulses with the same polarization copropagating in an SMF. The 1.55 µm AM-VSB signal launched into the SMF can be expressed as i=M. PAM (t ) z =0 = PAM 0 (1 + ∑ m exp( jΩt )) ,. (2.4). i =1. where PAM0 is the average optical power, m is the OMI, and Ωi is the subcarrier angular frequency. We assume that the OTDR probe pulse is a rectangular periodic signal with a repetition cycle T and a pulsewidth τ. Therefore, we can express the OTDR pulse npulse(t) , as the sum of repeated pulses. n pulse (t ). z =0. = PSV 0. ∞. ∑ x(t − nT ). (2.5). n = −∞. (0 < t − nT < τ ). x(t − nT ) = 1. The equation using the complex form of the Fourier series is given by n =∞. n pulse ( t ). z =0. =∑. where ms =. n =1. PSV 0τ τ {1 + m s exp[ j 2nπf 0 (t − )]} T 2. ,. (2.6). 2 sin(nπf 0τ ) , PSV0 is the peak optical power, and f0 is the repetition rate of the nπf 0τ. OTDR probe pulse. eqs. (2.4) and (2.6) yield the coupled equations that describe the SRS interaction in the optical fiber [18]. By expanding the exponential term of the above expression to the first order in g, which is the standard Raman gain coefficient divided by the fiber effective area, (g= gr/Aeff), we evaluate the integral and obtain (see in Appendix A) PAM ( z , t 1 ) = PAM 0 (1 + gP SV 0τ m s ∑ n =1 T. n=∞. i= M. ∑. me. j Ω i t1. ) ⋅ e −α z × {1 − g. exp{ j [ 2 n π f 0 ( t 1 −. α 2 + ( 2 n π f 0 d ps ) 2 2. T. i =1. 1 − 2 e −α z cos( 2 n π f 0 d ps z ) + e − 2α z. τ. PSV 0τ L eff. ) + tan. −1. (. ×. e −α z sin( 2 n π f 0 d ps z ) e. −α z. cos( 2 n π f 0 d ps z ) − 1 11. −. (2.7) ) + tan. −1. (. 2 n π f 0 d ps. α. )]}}.
(27) where α is the fiber loss coefficient , d ps = ( 1 − 1 ) ≈ D(λ AM − λSV ) is the walkoff parameter, υ gAM. t1 = t −. z. υ gAM. , and Leff =. 1 − e −αz. υ gSV. is the effective length of the fiber. vgAM and vgSV are the. α. group velocities for the transmitted AM light (λAM) and OTDR light (λSV), respectively. In eq.(2.7), the first term in brackets corresponds to the carrier power of the AM light. The second term in brackets corresponds to the interaction between the optical carrier of the OTDR light and the subcarrier channel of the AM light. This power loss resulted from the SRS effect but it does not contribute to the crosstalk. The third term in brackets is the crosstalk due to SRS interaction between 1.65 µm OTDR probe pulses and the 1.55 µm AM signal channel. The SRS-induced noise is received by the photodiode and then passed through a tunable radio frequency (RF) band-pass filter (BPF). The transfer function H(f) of BPF is assumed to be H( f ) ={. e − j 2πft0 0. ( f c − 1.25MHz ≤ f ≤ f c + BW − 1.25MHz ) , (otherwise). (2.8). where t0 is the group delay time of BPF, fc is the subcarrier frequency of CATV channels, and BW is the bandwidth of BPF. The SRS-induced noise power within a subcarrier signal band is given by [19] PSRS = 0.5( ρ max⋅ [ nSRS (t ) ]) 2 RD G ,. (2.9). where ρ is the responsivity of the photodiode in the receiver, RD is the input resistance of the optical receiver, and G is the electrical power gain of the receiver. nSRS(t) is the temporal response function of the SRS-induced noise passing through one subcarrier band and can be obtained using n SRS (t ) =. f (n, z ) =. n4 gPAM 0 PSV 0τ −αz n2 e { ∑ f ( n, z ) + m ∑ f ( n, z ) × exp[ jΩ i t1 ]} n = n1 n = n3 T. ms 1 − 2e −αz cos(2nπf 0 d ps z ) + e −2αz. α 2 + (2nπf 0 d ps ) 2. (2.10a). ×. (2.10b). −αz. e sin(2nπf 0 d ps z ) 2nπf 0 d ps τ exp{ j[2nπf 0 (t1 − − t 0 ) + tan −1 ( −αz ) + tan −1 ( )]} 2 α e cos(2nπf 0 d ps z ) − 1. 12.
(28) n1 = ( f c − 1.25MHz ) f 0 + ε 1 , n2 = ( f c + BW − 1.25MHz ) f 0 + ε 2 ,. ε 1, 2,3, 4 < 1 2. n3 = (−1.25MHz ) f 0 + ε 3. ,. (2.10c). n4 = ( BW − 1.25MHz ) / f 0 + ε 4 where n1, n2 , n3 and n4 are integers. The simulated system structure and parameters are the same as the experimental setup in Fig. 2.1. Both the 1.65 µm OTDR light with a repetition rate of 380 Hz and the 1.55 µm AM-VSB optical light have the same polarization copropagating in SMF. The system parameters are a fiber length (z) of 37.6 km, a fiber attenuation (α) of 0.25 dB/km, a fiber dispersion (D) of 17 ps/nm/km, and a fiber effective area of 80 µm2. The Raman gain coefficient (gr) is about 8.6×10⁻¹² cm/W for the 1.65 µm OTDR on-line monitoring 1.55 µm transmission system since its frequency shift is about 11.7 THz (100 nm). For the 1.31 µm OTDR on-line monitoring 1.55 µm transmission system, a Raman gain coefficient of 0.2×10⁻¹² cm/W is used since its frequency shift is about 35.4 THz (240 nm). For the Raman gain coefficient as a function of the frequency shift for silica fiber, it is shown in Fig. 1.2. Moreover, a transmission fiber attenuation of 0.35 dB/km is used for the 1.31 µm OTDR on-line monitoring 1.55µm transmission system. For the receiver, its parameters are as follows: responsivity (ρ) of 0.85 mA/mW, input resistance (RD) of 1 kΩ, and electrical power gain (G) of 1000.. 2.5 Simulation Results and Discussions Figures 2.8(a)-2.8(c) describe the simulated SRS-induced noise level of the CATV channel 2 (55.25 MHz), channel 24 (223.25 MHz), and channel 78 (547.25 MHz), respectively, using an OMI of 3%, an OTDR peak power of 10 dBm, and a pulse width of 10 µs. We found that the SRS-induced noise level for these channels of different frequencies has the same level of about -52 dBm, and then the SRS-induced baseband video distortion of “faintly white horizontal thin streaks lines” was experimentally observed on a TV picture for these low-, intermediate-, and high-frequency CATV channels. This is because SRS interaction instantaneously depletes the optical power of the 1.55 µm signal light and then generates a crosstalk between the OTDR pulses and the AM optical carrier. Therefore, the SRS effect resulted in the instantaneously degraded CNR and baseband noise in each CATV channel.. 13.
(29) In the experiments, we found that the above-mentioned SRS-induced baseband video distortion may vanish by either attenuating the peak power of OTDR pulses to below 4 dBm, shortening the pulse width of OTDR pulses to below 0.5 µs, or reducing the OMI of the AM transmitter. Figures 2.9(a)-2.9(c) show the simulated SRS-induced noise level of CATV channel 2 (55.25 MHz) induced by (a) attenuating the OTDR peak power to 4 dBm, (b) shortening the OTDR pulsewidth to 0.5 µs, and (c) reducing the OMI to 0.7%. As compared with Fig. 2.8(a), the SRS-induced noise level obviously decreases from -52 dBm to -65 dBm in Fig. 2.9(a) and 2.9(c), and to –73 dBm in Fig. 2.9(b). Apparently either a lower peak power, a narrower pulsewidth of OTDR probe pulses, or a lower OMI gives rise to a lower SRS-induced noise level. The trend of the calculation results accurately reflects that of the experimental results. Therefore, it is experimentally and theoretically demonstrated that the SRS-induced noise level can be reduced and therefore the baseband video distortion of “faintly white horizontal thin streaks lines” on a TV picture may be eliminated by reducing the OTDR peak power, pulse width of OTDR pulses, and/or the OMI of the AM transmitter. The SRS-induced spectral noise of a CATV channel, which resulted from the SRS interaction between the OTDR probe light and the 1.55 µm signal light, is defined as the total noise power divided by the channel bandwidth of 6 MHz. Figure 2.10 shows the simulated SRS-induced spectral noise with respect to the OTDR peak power for the 1.31 µm and 1.65 µm OTDR on-line monitoring systems with an OTDR pulse width of 10 µs and an AM transmitter OMI of 3%. The simulated SRS-induced spectral noise level decreases as the OTDR peak power decreases. By using an OTDR peak power of 10 dBm, the simulated SRS-induced spectral noise of 8.5×10⁻¹² mW/Hz for the 1.65 µm OTDR case is about three orders larger than that of 6.56×10⁻¹⁵ mW/Hz for the 1.31 µm OTDR case. By reducing the 1.65 µm OTDR peak power to 4 dBm, the experimentally observed picture distortion vanishes, and the spectral noise is about 5.31×10⁻¹³ mW/Hz, which is still larger than that of the 1.31 µm OTDR monitoring system operating at a peak power of 10 dBm. Figure 2.11 shows the simulated SRS-induced spectral noise with respect to the OTDR pulse width for the 1.31 µm and 1.65 µm OTDR on-line monitoring systems with an OTDR peak power of 10 dBm and an AM transmitter OMI of 3%. The SRS-induced spectral noise level decreases markedly as the OTDR pulse width is shortened to less than 1 µs for both OTDR on-line monitoring systems. By shortening the 1.65 µm OTDR pulse width to 0.5 µs, the SRS-induced spectral noise, which is still larger than that of the 1.31 µm OTDR monitoring system, is about 3.23×10⁻¹³ mW/Hz and the experimentally observed picture distortion vanishes. Moreover, the OMI of the AM transmitter will affect the 14.
(30) level of SRS-induced noise. Figure 2.12 shows the simulated SRS-induced spectral noise level with respect to the OMI of the AM transmitter for the 1.31 µm and 1.65 µm OTDR on-line monitoring systems with an OTDR peak power of 10 dBm and a pulse width of 10 µs. The spectral noise level decreases as the OMI decreases. By decreasing the OMI to 0.7%, the SRS-induced spectral noise is about 5.57×10⁻¹³ mW/Hz, which is the same as that observed when the picture distortion vanished. Based on the above simulation and experimental results, we find that the noise level of the 1.31 µm OTDR monitoring system is about three orders less than that of the 1.65 µm OTDR case. Consequently, for the 1.31 µm OTDR on-line monitoring1.55 µm AM-VSB system, such SRS-induced baseband video distortion will not occur. This is because the Raman gain coefficient encountered by the wavelength set with a channel separation of about 240 nm between the 1.55 µm AM channel and 1.31µm OTDR channel is quite small. For the countermeasure approaches of the 1.65 µm-monitored system, the reduction of either the peak power or width of the OTDR pulse may give rise to a reduced OTDR dynamic range from 18 dB to less than 15 dB, and thus will limit the allowable supervisory link length of less than 60 km. On the other hand, a lower OMI for the transmitter also degrades the CNR performance of all the received CATV channels, and thus is unable to satisfy the system requirements. Consequently, utilization of the 1.31 µm OTDR for the on-line monitoring of the 1.55 µm AM-VSB CATV system is the best choice not only to eliminate the SRS-induced baseband video distortion, but also to provide a longer supervisory link length. The dynamic range of today’s 1.31 µm OTDR is about 40 dB, and therefore the allowable supervised link length is about 100 km.. 2.6 Summary We have investigated the distortion of baseband video picture arising from the 1.65-µm OTDR-induced SRS effect in 1.55 µm AM-VSB CATV system. The baseband video-picture distortion in appearance with “faintly white horizontal thins lines” on the TV picture is observed. Such instantaneous distortion could not be examined through the averaged-process measurement of CNR. The SRS-induced baseband video distortion may vanish by either attenuating the peak power of OTDR pulses to below 4 dBm, shortening the pulse width of OTDR pulses to below 0.5 µs, or reducing the OMI of the AM transmitter. The countermeasure approaches entail the reduction in the OMI of the AM transmitter, OTDR peak power and/or 15.
(31) pulse width. However, a low peak power or a short OTDR probe pulse width degrades the OTDR dynamic range, and a low AM transmitter OMI also degrades the CNR of the transmitted system. Moreover, the 1.31 µm OTDR wavelength for on-line monitoring of 1.55 µm AM CATV systems due to almost bare of SRS interaction, occurred in the same experiment, is a good candidate since the in-between channel separation of 240 nm (about 35.8 THz for 1.31 µm ) results in a very small Raman gain coefficient of the used SMF. The theoretical analysis of the SRS interaction and these countermeasures in the transmission system are also demonstrated. The simulation results agree with the experimental data. Consequently, the SRS-induced baseband video distortion due to the 1.65 µm OTDR monitoring makes the 1.31 µm OTDR wavelength a good candidate for in-service supervision of 1.55 µm AM CATV systems and networks.. 16.
(32) Chapter 3 SRS-Induced OTDR Distortion Traces in On-Line Monitoring 1.55 µm Fiber Raman Amplifier Transmission System The SRS effect can be used as direct optical amplification to extend the repeater spacing in optical fiber transmission systems [20, 21]. The FRAs pumped at multiple wavelengths are attracting much attention in DWDM systems since they offer the advantages of greatly extended gain bandwidth, distributed amplification, and low noise performance with the installed fibers as the gain media [21, 22]. In general, the OTDR is a popular tool to provide on-line monitoring of optical fiber links carrying live signals in 1.55 µm transmission systems [23-25]. With the growing deployment of distributed FRA, the system should facilitate the on-line fault-location monitoring capability to enhance system reliability. However, the SRS effect between the 1.31 µm or 1.625 µm OTDR light and 1.48 µm-band pumped lights will distributed deplete 1.31 µm OTDR light or increase 1.65 µm OTDR light in 1.55 µm FRA transmission system. In this chapter, the on-line monitoring impact using 1.31 and 1.625 µm OTDR on-line monitoring 1.55 µm distributed FRA transmission systems are investigated and the SRS effect between the OTDR wavelength and pump wavelengths of FRA or/and the signal wavelength is discussed.. 3.1 Experimental Setup Figure 3.1 shows the experimental setup of the OTDR-monitored 1.55 µm distributed FRA transmission system, in which the forward- and backward-pumping schemes are separately examined. At transmitter site, a 1.55 µm distributed feedback (DFB) laser diode with a continuous-wave (CW) output power of 0 dBm was externally modulated by a LiNbO3 modulator with 231-1 NRZ pseudo-random bit-sequence (PRBS) data at 10 Gb/s. The modulated signal was amplified by an EDFA with an output power of about 17 dBm and a noise figure of 5 dB. The power level of data channel was adjusted by a variable optical attenuator (VOA1) to 0 dBm at position A. The data channel combined with the 1.625 µm or 17.
(33) 1.31 µm Anritsu OTDR channel that operated with 20 µs pulsewidth, and then launched into the fiber link through a 1.55/1.65 or 1.55/1.31µm wavelength selective coupler (WSC1). The peak power for 1.625 and 1.31 µm OTDR pulses with 20 µs are about 11 and 13 dBm, respectively, and the corresponding single-way dynamic range (SWDR) OTDR for 1.625 and 1.31 µm OTDR are about 29 and 34 dB, respectively. The FRA consists of the pump module and the 50 km large effective area fiber (LEAF) link as the gain medium. The pump module is composed of a pump power combiner and four fiber-grating-stabilized pump laser diodes (LDs) with the central wavelengths of 1460, 1470, 1480, and 1490 nm, respectively. The output power of each pump LD is about 160 mW, and the total pump power at the output port of the pump combiner is about 500 mW. In forward-pumping scheme, the pump lights combined with both data and OTDR channels through a 1.48/1.55 µm coupler (WSC2), and then launched into the LEAF link, in which the pump lights and the data and OTDR channels have the same propagating direction. In backward-pumping case, which is operated in most distributed FRA transmission systems, the pump lights are launched into the LEAF link through a 1.48/1.55 µm coupler (WSC3). In this case, the pump lights have opposite propagating direction with both data and OTDR channels. All. wavelength. selective. couplers. (WSC1,. WSC2,. and. WSC3). are. the. thin-film-filter-based devices. In the 1.31 µm OTDR monitoring FRA system, the WSC1 is a 1310/1550 nm wavelength selection coupler whose insertion loss is about 1.4 dB in the region of 1300-1330 nm, 3.6 dB around 1480 nm, about 0.5 dB in the region of 1530-1570 nm, and the channel isolation is about 55 dB at 1.55 µm port and 26 dB at 1.31 µm port. In the 1.625 µm OTDR monitoring FRA system, the WSC1 is a 1625/1550 nm wavelength selection coupler whose insertion loss is about 1.8 dB around 1480 nm, 1.6 dB around 1554 nm, about 0.8 dB around 1625 nm, and the channel isolation is about 63 dB at 1.55 µm port and 59 dB at 1.625 µm port. The insertion losses of both WSC2 and WSC3 are the same with about 0.8 dB in the region of both 1420-1500 nm and 1510-1670 nm. The channel isolations of both WSC2 and WSC3 are about 65 dB at 1.55 µm port and 64 dB at 1.48 µm port. Since both WSC1 and WSC2 have low flat spectral characteristics and high channel isolations, the OTDR probe lights and also the Rayleigh backscattering lights can properly pass through both WSC1 and WSC2, and the on-line monitoring for this system can be achieved. At receiving site, a DWDM demultiplexer (DEMUX) with a channel spacing of 1.6 nm with a 3 dB bandwidth of 0.88 nm, an averaged channel insertion loss of 1.8 dB, and a channel isolation of 40 dB was used to demultiplex the data channel. The OTDR light is also separated from the data channel by this 18.
(34) DEMUX. The PINFET receiver (Rx) with a receiver sensitivity of –18.5 dBm is used for BER measurements.. 3.2 Experimental Results and Discussions Figures 3.2 and 3.3 show the OTDR traces of (a) the forward-pumping and (b) the backward-pumping case for 1.625 and 1.31 µm OTDR on-line monitoring 1.55 µm FRA transmission system, respectively. The healthy trace corresponding to the case while switching off all pump lights, and the measured loss coefficient of the 50 km LEAF is about 0.248 and 0.35 dB/km, respectively. In contrast, for both wavelength OTDR supervisory FRA transmission systems, while switching the pump light on, the measured OTDR traces being distorted in both pump schemes. Such distorted traces in Figs. 3.2 and 3.3 give rise to an un-accurately measured fiber-loss coefficient and reflection profile along fiber link. When there is a fiber break occurred, the fiber fault location could be still easily located and identified in such distorted OTDR trace. Note that the last reflecting spike at about 50 km coincides with the total link length of the system. In 1.625 µm OTDR on-line monitoring 1.55 µm FRA transmission system, the Rayleigh backscattered source of the amplified 1.625 µm OTDR probe light along the fiber link may cause distortion to the healthy OTDR trace. The mechanism of the amplified 1.65 µm OTDR probe light is mainly due to the Raman gain, pumped by the 1.46~1.49 µm pumped lights of 1.55 µm FRA, in the distributed amplification process along the fiber. The 1.55 µm data channel relatively to the 1.625 µm OTDR channel gives a separation of 75 nm (about 8.93 THz), which matches higher Raman gain coefficient of about 5.7×10⁻¹⁴ m/W for the used fiber, but the power of 1.55 µm signal is much less than that of the 1.46~1.49 µm pumped lights which give a separation of 165~135 nm (about 20.8 ~ 16.7 THz) relatively to the 1.625 µm OTDR channel, which match the lower Raman gain coefficient of about 1×10-14 ~ 2×10-14 m/W for the used LEAF. Therefore, the 1.46~1.49 µm pumped lights of 1.55 µm FRA are mainly sources to provide Raman gain to the 1.625 µm OTDR probe light and result in distorted OTDR trace, which are higher level than the healthy OTDR trace, as shown in Fig. 3.2. In forward-pumping case, the 1.55 µm optical Raman amplification gain is depleted from 12.6 to 12 dB while switching the OTDR on. In backward-pumping case, the Raman gain of 1.55 µm data light is depleted from 14 to 13.8 dB while switching the OTDR on. The gain degradation, which results from the power depletion of 1.55 µm data light due to the SRS-interaction between the 1.55 µm data channel and 1.625 µm OTDR channel, is about -0.6 19.
(35) dB and -0.2 dB for the forward-and backward-pumping cases, respectively. In 1.31 µm OTDR on-line monitoring 1.55 µm FRA transmission system, the distorted OTDR supervisory trace mainly results from the SRS interaction between the 1.31 µm OTDR lights and pumped lights of 1.46~1.49 µm of FRA since the 1.31 µm OTDR channel relatively to the 1.46 ~ 1.49 µm pumped lights of 1.55 µm FRA give a separation of 150 ~ 180 nm (about 23.5 ~ 27.7 THz), which match the Raman gain coefficient of about 1.7×10⁻¹⁴ ~ 0.4×10⁻¹⁴ m/W for the used fiber. The SRS effect between the 1.31 µm OTDR light and the 1.55 µm data channel can be neglected because of a separation of 240 nm (about 35.5 THz), which matches lower Raman gain coefficient of about 0.4×10⁻¹⁴ m/W and lower power of 1.55 µm data channel which is less than that of the 1.46 ~ 1.49 µm pumped lights. Therefore, the power of 1.31 µm OTDR lights is depleted due to the SRS interaction with the 1.46 ~ 1.49 µm pumped light of 1.55 µm FRA along the fiber in both forward and backward pumping cases and result in distorted OTDR traces, which are lower level than the healthy OTDR trace, as shown in Fig. 3.3. In forward-pumping case, the 1.55 µm optical Raman amplification gain is boosted from 11.8 to 12 dB while switching the OTDR on. In backward-pumping case, the 1.55 µm Raman gain is boosted from 13.1 to 13.2 dB while switching the OTDR on. The gain improvement, which results from due to the SRS-interaction between the 1.55 µm data channel and 1.31 µm OTDR channel, is about +0.2 dB and +0.1 dB for the forward-and backward-pumping cases, respectively. Table 3.1 lists the Raman gain variation for 1.31 and 1.625 µm OTDR monitoring 1.55 µm FRA transmission with forward and backward pumping schemes with the pump-light off and on operations. In the 1.625 µm OTDR on-line monitoring 1.55 µm FRA transmission system, the gain degradation, which results from the power depletion of 1.55 µm data light due to the SRS-interaction between the 1.55 µm data channel and 1.625 µm OTDR channel, is about -0.6 dB and -0.2 dB for the forward-and backward-pumping cases, respectively. Similarly, in the 1.31 µm OTDR on-line monitoring 1.55 µm FRA transmission system, the gain improvement, which results from due to the SRS-interaction between the 1.55 µm data channel and 1.31 µm OTDR channel, is about +0.2 dB and +0.1 dB for the forward-and backward-pumping cases, respectively. Figures 3.4(a) and 3.4(b) show the BER performances of the 10 Gb/s data channel in 1.31 µm OTDR monitoring 50-km distributed FRA system by using forward-pumping and backward-pumping scheme, respectively. Note that the OTDR-monitoring induced power 20.
(36) penalty is negligible (< 0.1 dB) for a BER of 10-9 for forward-pumping and backward-pumping scheme in spite of the pump light was on or off. This is because the channel separation of 240 nm between the 1.31 µm OTDR light and 1.55 µm signal light matches the lower Raman gain coefficient of the used fiber and gives rise to weak SRS interaction with the data channel. Figures 3.5(a) and 3.5(b) show the BER performances of the 10 Gb/s data channel in 1.625 µm OTDR monitoring 50-km distributed FRA system by using forward-pumping and backward-pumping scheme, respectively. Note that the OTDR-monitoring induced power penalty is also negligible (< 0.1 dB) in spite of the pump light was on or off for a BER of 10-9 for backward-pumping scheme in spite of the pump light was on or off. Although the channel separation of 75 nm between the 1.625 µm OTDR light and 1.55 µm signal light matches the higher Raman gain coefficient of the used fiber, the 1.55 µm signal light depleted due to SRS effect with the 1.625 µm OTDR light has trivial impact on BER performance in this system.. 3.3. Theoretical Analysis of SRS-Induced Distorted OTDR Traces. In this section, we analyze forward and backward Raman amplification schemes in single-mode fiber transmission systems with distance L. The developed theoretical models of the SRS effect can be applied in the proof of SRS-induced distorted OTDR trace for 1.31 or 1.625 µm OTDR online monitoring 1.55 µm FRA transmission system. The pump light and the signal light with the same propagating direction is called forward scheme and with opposite propagating direction is called backward scheme. Here we deal with the single-mode fiber whose core radius and attenuation constant are r (effective cross section Aeff = πr2) and α, respectively. Label S and P are used for representing the signal at the Stokes frequency and the pump frequency, respectively.. 3.3.1 Forward Stimulated Raman Interaction and Amplification Here we analyze forward stimulated Raman scattering taking account of the effect of the pump depletion. Consider the pump with a power PP(0) is injected at z = 0 and travel in the +z direction with an effective power PP(z) together with the signal whose effective power is PS(z). The differential equations only considering SRS nonlinear interaction for forward traveling waves of the signal and the pump are given by [26] dPS ( z ) g g = { r PP ( z ) − α S } ⋅ PS ( z ) + hν S ⋅ r PP ( z ) dz Aeff Aeff 21. (3.1).
(37) and dPP ( z ) g λ = −{ r S PS ( z ) + α P } ⋅ PP ( z ) dz Aeff λP. (3.2). where gr is the Raman gain coefficient, ν is the frequency of the light wave and h is Plank’s constant. We assume that. {. gr g PP ( z) − α S }⋅ PS ( z) >> hν S ⋅ r PP ( z) Aeff Aeff. and αS = αP = α to solve eq. (3.1). and eq. (3.2). The first assumption will be effective since we deal with PS(0) ≠ 0. The second assumption will be held around 1.55 µm wavelength region in low-loss fibers. Under the assumption, forward signal light power evolution PS(z) and pump power evolution PP(z) can be analytically solved and given by (see the Appendix B). Ps (0) gC exp{ r 0 (1 − e −αz ) − αz} Pp (0) Aeff α Ps ( z ) = gC λ P ( 0) 1+ s s exp{ r 0 (1 − e −αz )} Aeff α λ p Pp (0) C0. Pp ( z ) =. (3.3). C0 exp{−αz} gC λ P ( 0) 1+ s s exp{ r 0 (1 − e −αz )} Aeff α λ p Pp (0). where C0 =. (3.4). λs Ps (0) + Pp (0) . λp. We consider a dimensionless parameter F defined by F=. λs PS (0) g C [1 − exp( −αz )] } ⋅ exp{ r 0 Aeff λ p PP (0) α. (3.5). Equation (3.5) illustrates F as a function of the fiber length and F becomes larger as the fiber length increases and reaches a steady state for αz >> 1. We consider the PS(z) and PP(z) under the both F >>1 and F << 1. 1) F >>1: In this case, eq. (3.3) and eq. (3.4) become PS ( z ) = C0 ⋅. λP ⋅ exp( −αz ) λS. (3.6). 22.
(38) PP ( z ) =. g C [1 − exp( −αz )] λP PP (0) C0 ⋅ exp{−[ r 0 + αz ]} Aeff λS PS (0) α. (3.7). Equation (3.6) indicates that the signal plays as if it has the input power C0(λP/λS) and merely travels in the fiber with an attenuation constant α without SRS interaction, and the signal power reaches at almost the pump power at z = 0 pulses the incident signal power. Therefore, it is important to choose parameters lest F exceed 1 when SRS is used for amplification in optical fiber transmission system. 2) F << 1: In this case, eq. (3.3) and eq. (3.4) become PS ( z ) = C0. Ps (0) gC exp{ r 0 (1 − e −αz ) − αz} Pp (0) Aeff α. (3.8). PP ( z ) = C0 ⋅ exp( −αz ). (3.9). In considering the signal amplified by SRS, PS(0) << PP(0) and C0 ≈ PP(0). Equation (3.8) and eq. (3.9) become PS ( z ) = PS (0) exp{. g r PP 0 (1 − e −αz ) − αz} Aeff α. (3.10). PP ( z ) = PP 0 ⋅ exp( −αz ). (3.11). Equation (3.10) is the same as the results derived by Smith [27] under assumption that pump depletion due to stimulated process is neglected. When the theory is used in fiber Raman amplifier, the Raman gain G due to stimulated Raman amplification is defined by C0 g C [1 − exp( −αL)] ⋅ exp{ r 0 } PP (0) Aeff α PS ( L) } = 10 ⋅ log{ } G = 10 ⋅ log{ g r C0 [1 − exp( −αL)] λS PS (0) PS (0) exp( −αL) 1+ } ⋅ exp{ Aeff λP PP (0) α For both F >> 1 and F << 1 cases, the gain is recast simply as. 23. (3.12).
數據
![Figure 1.2 Raman gain coefficient as a function of the frequency shift for silica fiber [15]](https://thumb-ap.123doks.com/thumbv2/9libinfo/8893671.256223/89.892.158.726.751.1095/figure-raman-coefficient-function-frequency-shift-silica-fiber.webp)
![Figure 1.3 Typical OTDR trace [15]](https://thumb-ap.123doks.com/thumbv2/9libinfo/8893671.256223/90.892.158.712.160.511/figure-typical-otdr-trace.webp)

+7


Outline
The Dissertation Organization of Part I
Analysis of SRS-Induced Power Depletion and CNR Degradation
Summary
Theoretical Analysis of SRS-Induced Distorted OTDR Traces
Basic Concept and Characteristics of ASE Fiber Source
The Dissertation Organization of Part II
Experimental Results and Characteristics Comparison
相關文件
例行重新校準不包括在任何保修計畫內。由於基本保修或延長保修不包括校 準 / 驗證,因此您可選擇購買一定時間的 FlexCare 校準 / 驗證服務包。請與 授權服務中心聯繫 ( 請參閱第 166
圓光佛學研究所講師.. Gregory, Tsung-mi and the Sinification of Buddhism.. Gregory, Inquiry into the Origin of Humanity: An Annotated Translation of Tsung-mi‘s Yuan jen lun with
Reading Task 6: Genre Structure and Language Features. • Now let’s look at how language features (e.g. sentence patterns) are connected to the structure
develop a better understanding of the design and the features of the English Language curriculum with an emphasis on the senior secondary level;.. gain an insight into the
Using this formalism we derive an exact differential equation for the partition function of two-dimensional gravity as a function of the string coupling constant that governs the
In this paper, motivated by Chares’s thesis (Cones and interior-point algorithms for structured convex optimization involving powers and exponentials, 2009), we consider
Miroslav Fiedler, Praha, Algebraic connectivity of graphs, Czechoslovak Mathematical Journal 23 (98) 1973,
利用 eigenvalue 的 algebraic multiplicity 以 及 geometric multiplicity, 可以幫助我們判別一個 square matrix 是否為
