CEREBRAL COLUMNAR ORGANIZATION OF THE FIRST
NOCICEPTIVE COMPONENT INDUCED BY CO
2LASER ON THE TAIL
OF THE RAT
F.-S. JAW,* Y.-C. KAO, C.-P. CHEN AND W.-L. LIAO Institute of Biomedical Engineering, National Taiwan University, No.1, Sec. 4, Roosevelt Rd., Taipei 10617, Taiwan, R.O.C.
Abstract—The somatotopic map of the first nociceptive com-ponent in the primary somatosensory cortex (S1) is still un-clear. In this study, a CO2laser was applied to the tail of the rat to induce nociception without the interference from large myelinated (A) fibers. Thus, only noxious fibers could be activated. Two-dimensional current-source-density analysis was used to analyze the evoked field potentials. Using this method, the nociceptive responses of A␦-fibers in S1 were verified, and the somatotopic map of the first nociceptive component in S1 was identified. We found that whether light touch or laser-induced nociception was applied to the tail of the rat, the responsive topography in S1 was consistent. Discrimination of these two modalities was achieved verti-cally in the same column; the deeper layer represented the nociceptive response while the superficial layer encoded the response to light touch. This is quite different from that of a primate brain. © 2008 IBRO. Published by Elsevier Ltd. All rights reserved.
Key words: current source density, nociception, CO2laser, evoked potentials, cortex, rat tail.
Columnar organization in the cerebral cortex has been well known since its proposal in 1955 (Mountcastle et al., 1955). One column consists of a vertical assembly of neurons spanning whole cellular layers in the cerebral cortex (Horton and Adams, 2005). Electrophysiological data acquired from microelectrodes in the primary somato-sensory cortex (S1) or visual cortex, histological evidence from Golgi stains (Lorento De No, 1949), and embryolog-ical inferences of cortembryolog-ical development (Rakic, 1971, 1988; Walsh and Cepko, 1992) all support the existence of col-umns in the cortex. Neurons in the same column share the same peripheral receptive field (LeVay and Nelson, 1991), and columns respond to similar receptive field clusters known as hypercolumns (Nicholls et al., 2001; Horton and Hocking, 1998; Sincich and Horton, 2003). These charac-teristics of columnar organization make exploring the func-tion of the cortex much easier.
Lamina is the other substructure in the cerebral cortex and lies parallel to the cortical surface. From in vitro or in
vivo electrophysiological recordings, distinct electrical
characteristics have been found due to the morphological characteristics and composition of neurons, interneurons, and even functional receptors in different lamina (Salin and Prince, 1996; Zhang and Deschenes, 1997). Furthermore, histological evidence from immunological or fluorescent staining has further verified these findings (Bodor et al., 2005; Cauli et al., 1997).
One column in S1 is allocated to one receptive field, however, do neurons at different depths (or lamina) in one column process different functions? In 1983, it was first observed that dissimilar neural activities were displayed in the six layers of one column when applying stimuli of touch or nociception to the periphery (Lamour et al., 1983a,b). Subsequently, there have been only a few studies that have shown distinct functions in different layers of S1. In this study, two-dimensional (2D) current source density (CSD) (Jaw et al., 2008) was used to investigate the pos-sible functions of the lamina in S1.
We adopted a CO2laser as an adequate and quanti-tative nociceptive stimuli (Bromm and Lorenz, 1998) to prevent the activation of low-threshold mechanical recep-tors (Bromm and Treede, 1984). After 2D CSD analysis, a single conspicuous dipole could be used to demonstrate the first nociceptive component response in S1. Hence, the dipole activated by the CO2 laser occupied the deeper layer (or lamina) than that activated by mechanical touch. This suggests that S1 utilizes horizontal (or columnar) mapping to locate the body site being stimulated and the lamina within the same cortical column differentiates what kind of stimulus is encoded in rodents. By contrast, in primate brains, different modalities from the same recep-tive field maybe processed in different cortical area. This may imply that the increase in the number of cortical columns during evolution enables us to handle somatosen-sory information on more complex and delicate manner.
EXPERIMENTAL PROCEDURES
PreparationTwelve male Wistar rats that weighed between 250 and 450 g were used in the present experiment. All experiments were carried out in accordance with the guidelines of the National Taiwan University College of Medicine and College of Public Health Insti-tutional Animal Care and Use Committee (IACUC), as well as the National Institutes of Health Guide for the Care and Use of Lab-oratory Animals (NIH Publications No. 80-23). All efforts were made to minimize the number of animals used and their suffering. Rats were initially anesthetized with ketamine (50 mg/mL; intra-peritoneally) and then injected with diluted ketamine (1.5 mg/mL; i.v.) using an infusion pump to maintain the required depth of
*Corresponding author. Tel:⫹886-2-23687401; fax: ⫹886-2-33665268. E-mail address: jaw@ntu.edu.tw (F.-S. Jaw).
Abbreviations: AP, anterior–posterior; CSD, current source density;
FP, field potential; LEP1, early laser evoked potential; ML, medial– lateral; S1, primary somatosensory cortex; 2D, two-dimensional.
Neuroscience xx (2008) xxx
0306-4522/08 © 2008 IBRO. Published by Elsevier Ltd. All rights reserved. doi:10.1016/j.neuroscience.2008.09.046
anesthesia during the experiment. Tracheotomy was performed to enable the clearance of the airway and provide continuous respi-ration. The body temperature of the rat was maintained higher than 37.8 °C using a homeothermic blanket.
After the rat was positioned in the stereotaxic apparatus, a craniotomy was performed. The primary somatosensory area of the right cortex, 3.0 mm posterior to the bregma and 3.0 mm lateral to the sagittal suture, was exposed and the dura was removed carefully. A glass micropipette filled with 3 M NaCl so-lution was used as the recording electrode.
Stimulation and recordings
The skin in the middle portion of the tail of the rat was stimulated by heat radiation generated by a CO2 laser (TAIEX YJS-11;
TAIEX Co., Ltd., Shengang Township, Taichung Country, Taiwan, R.O.C.). Ten effective laser pulses were applied within 2 cm of the tail because the receptive field usually covers an area longer than 6 cm on the tail of the rat. A single pulse with a power of 2.5 W and 0.01 s duration was employed. To avoid damage to the tail by burning, a 10 s interval between stimuli was adopted.
The innervated nerve is the 3rd sacral root (S3), and the projected area in S1 was limited to 1.4 –1.6 mm posterior to the bregma and 1.2–1.6 mm lateral to the sagittal suture. The evoked potentials were amplified 2500 times. The signals were then low-pass filtered (5th-order Butterworth, 100 Hz) to eliminate noise higher than 45 Hz (Jaw, 2001). The signals were converted through a 12-bit A/D card (PCI-MIO-16E-4, National Instrument) and stored in a computer.
To digitize the field potentials (FPs), a 1 kHz sampling rate and 1024 points were used. For each recording site, 10 cycles of the evoked FPs were averaged for noise reduction.
Data analysis
The FPs can reveal the integral response that results from volume conduction among neurons, and the interactions and interconnec-tions manifested by neurons. CSD analysis was used to determine the activity center of the FPs (Jaw et al., 2008).
RESULTS
The consistent latency of the FPs recorded in the S1 indicated which types of afferent fibers were involved in conducting the laser-stimulated noxious sensation from the periphery. According to the previous study of mechan-ical stimuli, the depth of the maximal response was ap-proximately 500m from the surface of the cortex (Chien et al., 2007). Hence, we mapped the range of noxious responses at this depth. After a preliminary search, CSD analysis was performed on the FPs at each plane sepa-rately. Following this, the center of the largest (major) response to the first nociceptive component was identified.
Conduction velocity of the responses
The conduction velocity is calculated by dividing the dis-tance between the stimulus site and recording point (about 30 cm) by the latencies of the evoked FPs. The result obtained was 5 m/s. This suggested that the A␦-fiber was engaged in the conduction of the first nociceptive compo-nent.
Response on the horizontal section
To locate the area of S1 that is responsive to the tail, systematic recordings on horizontal sections at a depth of
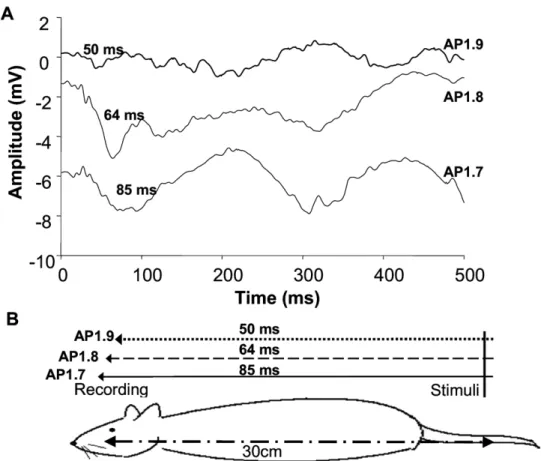
500m were performed (n⫽2). As the skin of the rat tail was irradiated by the CO2laser, point-by-point recordings were made at that depth. Higher amplitudes of the FPs waveforms were found when the recording points came closer to the mapped area of the tail (Fig. 1A). The overall range, however, was limited to a region 2.0 mm behind the bregma and 2.0 mm lateral to the sagittal suture. Although the amplitudes of the FPs varied with different recording points, the major receptive regions in S1 of the laser-induced nociceptive responses were 1.7–2.0 mm behind the bregma and 1.7–2.0 mm lateral to the sagittal suture. As shown inFig. 1, the latencies of the recording points were 50⫾5 ms, 60⫾5 ms, and 80⫾5 ms, respectively. The latencies were shorter when the recording points were more proximal to the tail.
Coronal and sagittal mapping of responses
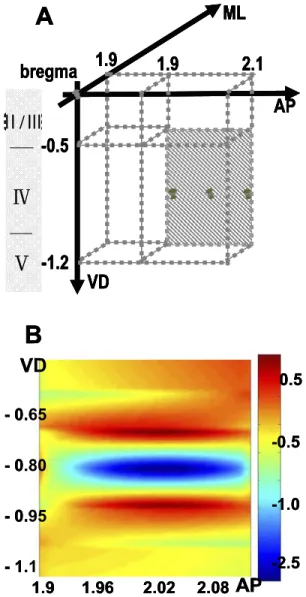
After locating the responsive center on the horizontal sec-tion, it is important to verify the depth with the maximal FPs response. First, the coronal plane (approximately 1.7– 2.0 mm right lateral to the sagittal suture and 500 – 1000 m in depth) with anterior–posterior (AP) fixed at 1.9 mm behind the bregma (n⫽4) (Fig. 2A) was recorded. The responsive latencies on this plane were approximately 50⫾5 ms, and the amplitudes of the FPs were maximal at a depth of 900m. The CSD analysis of the FPs showed a dipole at a depth of 700 –900m (Fig. 2B). Two sources were found at 700 m and 900 m, and a sink was demonstrated at a depth of 800m.
Second, the sagittal plane (approximately 1.9 –2.2 mm behind the bregma and 500 –1000m in depth) with me-dial–lateral (ML) fixed at 1.9 mm lateral to the sagittal suture, was mapped (n⫽1) (Fig. 3A). The responsive la-tencies, approximately 50 – 80 ms, were not as consistent as those on the coronal plane, and the FPs at a depth of 900m were more distinct than that seen at other depths. The CSD analysis of the FPs also showed a dipole at a depth of 700 –900m (Fig. 3B). Two sources were found at 700m and 900 m, and a sink was found at a depth of 800m.
Searching on the horizontal section at a depth of 900m
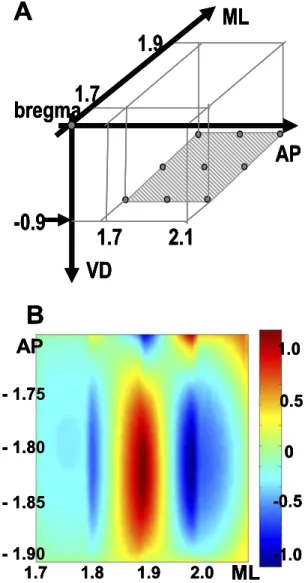
According to the previous results, the maximal response in S1 was located at 900m. Recordings were performed on the horizontal plane at a depth of 900m to obtain the maximal responsive area (n⫽3). The recording ranges were 1.7–2.1 mm behind the bregma and 1.7–2.1 mm lateral to the sagittal suture (Fig. 4A).
The FPs latencies varied from approximately 50 –90 ms. As the recording points moved closer to the tail, the FP waveforms had higher amplitudes. The CSD analysis showed that a significant sink appeared (ML 1.8, AP 1.8 – 1.9) (Fig. 4B).
DISCUSSION
In this study, the first nociceptive component of the wave-form showed a clear negative polarity. The later
compo-nent was also negative, but more variability was observed. These waveforms resembled the FPs recorded from Mich-igan probes in S1 (Sun et al., 2006).
The conduction velocity of the first component of the laser-evoked FPs corresponded to A␦-fibers. Therefore, this component was identified as the early laser evoked potential (LEP1), mediated by A␦-fibers from the periphery. LEP1 then enter the ventral posterolateral (VPL) nuclei of the thalamus and arrive at S1 (Treede et al., 1999). LEP1 can reflect the intensity of the laser stimulus (Ohara et al., 2004; Bornhovd et al., 2002; Kalliomaki et al., 1993) and is very sensitive to anesthetics (Shaw et al., 2001).
The appearance of the later negative-polarity wave-form in this study was more unstable and ambiguous. Without the morphine control test (Kalliomaki et al., 1993; Sun et al., 2006), it is impossible to verify that this nega-tive-polarity waveform is truly the late laser evoked poten-tial (LEP2) (Kalliomaki et al., 1993), or the potentials from faster polysynaptic response in S1. Therefore, we focused on the LEP1, which is conveyed by the A␦-fibers.
The initial hypothesis of this study is that since one of the major functions of S1 is localization (Treede et al., 1999), the variation in the response should be more related to the stimuli sites (receptive fields) than modalities. Be-cause of previous findings from mechanical stimuli, a depth of 500m (Chien et al., 2007) was used to locate the responsive center in the horizontal plane. The massive pyramidal cells at this depth, which belong to laminae II/III
of the cortex, helped us locate the representation of the tail in S1.
The CSD analysis from both coronal and sagittal planes showed similar results; that is the source-sink-source dipole is around 800m in depth. This indicated the ionic flows at this depth were very strong. It also corresponds to the dipole calculated from one-dimensional CSD analysis in lamina IV (Sun et al., 2006). Due to the specific thalamic afferents terminating in this layer, the neurons at this depth receive specific noxious inputs from the thalamus (White and Keller, 1989). The dipoles pre-sented on these two planes were oriented vertically to the cortical surface. This confirms the columnar orientation in the cerebral cortex (Mountcastle, 1997).
The depth recordings of the maximal responses deter-mined the main responsive regions in S1 when laser stim-uli were applied to the rat’s tail. In previous studies using various techniques including functional images, electro- or magneto-encephalograms, the maximal responsive depth (laminar) in S1 could not be clearly located (Bornhovd et al., 2002; Hofbauer et al., 2001; Bromm and Chen, 1995). Even the isopotential maps directly interpreted from laser evoked potentials only showed the widespread distribu-tions in S1 (Shaw et al., 1999). The obvious dipole ob-served at a depth of 700 –900 m proved that there is somatotopic organization of the first laser-induced noci-ceptive component in S1.
Fig. 1. The latencies of the responses on the sagittal plane, ML fixed at 1.9 mm lateral to the sagittal suture. (A) Waveforms of the laser evoked potentials. (B) Site of laser stimuli and recording points. The distances behind the bregma and their latencies are as indicated.
When stimulating the tail of the rat, the depth of the maximal response to mechanical stimuli was 500 m (Chien et al., 2007) and that of laser stimuli was 900m. Previous studies support these findings that the cortical layer in the SI of rodents is more superficial when respond-ing to mechanical stimuli compared with noxious ones (Shaw et al., 1999; Sun et al., 2006; Lamour et al., 1983a,b). In addition, some previous studies in rats (Schouenborg et al., 1986; Kalliomaki et al., 1993) and primates (Apkarian et al., 1987) have speculated that the nociception mediated by C-fibers projects to the deeper cortical layers, laminae Vb and VI, than that mediated by A␦-fibers. These findings indicate that there are two noci-ceptive pathways from the periphery to the CNS and may manage different aspects of pain (Kalliomaki et al., 1993). The prominent responsive center of LEP1 obtained from
CSD analysis in the more superficial lamina in S1 also supports this viewpoint.
Some previous findings from brain imaging studies show the different locations of mechanical and pain sen-sations, the former in area 3b and area 1, and the latter in area 3a, in the cortex of the primate (Tommerdahl et al., 1996; Craig, 2003). Since, the characteristics of traditional electrophysiological recordings and functional images are incomparable, the results from two kinds of studies may not fully correspond. Nonetheless, the inconsistence be-tween the primate and the rat may not be attributed to the difference of functional imaging with electrophysiology only. Other studies showed the different locations between somatosensory evoked potentials (SSEPs) and (LEPs) in human S1 by using intracerebral recording (Valeriani et al., 2004). This supported that LEPs, especially the N2-P2 component, could be generated in a more posterior part of S1, e.g. area 1 or area 2 (Valeriani et al., 2004), S2 (Tarkka
B
VD
- 1.1
- 0.95
- 0.65
1.9
1.96
2.08
- 0.80
-2.5
0.5
-1.0
AP
-0.5
2.02
VD
bregma
ML
1.9
1.9
2.1
-0.5
AP
-1.2
A
้
/๊
Č
č
B
VD
- 1.1
- 0.95
- 0.65
1.9
1.96
2.08
- 0.80
-2.5
0.5
-1.0
AP
-0.5
2.02
B
VD
- 1.1
- 0.95
- 0.65
1.9
1.96
2.08
- 0.80
-2.5
0.5
-1.0
AP
-0.5
2.02
VD
bregma
ML
1.9
1.9
2.1
-0.5
AP
-1.2
A
้
/๊
Č
č
VD
bregma
ML
1.9
1.9
2.1
-0.5
AP
-1.2
VD
bregma
ML
1.9
1.9
2.1
-0.5
AP
-1.2
A
้
/๊
Č
č
A
้
/๊
Č
č
้
/๊
Č
č
Fig. 3. The sagittal plane showing the depth of maximal responses.
(A) An illustration of where the plane is recorded. (B) 2D CSD analysis on the sagittal plan at 50 ms latency. A dipole (AP 1.9 –2.1, VD 0.65– 0.95) is clearly shown. (The unit of the color bar is v/mm2.)
B
VD
- 1.00
- 0.85
- 0.55
1.80
1.86
1.98
- 0.70
-0.6
0.6
-0.2
ML
0.2
1.92
2.2
1.8
1.8
-0.5
bregma
VD
AP
-1.0
ML
A
้
/๊
Č
B
VD
- 1.00
- 0.85
- 0.55
1.80
1.86
1.98
- 0.70
-0.6
0.6
-0.2
ML
0.2
1.92
B
VD
- 1.00
- 0.85
- 0.55
1.80
1.86
1.98
- 0.70
-0.6
0.6
-0.2
ML
0.2
1.92
VD
- 1.00
- 0.85
- 0.55
1.80
1.86
1.98
- 0.70
-0.6
0.6
-0.2
ML
0.2
1.92
2.2
1.8
1.8
-0.5
bregma
VD
AP
-1.0
ML
A
้
/๊
Č
2.2
1.8
1.8
-0.5
bregma
VD
AP
-1.0
ML
2.2
1.8
1.8
-0.5
bregma
VD
AP
-1.0
ML
A
้
/๊
Č
้
/๊
Č
Fig. 2. The coronal plane showing the depth of maximal responses. (A) An illustration of where the recoding plane is made. (B) 2D CSD analysis on the coronal plane at 50 ms latency. A dipole (ML 1.8 –2.1, VD 0.65– 0.95) is obtained. (The unit of the color bar is v/mm2
and Treede, 1993; Bromm and Lorenz, 1998), or other posterior parietal cortex, area 5 or area 7 (Valeriani et al., 2004). Nevertheless, to compare the responsive region in S1 between painful and non-painful sensation, the more adequate stimuli should be used instead of electrical stim-uli. Ultimately, there must be some differences among species. Considering the huge amount of the cerebral cortical volume of the primate, the function of localization and discrimination of modality may be accomplished at different areas, unlike the rodent that performs the two tasks in the same column. Based on the differences of methodology and species from prior researches, we just limited our suggestion in rodents.
If noxious stimuli from the same region in the periphery all induce the same topographic regions in S1, it would provide additional evidence that localization of sensory input is a definite function of S1 in the rat. Therefore, our initial hypothesis has been supported. For further
confir-mation, simultaneous recordings of neuronal responses to a variety of sensory modalities at different laminae in a single column should be performed. Multi-channel multi-unit simultaneous recordings could be used to further ver-ify this hypothesis.
CONCLUSION
In summary, the A␦-fiber-mediated component of nocicep-tion in S1 was mapped by CSD analysis. The horizontal section in S1 represents the somatotopic map of peripheral receptive fields. By contrast, the layer of S1 encodes the modality of stimuli. Thus, the S1 in the rat is a well-orga-nized and highly structured area.
Acknowledgments—This study was supported by 95-EC-17-A-19-S1-056 and NSC 97-2221-E-002-004-MY3.
REFERENCES
Apkarian AV, Stevens RT, Jones MW, Hodge J (1987) Cells of origin of the spinothalamic pathways in the primate. Pain 30:S398. Bodor AL, Katona I, Nyiri G, Mackie K, Ledent C, Hajos N, Freund TF
(2005) Endocannabinoid signaling in rat somatosensory cortex: laminar differences and involvement of specific interneuron types. J Neurosci 25:6845– 6856.
Bornhovd K, Quate M, Galuche V, Bromm B, Weiller C, Buchel C (2002) Painful stimuli evoke different stimulus-response functions in the amygdale, prefrontal, insula and somatosensory cortex: a single-trial fMRI study. Brain 125:1326 –1336.
Bromm B, Treede RD (1984) Nerve fiber discharges, cerebral poten-tials and sensations induced by CO2laser stimulation. Hum
Neu-robiol 3:33– 40.
Bromm B, Chen CAN (1995) Brain electrical source analysis of laser evoked potentials in response to painful trigeminal nerve stimula-tion. Electroencephalogr Clin Neurophysiol 95:12–26.
Bromm B, Lorenz J (1998) Neurophysiological evaluation of pain. Electroencephalogr Clin Neurophysiol 107:227–253.
Cauli B, Audinat E, Lambolez B, Angulo MC, Ropert N, Tsuzuki K, Hestrin S, Rossier J (1997) Molecular and physiological diversity of cortical non-pyramidal cells. J Neurosci 17:3894 –3906.
Chien CN, Li JY, Jaw FS (2007) Pseudo-synchronous system for recording action and field potentials simultaneously. Measurement 40:717–723.
Craig AD (2003) Pain mechanism: labeled lines versus convergence in central processing. Annu Rev Neurosci 26:1–30.
Hofbauer RK, Rainville P, Duncan GH, Bushnell MC (2001) Cortical representation of the sensory dimension of pain. J Neurophysiol 86:402– 411.
Horton JC, Adams DL (2005) The cortical column: a structure without a function. Philos Trans R Soc B 360:837– 862.
Horton JC, Hocking DR (1998) Monocular core zones and binocular border strips in primate striate cortex revealed by the contrasting effects of enucleation, eyelid suture, and retinal laser lesions on cytochrome oxidase activity. J Neurosci 18:5433–5455.
Jaw FS (2001) Optimal sampling of electrophysiological signals. Neu-rosci Res Commun 28:75– 84.
Jaw FS, Kao YC, Chen CP, Lee CY, Chen YY (2008) High-fidelity evoked potential for mapping the rat tail in thalamus. Neuroscience 155(1):277–282.
Kalliomaki J, Weng HR, Nilsson HJ, Schouenburg J (1993) Nocicep-tive C fiber input to the primary somatosensory cortex (S1). A field potential study in the rat. Brain Res 622:262–270.
Lamour Y, Willer JC, Guilbaut G (1983a) Rat somatosensory (Sm1) cortex: I. Characteristics of neuronal responses to noxious
stimu-bregma
ML
VD
1.9
1.7
1.7 2.1
-0.9
AP
A
B
AP
- 1.90
- 1.85
- 1.75
1.7
1.8
1.9
2.0
- 1.80
-1.0
1.0
-0.5
0
0.5
ML
bregma
ML
VD
1.9
1.7
1.7 2.1
-0.9
AP
A
bregma
ML
VD
1.9
1.7
1.7 2.1
-0.9
AP
A
B
AP
- 1.90
- 1.85
- 1.75
1.7
1.8
1.9
2.0
- 1.80
-1.0
1.0
-0.5
0
0.5
ML
B
AP
- 1.90
- 1.85
- 1.75
1.7
1.8
1.9
2.0
- 1.80
-1.0
1.0
-0.5
0
0.5
ML
Fig. 4. Mapping at the horizontal plane. (A) Illustration of the record-ings. (B) Two-dimensional CSD analysis on the horizontal plane at 55 ms latency. A dipole (ML 1.8 –2.1, AP 1.75–1.9) is obtained. (The unit of the color bar is v/mm2
lation and comparison with non-noxious stimulation. Exp Brain Res 49:35– 45.
Lamour Y, Guilbaut G, Willer JC (1983b) Rat somatosensory (Sm1) cortex: II. Laminar and columnar organization of noxious and non-noxious inputs. Exp Brain Res 49:46 –54.
LeVay S, Nelson SB (1991) Columnar organization of the visual cor-tex. In: The neural basis of visual function (Leventhal AG, ed), pp 266 –315. Boston: CRC Press.
Lorento De No R (1949) Cerebral cortex: architecture, intracortical con-nections, motor projections. In: Physiology of the nervous system (Fulton J, ed), pp 288 –330. New York: Oxford University Press. Mountcastle VB, Berman AL, Davies PW (1955) Topographic
organi-zation and modality representation in first somatic area of cat’s cerebral cortex to peripheral stimuli. Am J Physiol 183:464. Mountcastle VB (1997) The columnar organization of the neocortex.
Brain 120:701–722.
Nicholls JH, Martin AR, Wallace BG, Fuchs PA (2001) From neuron to brain, 4th edition. Sunderland: Massachusetts Press.
Ohara S, Crone NE, Weiss N, Treede RD, Lenz FA (2004) Amplitudes of laser evoked potential recorded from primary somatosensory, parasylvian and medial frontal cortex are graded with stimulus intensity. Pain 110:318 –328.
Rakic P (1971) Guidance of neurons migration to the fetal monkey neocortex. Brain Res 33:471– 476.
Rakic P (1988) Specification of cerebral cortical areas. Science 241:170 –176.
Salin PA, Prince DA (1996) Spontaneous GABAA receptor-mediated inhibitory currents in adult rat somatosensory cortex. J Neuro-physiol 75:1573–1588.
Schouenborg J, Kalliomaki J, Gustavsson P, Rosen I (1986) Field potentials evoked in rat primary somatosensory cortex (S1) by impulses in cutaneous A- and C-fibers. Brain Res 397:86–92. Shaw FZ, Chen RF, Tsao HW, Yen CT (1999) Comparison of
touch-and laser heat-evoked cortical field potentials in conscious rats. Brain Res 824:183–196.
Shaw FZ, Chen RF, Yen CT (2001) Dynamic changes of touch- and laser-evoked field potentials of primary somatosensory cortex in awake and pentobarbital-anesthetized rats. Brain Res 911:105– 115.
Sincich LC, Horton JC (2003) An albino-like decussation error in the optic chiasm revealed by anomalous ocular dominance columns. J Neurosci 23:5684 –5692.
Sun JJ, Yang JW, Shyu BC (2006) Current source density analysis of laser heat-evoked intra-cortical field potentials in the primary so-matosensory cortex of rats. Neuroscience 140:1321–1336. Tarkka IM, Treede RD (1993) Equivalent electrical source analysis of
pain-related somatosensory evoked potentials elicited by a CO2
laser. J Clin Neurophysiol 10:513–519.
Tommerdahl M, Delemos KA, Vierck CJ, Favorov OV, Whitsel BL (1996) Anterior parietal cortical response to tactile and skin-heating stimuli applied to the same skin site. J Neurophysiol 75:2662– 2670.
Treede RD, Kenshalo DR, Gracely RH, Jones AKP (1999) The cortical representation of pain. Pain 79:105–111.
Valeriani M, Barba C, Le Pera D, Restuccia D, Colicchio G, Tonali P, Gagliardo O, Treed RF (2004) Different neuronal contribution to N20 somatosensory evoked potential and to CO2laser evoked
potentials: an intracerebral recording study. Clin Neurophysiol 115:211–216.
Walsh C, Cepko CL (1992) Widespread dispersion of neuronal clones across functional regions of the cerebral cortex. Science 255: 434 – 440.
White EL, Keller A (1989) An integrative view of cortical circuitry. In: Cortical circuits: synaptic organization of the cerebral cortex; struc-ture, function, and theory (White EL, ed), pp 179 –206. Boston: Birkhauser Publisher.
Zhang ZW, Deschenes M (1997) Intracortical axonal projections of lamina VI cells of the primary somatosensory cortex in the rat: a single-cell labeling study. J Neurosci 17:6365– 6379.