Ⴎ୶Ҁൠөࠣ୶ᖃϟఃึܓ௱զᅌᆘݳ
ഋᓉ݄ ᆵεᏢၗૻᆅᏢس ጯܴਗ ᆵεᏢπᆅᏢس Ֆۓࣁ πמೌࣴزଣႝတᆶ೯ૻπࣴز܌ᄣ्
ഇႇӍཿ୶ൣޠԞȂӍཿѠпщϸජඬᇅΠ၍ຳᄈөᆎ୧ࠣᆎȃቌ ੀȃၰІߵࣁޠЇᔗȂяԥਞޠ୧ࠣᆔ౪२्؛๋ȄҐःفޠл्ҭޠ൸ ණяΚঐࢻཿӔӤ୶ൣђঅ౪ޠᔗңዂԓȂҼ֊ၽңஆҐ୶ၦਠᄈҀൠޒ ݸໍ௱զȄҐःفӶႮ୶Ҁൠ௱զαூژঐԚݏȈ࡛ҴႮ୶ཿᄙ୶௱զዂԓ ؛๋Мනقಜϟࢻโȇ࡛ҴႮ୶ཿᄙ୶௱զዂԓ؛๋Мන࢝ᄻȂєࢃᐍᡞ࢝ᄻᇅ ಣԚϰષޠᜱ߾ϟϸݚȇ࡛ᄻॏᆘᇅ௱զዂԓ৳ȇഇႇࠣϸᇅӵୣܓڎঐᄻ८Ȃ ໍၯཿᄙϸݚȄҐःفԚݏϑԚಌᙾԚ࣐Κঐུޠၦଊ݉ଡ଼୧ཿዂԓȂഇႇ ঐःفᇅ௱զᚘםޠ࡛ҴȂٻூཿѠпၽңӔӤ୶ൣقಜໍђঅϸݚȄ ᜱᗥມȈႮ୶Ҁൠȃ௱զዂԓȃ؛๋Мනقಜȃ୶௱զᇅႲขȃӔӤ୶ൣA Heuristic Algorithm for Estimating Retail Market
Size Using POS Data
Ching-Chin Chern
Dept. of Information Management, National Taiwan University David Ming-Huang Chiang
Dept. of Business Administration, National Taiwan University Ting-Wei Ho
Information System Dept. Industrial Technology Research Institute Computer & Communications Research Laboratories
Abstract
This study considers the problem of estimating the market size for individual items in the retail grocery industry by sampling the point-of-sales (POS) data from a small number of stores. Using publicly-accessible data provided by each chain and the information from the retailers’ financial reports (e.g., number of stores and total revenue), the sampled POS data can be translated into market size information for each item in each area. This research culminated in the development of an algorithm called the POS Market Estimation Heuristic Algorithm (PMEHA), which uses heuristic rules and sampled POS data to estimate overall market information for each area. This algorithm was employed in a prototype designed to calculate market size estimations. Through use of a simple cross analysis procedure, the results for different types of retailers—such as convenience stores, supermarkets, and hypermarkets—can be combined, thus making PMEHA useful for many different retail channels. The algorithm was successfully integrated into a new Retail Sales Information Sharing System (RSISS), and an innovative business model was created to insure that the RSISS could be run profitably once the system had been transferred from a non-profit context into the private sector.
Keywords: Market Size Estimation, Retailing, POS Data Analysis, Joint Sales Information System, Heuristic Algorithm
1. Introduction
Sales information always plays an important role in decision-making related to future sales, marketing, and inventory policies. The new marketing channels that have appeared in recent years—convenience stores, hypermarkets, and on-line shopping websites—give consumers more alternatives for their shopping. Such new channels for retail goods not only allow consumers to shop more conveniently and in a greater variety of places, but also intensify the competition among retailers. In an effort to better respond to market conditions, retailers have begun to collect massive amounts of data from their customers, ranging from basic sales information such as point of sales (POS) data to payment methods and even to personal data.
In this information-gathering effort, Wal-Mart is the leader among retailers. This company has invested large amounts of money and effort in order to improve the information system that supports their retail data analysis process. The supply chain tool CPFR (Collaborative, Planning, Forecasting, and Replenishment) (Fliedner, 2003) was developed and implemented to facilitate Wal-Mart’s attempts to synchronize the actions in all the segments of its supply chain, including distribution and retail activities. Wal-Mart’s managers turned to Information Technology and Data Warehousing to enhance their ability to manage stock, and their data warehouse system is now able to store 65 weeks of data—including inventory, forecasts, demographics, markdowns, returns and markets—organized by item, by location, and by date (Foote et al. 2001). The Japanese retailer, 7-Eleven Japan, has improved its understanding of what drives the demand for the 3000 items most sold every day by obtaining demographic and POS data for its base customers (Kopczak et al. 2003). With such a vast amount of data and a reactive supply chain that re-supplies stores three times a day, 7-Eleven Japan has achieved the highest sales per square foot in Japan’s convenience-store industry.
Kopczak et al. (2003) found that investing in better demand information in order to identify shifts in consumer demand is very important for improving supply chain decision-making. However, analyzing the data collected from the different channels has become a major issue in the retail industry due to lack of analysis tools and knowledge. Wal-Mart and 7-Eleven Japan are still trying to figure out how to capitalize on the vast amount of POS data available to them through their data warehousing system and how best to use their demand-based information management systems (Foote et al. 2001).
In the past, retail market and consumer research has generally focused on a specific topic related to an individual project (Andreasen 1985; Rapp et al. 1989). However, this type of research ignored the issues connected to the supply-demand environment and the
relationship of marketing activities among different chain stores. Research into Marketing Research Systems (MRS) (Curry 1989) and Marketing Information Systems (MKIS) (Amaravadi et al. 1995) arose to remedy this lack. Li et al. (1993; 1995; 2001) tracked the development of MKIS in the Fortune 500 companies over 20 years. They concluded that MKIS has matured, becoming more and more complicated, but that marketing managers were still unsatisfied with the reports and information provided by such systems. Li et al. (2001) also tracked the development of MKIS in Taiwan’s top 1000 companies and found similar results.
Among all the value-added information that can be produced by MKIS, sales forecasts and estimation have traditionally been the most common and the most important (Li et al. 1993; 1995; 2001). Higby et al. (1991) found that 66% of MKISs provided support for sales estimations. A similar conclusion was drawn by Li et al. (1993; 1995; 2001). However, building an MRS or an MKIS not only requires a huge investment in terms of manpower and funding, but also a commitment to continual hardware and software upgrades due to the rapid progress in information technology (IT). No doubt for this reason, it is still quite common to find that sales estimation was based on the intuition of the company executives, sales people, or industry analysts (Foote et al. 2001; Shrieber 2005).
Based on the above reviews, sales estimation information is one of the most important value-added elements provided by MRS and MKIS. In the late 90s, Gordon (1998) reported that Duracell, the world’s leading alkaline battery manufacturer, determined its market size by constantly evaluating six different statistical models. In fact, estimation and forecasting data can come from many different sources (Chase 1993; Gordon 1998): internal (e.g., point-of-sales and booking data) and external (e.g., retail market data purchased from marketing research organizations, such as AC Nielsen and IRI). In general, basic transaction data like POS include not only the time, place, brand, quantity, and amount of each individual sale but also provide the basis from which further logistics strategies and inventory policies can be developed.
Kiely (1999) found that such POS data are best suited to forecasting within a demand planning system, allowing supply chain plans to be synchronized. If POS data is not available, aggregated POS information has been found to be the next best data stream for forecasting consumption. Data about market size and growth rates are also important in forecasting and demand management (Chase 1993) because for example, it is easier to evaluate the effect of forecasting errors if the company can clearly identify the market size. However, due to the lack of capital, human resources, and/or computer capacity, not all retailers are able to benefit from information technology and even those that are using IT are still only working with their own sales data. Though Chase (1993) did find that some marketing consulting organizations, such as AC Nielsen and IRI, had made some effort to
integrate sales data from different sources in order to provide market information that would help retailers project sales demand, prior to the development of the algorithm presented in this paper, the different data-acquisition formats used by retailers made it very difficult to integrate their sales data in a helpful manner.
The rest of the paper is organized as follows. Section 2 describes the problem. Section 3 develops our market estimation heuristic algorithm. Section 4 demonstrates the solution process of the heuristic algorithm for a simple case. Section 5 shows how a sampled POS database is constructed and how our market estimation heuristic algorithm is implemented. Finally, Section 6 offers our conclusions and our suggestions for the future research.
2. Problem Description
For many years now, retail channels all over the world have been dominated by such chain stores as Wal-Mart, Carrefour, 7-Eleven, and Cosco. These retail chains have opened stores everywhere, even in the remotest areas. However, when they “go global”, even such giants face challenges when it comes to analyzing their markets in the different regions where they set up, with market estimations and sales forecasting being the two most important issues. What is true for the giants is true industry-wide.
The retail industry has come to recognize the importance of POS data and has begun to use computer technology to collect and analyze several aspects of this data. In general, POS data includes not only the time, place, brand, quantity, and amount of each individual sale, but also provide the basis from which future logistics strategies and inventory policies can be developed. Given a rapidly changing and complex environment, it is important for retailers to apply more advanced managerial decision-making models and tools to POS data in order to generate better value-added information. However, merging the POS data from different retail chains is quite difficult because retailers tend not to share their sales data with their competitors. In addition, collecting and storing sales information for all the retailers is a long-term, continuous effort.
This study is examines the possibility of producing individual sales estimations for different markets in different regions using a combined database containing continuous, long-term samples of POS data from different retail chains. There are several difficulties involved, mostly due to the wide variety of factors that can influence the data, including store location and store size as well as the number and variety of items sold, to name but a few.
Geographically speaking, most convenience stores in Asia are located in urban areas, and most supermarkets or hypermarkets are located in suburban areas. In Japan, almost 60% of all convenience stores are located in the metropolitan areas of Tokyo, Kyoto, and Osaka. Convenience stores are not limited by regulations. They can be situated inside
schools or business buildings, or be coupled with gas stations or highway rest areas. These different locations cater to different types of consumers, and thus sell different items and produce different sales figures. For instance, stores located in school zones cannot sell cigarettes or alcohol, while stores in other zones are not restricted in this way. To study these demographic differences, in this study convenience store locations have been divided into four typical zones: school, business, residential, and business-residential. Supermarkets or hypermarkets, unlike convenience stores, are mostly built in the suburbs, and the size of the store can vary from 20 square meters to several thousands square meters depending on the conditions. These differences in square footage affect the numbers of items carried and sales figures for each item. Thus, instead of grouping super/hypermarkets by zone type, super/hypermarkets have been grouped according to size.
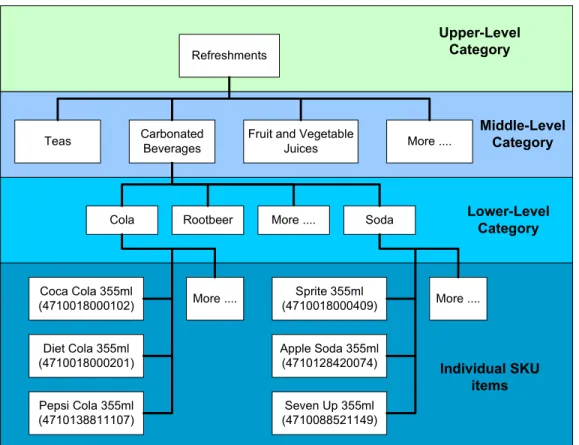
The items carried by the various chain stores also differ according to the type of store: a convenience store carries over 4000 SKU (stock keeping unit) items, a supermarket carries over ten thousand SKU items, and a hypermarket, an average of forty thousand SKU items. Some items are seasonal or regional. In order to aggregate similar results, items are grouped into several category levels (e.g., upper, middle, and lower). For example, “Coca-Cola 355c.c.” is classified as “cola” in the lower-level category, as a “carbonated beverage” in the middle-level category, and as a “refreshment” in the upper-level category (Figure 1). The middle-level category, “carbonated beverage”, also includes “Sprite 355c.c.”, but this item is classified as a “soda” in the lower-level category.
As data from different types of retail chains are included in the database, the variety of products increases; the store sizes and promotional activities can also differ significantly. In addition, depending on store location, sales figures can be quite different. A busy 7-Eleven store near a train station can produce US$200,000 in sales per month, for example, while the average for an individual store is only US$20,000. The convenience store chain, 7-Eleven, has over 25,000 stores worldwide and each store carries more than 4000 SKUs (stock keeping unit) Because multiple scales are possible given such wide variations, random sampling cannot be used. For this reason, when providing sales information for the database, convenience store chains need to select stores of different scales in order to balance the differences among sampled stores.
A graphic illustration of the sales estimation problem considered in this study is shown in Figure 2. As shown, the market estimation of each individual item each month is computed based on the sampled POS data collected from the retail chains. This market estimation can be depicted as a global amount or can be broken down to reflect different perspectives. It can highlight individual items or different levels in the item family architecture, or it can reflect the total market or the market in different areas. In addition, convenience store estimations can be analyzed by zone, and super/hypermarket estimations
can be analyzed by store size. For example, the estimated convenience store sales of “Coca-Cola 300ml” can be shown as a global figure for all stores, or a figure for the stores in the “Asian Pacific” area, or for just those in “School” zones; the estimated supermarket sales of “Coca-Cola 300ml” can be shown globally, for the “Asian Pacific” area, or for “Small” supermarkets. Alternately, the estimation could also reflect the three levels in the item family architecture, in this case, figures for “Cola”, “Carbonated beverages”, and “Refreshments”.
In the past, this problem has usually been solved using statistical forecasting and prediction techniques, such as linear regression, moving average, and exponential smoothing, to name a few (Peterson 1996; Sanders et al. 1994; Taylor 2004; Wilson et al. 2005). However, most of these forecast methods are limited to the analysis of the time-series data. Such statistical forecasting methods cannot be used to solve this problem in this study, which deals with cross-sectional data. In addition, certain methods for predicting market size at each time period (cross-sectional data analysis and estimation) are not suitable for this problem because the sampling process here is not random and the population does not fit the normal distribution, which are the two most important assumptions in the prediction methods (Sanders et al. 1994; Taylor 2004; Wilson et al. 2005).
According to Filedner (2001), a hierarchical forecasting (HF) methodology would be an innovative way to accommodate varied needs in a complex environment. This HF process combines “bottom-up” and “top-down” techniques to produce forecasts for individual items and for families of items. The hierarchical structure of several item levels used in the HF process is very similar to the category structure of items, geographic zones, and store size described above. Since the traditional statistical forecast methods (e.g., linear regression, exponential smoothing, and moving average) are not well suited this problem, we developed a market estimation heuristic algorithm that adopts the concepts of the HF process to achieve the goal of this study. This algorithm is presented in the next section.
3. The Estimation Algorithm
The HF process described by Fliedner (2001) is often used to provide forecast information based on a product schema that groups items into product families. An example of such a schema is shown in Figure 1. In this study, we adopt the HF process, combining “bottom-up” and “top-down” concepts to estimate market sizes in three dimensions, with each dimension having a three-level hierarchy as illustrated in Figure 3. The estimation algorithm calculates the market size for each individual item in each zone
of each geographic area for each store size of each type of retailer. To do so, the algorithm summarizes sales data from the sampled POS data, collects the data published each month by the government, and defines chain store references for those chains that have no sampled POS data for certain zones of certain areas. With these input data, the estimation algorithm uses modified “bottom-up” and “top-down” prorating procedures (Fliedner 2001) to compute the estimated market size for each item.
3.1 Input Data Evaluation Method
The main difficulty with the problem in this study is lack of information: the POS database does not have complete POS data from every retailer store. In addition, the revenue and profit information needed to calculate the estimation are unavailable due to the competition that exists between the different retailers. This missing information is an obstacle to reliable estimations of overall market size. In order to continue the estimating process despite this missing data, we propose the following evaluation mechanism for computing two important ratios: P(r), the percentage of the total sales of chain r at the sampled stores; and W(r, a), the percentage of total sales of chain r occurring in area a. The first ratio will be used as the denominator when estimating the total sales of chain r for each item, and the second will be used to estimate the sales of chain r for each item in each area.
Evaluation of P(r): The total sales figure for the sampled chain r stores can be computed every month from the combined POS database. The total revenue of chain r can also be obtained from the companies’ monthly financial reports. However, the revenue generated from items such as take out foods (e.g., box lunches, rice balls) and fee-collecting services (e.g., telephone bills, electricity bills) must be excluded from total revenues because these items are not SKU items. Let δ% be the percentage of revenue coming from SKU item sales, calculated using a linear average procedure. Therefore, for chain r, P(r) is equal to the total sales figures for the sampled stores divided by δ% of the total revenues. For example, the total sales figures for the sampled stores in chain r is US $45 million and the total revenue for chain r is US $4,186.875 millions with δ% = 80%. Thus, P(r), or the percentage of sales at the sampled stores in terms of total chain r sales, is equal to 45 million / (4,186.875 million * 0.8) = 1.343484%.
Evaluation of W(r, a): Based on historical POS data, the sales of a store located in area a is about qa% less than the overall average sales. The number of stores from each chain in each area is public information. Therefore, W(r, a) is the ratio of the weighted number of stores in area a divided by the weighted sum of the number of stores in all areas, where the weight for area a is (1 − qa%). For example, the number of chain r stores
and south sectors. Assuming that qnorth% is 0%, qcenter% is 15%, and qsouth% is 15%, then
W(r, a) = 1385 / (602 * 85% + 670 * 85%) = 56.16%. Under the same assumptions, W(r, center) = 20.75% and W(r, south) = 23.09%. In other words, the sales of the chain r stores
in the north sector constitute 56.06% of the total sales of chain r, while the sales of chain r stores in the center and south sectors are 20.75% and 23.09%, respectively.
These two important ratios are used in the market estimation heuristic algorithm presented in the following subsection.
3.2 POS Market Estimation Heuristic Algorithm (PMEHA)
The algorithm is called POS Market Estimation Heuristic Algorithm (PMEHA) because it uses heuristic rules and sampled POS data to estimate the overall market information for each area. However, the reality of the situation is that some chains cannot provide sampled POS data for stores in certain areas. To remedy this lack, a reference chain and a reference area are assigned to those chains that cannot provide real data. In addition, since the combined POS database stocks only sampled sales data from retailers, in some cases the estimation must rely on public data (e.g., the numbers of stores for each chain in each area). Information, such as total number of sampled stores and the sales figures for each item or for each first-layer category for each chain in each area, is acquired and summarized monthly, following reception of the sampled sales data from the various retailers.
To facilitate understanding of PMEHA, three important assumptions related to “bottom-up” and “top-down” prorating procedures must first be explained:
1. The sales patterns of the items belonging to the same lower-level category are assumed to be similar. Thus, the same percentage of total sales can be applied to the items in the same lower-level category for each family in each chain in each area.
2. The sales patterns of same-size stores in the same chain in the same area are assumed to be similar, which implies that the average sales figures for these stores are also similar.
3. The sales patterns of same-sized stores in the same chain in the same type of zone are assumed to be similar, which implies that the average sales figures for these stores are also similar.
The seven steps of the PMEHA are listed below:
(P1) Calculate the average sales for each store of each chain.
(P2) Determine the average sampled sales of lower-level category items for each chain in each area.
(P3) Calculate the percentage of the total sales figures for each lower-level category for each chain in each area, using a normalization mechanism.
(P4) Derive the adjustment factor of the total sales figures for each lower-level category for each chain in each zone, using a normalization mechanism.
(P5) Calculate the estimated total sales figure for each item for each zone and each area.
(P6) Add together the estimated total sales figures for each lower-level, middle-level, and upper-level category in every zone and every area.
(P7) Perform a cross analysis among the different types of retailers.
PMEHA must deal with three potential difficulties: 1) some chains can not provide sampled POS data for stores in certain areas, but their sales must nonetheless be taken into consideration; 2) customer behavior with regard to individual items varies greatly from area to area, and sales figures should reflect this difference; and 3) the restrictions on the items carried by stores in different zones vary, and sales figures should reflect these variations. Of the seven steps in PMEHA, steps (P1) to (P4) are crucial to resolve these difficulties, and thus are explained in detail in the following paragraphs.
To take care of the first difficulty, PMEHA (P1) calculates the average sales for each store in each chain. This average is necessary because, although some chains might not provide sales information from the stores in all areas, the sales in those areas still have to be included in the estimation by substituting the sales of a reference chain and a reference area for the missing information. However, all chains are not on the same scale; thus to adjust for the differences in scales, the average sales for each store in each area for each chain must first be determined. To do this, the total sales of the sampled POS data for chain r are divided by P(r) to obtain the total sales for each chain. Then, the total sales of each chain are multiplied by W(r, a) to obtain the total sales of chain r in area a. Finally, the total sales of chain r in area a are divided by the total number of chain r stores in area
a to obtain the average sales figures for each chain r store in area a.
PMEHA (P2) uses the results of (P1) to determine the sales in all geographic areas for all chains, including sales in those areas for which some chains do not provide sales information. For these areas, the reference area of the reference chain is used, but taking differences in customer behavior between the different areas into account. For instances, the sales of “Tea with milk” in northern Taiwan is 1.6 times the amount of such sales in southern Taiwan, while the sales of “Sorghum Liquor” in the north is only half the sales of this item in the south. If the majority of the sampled POS data were to come from the stores located in the north, the estimations of the overall market size for “Tea with milk” or “Sorghum Liquor” in Taiwan would be distorted: 1.6 times greater for the first product and 50% less for the second. Hence, it is necessary to take consumer behavior into account.
Still, computing the average for each individual item involves an enormous amount of data. A total of 100,000 active items in 3 areas for 6 chains would mean over 1,800,000 data elements. In addition, variations in POS data can disguise true customer behavior because items in the same category may be subject to the same customer preferences and can substitute for each other. For example, customers who want to buy “Green Tea Drink” (GTD) may switch from brand A “GTD” to brand B “GTD”, but not from “Green Tea Drink” to “Cola.” In order to reduce the calculation effort and to capture real customer behavior, the lower-level categories are used instead of individual items to compute the average sampled sales of the lower-level category for each chain in each area. To obtain this average, PMEHA computes the ratio of average store sales of chain r in area a compared to the average store sales of the reference chain and the reference area and adjusts the ratio according to the number of stores sampled for chain r and the reference chain. PMEHA then computes the sampled sales figures for lower-level category j of chain
r in area a by multiplying the above ratio by the total sampled sales for the lower-level
category j of the reference chain in the reference area.
To deal with the difficulty related to item and zone, PMEHA (P3) uses W(r, a) ratio described in section 3.1. This ratio can be adjusted to take both item and zone into account. For example, W(r, North) = 50% indicates that half of chain r sales occur in the north. However, the percentage of the sales of chain r in the north for individual items, such as “Coca-Cola 300ml”, is 65%. In order to obtain 65% for “Coca-Cola 300ml” instead of the global figure of 50%, the differences among the items must be identified. For the same reasons mentioned above, calculating the percentages of individual items is difficult. Since products in the same lower-level category possess similar characteristics, this percentage can be computed using the lower-level categories. To do so, PMEHA calculates the percentage by multiplying W(r, a) by the ratio of the sampled sales figures for lower-level category j of chain r in area a divided by the total sampled sales for lower-level category j in all areas. However, the sum of the percentages of each lower-level category for each chain in all areas might not be equal to 1 and thus may have to be normalized.
To take the type of zone into account, PMEHA (P4) derives an adjustment factor from the total sales figures for each lower-level category of each chain in each zone. The stores in the different zones are subject to various regulations with regard to the items they carry, and the sales figures must reflect the effect of these regulations. For example, since stores in school zones cannot carry cigarettes or alcohol, these items should not be included in the sales figures of school zone stores. To compute this adjustment factor, PMEHA (P4) calculates a ratio for each chain by multiplying two proportions: the number of stores in each zone divided by total number of stores; and the sampled sales figures for lower-level category j of chain r in zone z divided by the total sampled sales for lower-level category j in all areas.
Given the percentage of the total sales for each lower-level category of each chain in each area and the adjustment factor for the total sales figures for each lower-level category for each chain in each zone, PMEHA (P5) can then calculate the estimated total sales for each item in each zone and each area by dividing the total sampled sales figures of chain r for each item in each zone by P(r) and multiplying the percentage and the adjustment factor by the result to obtain the total sales of each chain for each item in each zone and in each area. The algorithm (P5) adds the total for each chain together to obtain the total sales figures for each item in every zone and every area. To obtain the total sales for each lower-level, middle-level, and upper-level category in every zone and every area, PMEHA (P6) simply adds the results from (P5) for all items belonging to each lower-level, middle-level, and upper-level category in every zone and every area. If there are more than one type of retailer providing sampled POS data, the same analysis dimensions have to apply to both convenience stores and supermarkets or hypermarkets in the cross analysis. Thus, PMEHA (P7) eliminates unique factors, such as zone type and store size, and sums up the total sales of each item in each area, using Σk (sales estimated for retailer type k in
each area) / ȕk, where ȕk is the percentage of the sales of retailer type k included in
database.
This algorithm is intended to be run once each month. The estimated sales data from the past months are stored in history files. In the following section, a simple market estimation problem is used to demonstrate the PMEHA solution process.
4. The PMEHA Solution Process
To demonstrate the PMEHA solution process, a simple market estimation problem is described below, using the data given in Tables 1, 2, 3, and 4. In this example, chain r1 provides POS data for 20 stores, whose sales figures total $9,000,000 (i.e., 5% of the total sales of chain r1 or P(r1) = 5%). To use PMEHA to solve this problem, the average sales figure for each store in chain r1 in the north section computed in step (P1) is $600,000. The computational results for the center and south sectors are listed in Table 2.
As shown in Table 2, the average sales figures for each store in chain r1 in the south equal $540,000, while the average sales figures at each store of chain r2 in the north equals $360,000. If r1 provides sales information for 20 stores in the north and r2 provides data for 10 stores in the south, the ratio computed by dividing the average store sales of chain r in area a by the average store sales of the reference chain and the reference area is 3. This ratio implies that if chain r1 provides sales information for 20 stores in the south, the sales will be 3 times the sales at the 10 sampled stores in chain r2 in the south. Finally, according to (P2), if the total sales of lower-level category “Fruit Tea” at the sampled
stores in chain r2 in the south are $10,000, the sampled sales of lower-level category “Fruit Tea” for chain r1 in the south are $30,000.
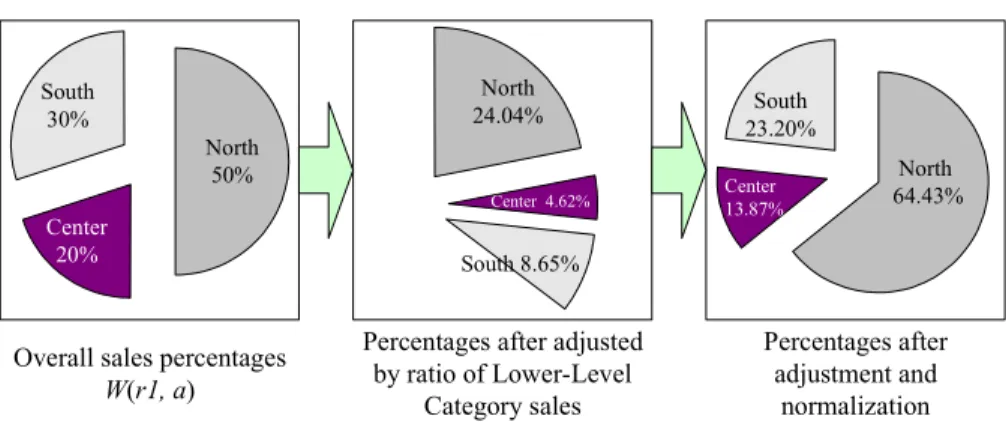
As shown in Table 2, the total sales figure for the lower-level category “Fruit Tea” at all the stores in chain r1 equals $104,000. Before normalization, the percentage of the total sales of the lower-level category “Fruit Tea” for chain r1 in the North is 24.04%, with the percentage for the Center being 4.62% and the South being 8.65%. The percentages of sales of “Fruit Tea” for chain r1 in the areas North, Center and South total 37.31%. Thus, according to (P3), the percentage for the north—after a normalization procedure designed to set the sum of percentages equal to 100%—is 24.04% / 37.31% = 64.46%. (See Table 2 for the percentages for the Center and South.) The results of the computation process are shown in Figure 4, which depicts the changes in the percentages: from W(r1, a), to the ratio adjusted for lower-level category sales, to the percentages after normalization.
The sales figures for the lower-level category “Fruit Tea” at all the stores of chain r1 total $52,000, with a total number of stores of 320 (Table 3). According to (P4), the percentage of sales for the lower-level category “Fruit Tea” in chain r1, adjusted by scattering the stores in each zone, is equal to 0.3053. The adjustment factor for the school zone is (120 / 320) * (1 / 0.3053) = 1.2283, which implies that the sales of “Fruit Tea” should be 22.83% higher than the average sales figures. The same reasoning can be applied to the data for other zones, and the results are shown in Table 3.
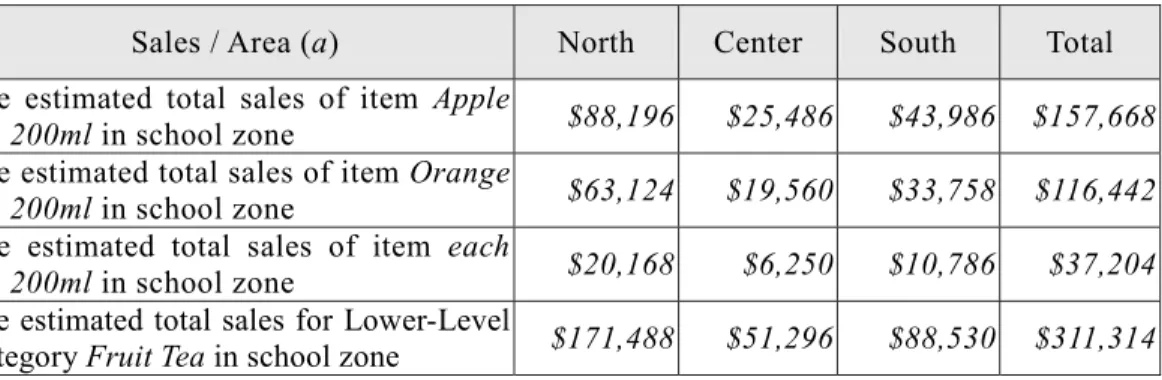
Based on the data in Tables 1 to 5,and according to (P5), if only two chains carry and sell the item “AA apple tea 200ml”, the total sales figure of item “AA apple tea 200ml” in all chain r1 stores in a school zone in the North is computed as follows: ($5,400 / 5%) * 1.2283 * 64.43% = $85,470. The same item in the same zone and area for all chain r2 stores would be ($3,600 / 15%) * 1.1123 * 10.21% = $2,726. Thus, the total sales figure for item “AA apple tea 200ml” in a school zone in the north is $85,470 + $2,726 = $88,196. (Please see Table 6 for the results for other areas.) In addition, if only three items—AA apple tea 200ml, BB orange tea 200ml, and CC peach tea 200ml—are classified in the lower-level category, “Fruit Tea”, the estimated total sales of the lower-level category “Fruit Tea” in a school zone in the North would be $88,196 + $63,124 +$20,168 = $171,488.
Finally, assuming that 95% of convenience stores and 90% of super/hypermarkets provide POS data for all areas (i.e., ȕcvs = 95% and ȕmkt = 90%) and assuming that the estimated total sales in super/hypermarkets for the lower-level category “Fruit Tea” in the North is $180,271, then the estimated total sales of the lower-level category “Fruit Tea” in the North would be ($171,488 / 95%) + ($180,271 / 90%) = $380,815.
To prove the feasibility of PMEHA, we built a combined sampled POS database to be used within a new business model, as described in the next section.
5. A Retail Sales Information Sharing System (RSISS)
While PMEHA was still under development, the Computer and Communications Research Laboratories (CCL) of the Industrial Technology Research Institute (ITRI) in Taiwan built a combined sales information analysis system, called “Retailing Sales Information Sharing System” (RSISS), in an attempt to prove that the algorithm was feasible. Launched in May 2000, this system was designed to collect and sample POS data from retailers throughout Taiwan. CCL/ITRI maintained RSISS and provided the regular summary reports and graphic analyses for individual items and categories across regions and time horizons using a website that was set up for retailers who participated in the project.
Three major types of grocery retail chains exist in Taiwan: convenience stores, supermarkets, and hypermarkets. (Old-fashioned grocery stores exist only in rural areas and constitute only a very small part of the Taiwan grocery retail market. They do not usually have IT capability and are unable to provide digital POS data for RSISS. Thus, they were not included in this project.) Six major convenience store chains—7-Eleven, FamilyMart, Hi-Life, Circle K, Niko Mart, and SJ Express—hold about 95% of the convenience store market in Taiwan; at the project’s launch in May 2000, these chains agreed to participate in the RSISS. The major players in the supermarket sector— Wellcome, SunChing, SinNun, Da-Tung—hold over 90% of supermarket sales in Taiwan, and these companies joined the RSISS project a year later in May 2001. Negotiation with the hypermarket sector was undertaken, and the Da-La hypermarket began to provide POS data for testing at the end of 2002.
By the end of May 2001, there were more than 6,250 convenience stores, 570 supermarkets, and 100 hypermarkets in Taiwan. On average, each convenience store carried over 4000 SKU items, each supermarket carried more than ten thousand SKU items, and each hypermarket carried forty thousand SKU items. Each convenience store chain agreed to sample POS data for 20 stores and each supermarket chain agreed to provide POS data for 10 stores, with most of the POS data came from the stores in the North of Taiwan. However, PMEHA was still under development. It didn’t launch until the end of 2001, and it wasn’t until several months later that it began to provide results to the retail chains. Consequently, three years into its tenure, this project was harshly criticized for not providing enough value-added information.
PMEHA was intended to provide valuable information to the retailers participating in the RSISS project. The retailers joining the project were highly interested and greatly satisfied once the preliminary results of PMEHA began to be distributed. However, the original sampled POS data did not constitute a sufficiently large database for PMEHA to
perform market size estimation. Therefore, new rules were set for the chains participating in RSISS, requiring them to provide more sampled POS data. Each convenience store chain agreed to sample POS data at 100 stores, while each supermarket chain agreed to provide POS data for all their stores, or at least 40 stores.
CCL/ITRI divided Taiwan into three geographic areas—North, Center, and South—and discovered that more than 60% of the retail stores located in Taiwan are in the north. After negotiation, each convenience store chain agreed to provide sales information from 60 stores in the north, 20 in the center, and 20 in the south, except Hi-Life, Circle K, and SJ Express who did not have enough stores in each area. Supermarket chains agreed to supply sales information from 20 stores in the north, 10 in the center, and 10 in the south, providing that the chain had enough stores in each location. Random sampling could not be used since the scales of the convenience store chains varied significantly. To balance the differences among the sampled stores, CCL/ITRI required the samples to be taken from the stores whose sales were in the top 50% of all the stores in each convenience store chain. Because some items are seasonal or regional, CCL/ITRI developed a standard three-level product family architecture for the items in the RSISS. This architecture was used in this study. (See Figure 1 for an example of this product family architecture.)
The CCL/ITRI’s assigned task was to estimate the market size for every individual SKU items using the sampled POS data provided by the retail chain stores. It was for this purpose that PMEHA was built and eventually incorporated into the RSISS. (The gray box in Figure 5 shows the place of the estimation algorithm within RSISS.) The RSISS was built in an MS Server 2000 environment with MS SQL as database server and MS .net framework as the development tool. The system was built and tested on a PC server with Pentium IV 2.8 GHz CPU and 2GB memory. The testing data comes from convenience stores and contains more than 2.4 million data elements. The computation time for each month’s estimation is less than 30 minutes, but the storage space required is enormous. The sales data and estimation results for a 2-year period take up 40 GB of hard disk space.
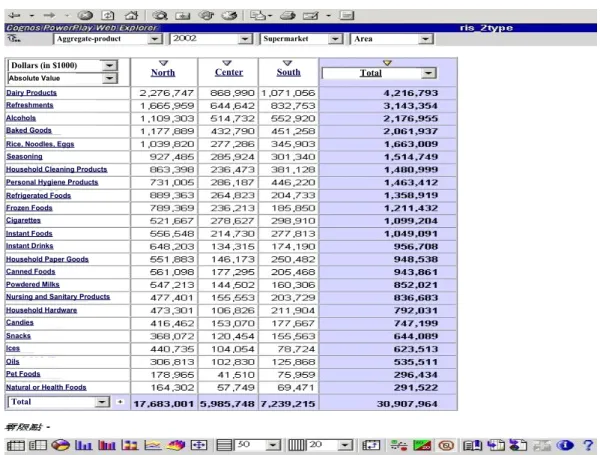
After the PMEHA prototype was finished and implemented, twenty-four months of convenience store estimation were tested for all items for all months. Two On-Line Analysis Procedure (OLAP) functions—Drill down and Sum up—were added to the PMEHA prototype so that users could query the estimation from different perspectives, such as item, product category, area, zone, and/or store size. The PMEHA prototype included web enabling capability so that users could easily access the results through Internet. Figure 6 provides a sample view of the graphic interface. Other than the example in Figure 6, the user interfaces and PMEHA results cannot be shown here because of the sensitivity and confidentiality of the sales data. The information shown in Figure 6 represents the estimations for the upper-level category for supermarkets (in increments of NT $1000.) For example, the estimations in the first row are for “Dairy Products” in the
north, center, and south from 1/1/2001 to 6/30/2001; the total is given in the right-most column. This “Dairy Products” category was the number one upper-level category sold in supermarkets, while “Refreshments” were number one in convenience stores and “Household Cleaning Products” were number one in hypermarkets.
Although a verification procedure was carefully carried out, no public data existed at the time to validate the results of this estimation. Therefore, the estimation result was shown to the retailers participating in the RSISS project: convenience store chains, supermarket chains, and hypermarket chains. In June 2002, a meeting of CCL/ITRI, retailers, and manufacturers was scheduled to demonstrate the PMEHA estimation results. One reason for this meeting was to ask manufacturers to validate the estimation results. Although manufacturers could not provide detailed proof, they affirmed that 85% of the estimation was close to their idea of the market. These manufacturers were quite interested in obtaining the result of this estimation because there was no other source for retail census information with so many dimensions. For the first time, manufacturers were able to gain some insight into the local markets for individual products. For instance, sales of a famous brand of tea drink (200 ml) attained NT $600 million (more than 18 million US$) alone in convenience store market in 2002, and its biggest customer group was students, as shown by the high level of sales in school zones. The information also showed that competition in the tea drink market was fierce, with several large local brands competing in the school-zone convenience store market.
PMEHA was finally incorporated into RSISS on December 1, 2003 by CCL/ITRI, and on December 1, 2004, RSISS was privatized, creating a private consulting firm, which is a subsidiary of Trade-Van Information Services Co. The ultimate goal of the RSISS project was to create a unique business model for the long-term maintenance of RSISS. During the first phase of development, only retailers joined; they provided sampled POS data for RSISS and in turn were able to connect to the database and access the estimation information. After RSISS was privatized, Trade-Van Information Services Co. began collecting service fees from all these retailers. With such valuable information, the manufacturers were willing to pay, but the scale and level of services are still being negotiated by Trade-Van, the retailers, the local manufacturers, and the importers.
With the successful implementation of PMEHA and the privatization of RSISS, Trade-Van Information Services Co plans to extend the use of PMEHA to 3C retail chains in the next few years. In the future, Trade-Van also hopes to extend their RSISS service to other parts of the geographical areas in Asia, such as China and South/East Asia. Given the enormous degree of expertise gained while constructing RSISS, convincing retailers in those regions to form a combined POS database in order to obtain valuable market size estimation through RSISS should be fairly easy.
6. Conclusion
This paper describes the development and history of an algorithm, called POS Market Estimation Heuristic Algorithm (PMEHA), used to estimate the market size of grocery products based on sampled POS data provided by retailers. Sampled POS data refers to the POS data from only a small portion of the retailer chain stores. Adding certain publicly accessible data, such as number of stores per chain in each area or in each zone, to the sampled sales information allows the estimation heuristic algorithm to calculate market size information. A prototype of the algorithm was built and implemented as part of the RSISS, which was officially launched and became accessible to participating retailers on December 1, 2003.
In the future, it is expected that the PMEHA estimation information can be further processed to provide more value-added information. One of the extensions will allow time-series analysis by incorporating cross-sectional estimation with forecast models and economic/environmental variables. From current estimation results, it is clear that zone, area, and item classification all have an impact on sales. For example, tea drink sales in school zones reflect a significant seasonal effect, while coffee sales demonstrate no seasonal effect at all. Therefore, different forecasting models should be used for items of different classifications, or in different zones and/or areas. Another future project is to extend the use of this estimation algorithm to other retail industries, such as 3C or fashion, or to extend the services to other regions of Asia, such as China and South/East Asia.
References
1. Andreasen, A. R., “Backward Market Research,” Harvard Business Review, 1985, pp. 176—182.
2. Amaravadi, C. S., S. Samaddar, and S. Dutta, “Intelligent Marketing Information Systems: Computerized Intelligence for Marketing Decisions Making,” Marketing Intelligence & Planning, Vol. 13, No. 2, 1995, pp. 4—13.
3. Curry, D. J., “Single-Source Systems: Retail Management Present and Future,” Journal of Retailing, 1989, pp. 1—20.
4. Chase, C. W., “Ways to Improve Sales Forecasts,” Journal of Business Forecasting Methods & Systems, 1993, Vol. 12, No. 3, pp. 15—17.
5. Foote, P. S. and M. Krishnamurthi, “Forecasting Using Data Warehousing Model: Wal-Mart’s Experience,” Journal of Business Forecasting Methods & Systems, 2001, Vol. 20, No. 3, pp. 13—17.
6. Fliedner, G., “Hierarchical Forecasting: Issues and Use Guidelines,” Industrial Management Data Systems, 2001, Vol. 101, No. 1, pp. 5—12.
7. Fliedner, G., “CPFR: an Emerging Supply Chain Tool,” Industrial Management Data Systems, 2003, Vol. 103, No. 1, pp. 14—21.
8. Gordon, R., “A Role for the Forecasting Function,” Journal of Business Forecasting Methods & Systems, 1997/1998, Vol. 16, No.43, pp. 3—7.
9. Higby, M.A. and B. N. Farah, “The Status of Marketing Information Systems, Decision Support Systems and Expert Systems in the Marketing Function of U.S. Firms,” Information & Management, 1991, Vol. 20, pp. 29—35.
10. Kiely, D. A., “Synchronizing Supply Chain Operations with Consumer Demand Using Customer Data,” Journal of Business Forecasting Methods & Systems, 1998/1999, Vol. 17, No. 4, pp. 3—9.
11. Kopczak, L. R. and M. E. Johnson, “The Supply-Chain Management Effect,” MIT Sloan Management Review, 2003, Vol. 44, No. 3, pp. 27—34.
12. Li, E. Y., H. G. Chen, and J. Roan, “Marketing Information Systems Usage in Taiwan’s Top 1000 Companies,” Journal of Computer Information Systems, 2001, Vol. 41, No. 2, pp. 85—94.
13. Li, E. Y. and R. McLeod, “Marketing Information Systems in the Top U.S. Companies: A Longitudinal Analysis,” Information & Management, 1995, Vol. 28, pp. 13—31. 14. Li, E. Y., R. McLeod, Jr., and J. C. Rogers, “Marketing Information Systems in the
Fortune 500 Companies: Past, Present, and Future,” Journal of Management Information Systems, 1993, Vol. 10, No. 1, pp. 165—192.
15. Li, E. Y., R. McLeod, Jr., and J. C. Rogers, “Marketing Information Systems in Fortune 500 Companies: A Longitudinal Analysis of 1980, 1990, and 2000,” Information & Management, 2001, Vol. 38, pp. 307—322.
16. Peterson, R. T., “An Analysis of Contemporary Forecasting in Small Business,” Journal of Business Forecasting Methods & Systems, 1996, Vol. 15, No. 2, pp. 10—12.
17. Rapp, S. and T. L. Collins, “Maxmarketing: The New Direction in Advertising, Promotion, and Marketing Strategy,” Plume Books, New York, 1989.
18. Sanders, N. R. and K. B. Manrodt, “Forecasting Practices in US Corporations: Survey Results,” Interfaces, 1994, Vol. 24, No. 2, pp. 92—100.
19. Shrieber, J., “Demand Visibility Improves Demand Forecasts,” Journal of Business Forecasting Methods & Systems, 2005, Vol. 24, No. 3, pp. 32—37.
20. Taylor, B. W., “Introduction to Management Science,” Englewood Cliffs, N.J.: Prentice Hall, 2004.
21. Wilson, J. H. and B. Keating, “Business Forecasting,” Boston, MA: McGraw-Hill/Irwin, 2005.
Refreshments
Carbonated Beverages
Teas Fruit and Vegetable Juices
Cola Rootbeer Soda
Coca Cola 355ml (4710018000102) Diet Cola 355ml (4710018000201) Pepsi Cola 355ml (4710138811107) Sprite 355ml (4710018000409) Apple Soda 355ml (4710128420074) Seven Up 355ml (4710088521149) More .... More .... More .... More .... Upper-Level Category Middle-Level Category Lower-Level Category Individual SKU items
Figure 1: An Example of Product Family Architecture
Retailer Chain 1 sampled stores Retailer Chain 2 sampled stores Retailer Chain n sampled stores Sampled POS Database .... Estimating Model and Algorithm Public Data, Number of Stores and Total Revenue, from
External Sources Market Size Estimation for each product:
--Convenience Stores -- Area and Zones
-- Products and Classifications --Supermarkets/ Hypermarkets -- Area and Sizes
-- Products and Classifications --Total
-- Area
-- Products and Classifications
Estimation
Retail Market
Estimation Dimensions
Type of
Retailers Items Stores
Convenience Store Supermarket Hypermarket Upper-Level Category Middle-Level Category Lower-Level Category Area Zone Size
Figure 3: The Estimation Dimensions
North 50% Center 20% South 30% North 24.04% Center 4.62% South 8.65% North 64.43% Center 13.87% South 23.20%
Overall sales percentages
W(r1, a)
Percentages after adjusted by ratio of Lower-Level
Category sales
Percentages after adjustment and
normalization
Figure 4: Percentages after Adjusting for the Ratio of Lower-Level Category Sales
POS data from Retailers
Product Family Classification System
Automatic Data Importing System
Summary Reporting System PMEHA
Retail Sales Information Sharing System (RSISS)
Receive Electronic POS Data from retailers on-line Identify Product Family for all items
Perform data cleaning and error detection
Run market size estimation heuristic algorithm Produce on-line inquiry and summary reports
Dairy Products
Nursing and Sanitary Products Household Hardware Refreshments Alcohols Baked Goods Rice, Noodles, Eggs Seasoning
Household Cleaning Products Personal Hygiene Products Refrigerated Foods Frozen Foods Cigarettes Instant Foods Instant Drinks Household Paper Goods Canned Foods Powdered Milks Candies Snacks Ices Oils Pet Foods Natural or Health Foods
Total
Absolute Value Dollars (in $1000)
North Center South Total
Aggregate-product Supermarket Area
Figure 6: The Estimation Result for Supermarkets from 1/2002 to 6/2002 Table 1: The data for chain r1needed in step (P1)
Data / Areas (a) North Center South
W(r1, a) 50% 20% 30%
Total number of stores in the chain r1 in area a. 150 80 100 Table 2: The data for chain r1 computed in steps (P1), (P2), and (P3)
Data / Areas (a) North Center South Total Average sales figures at each store $600000 $450000 $540000 $1590000
Sampled sales figures for Lower-Level
Category Fruit Tea in each area $50000 $24000 $30000 $104000 Percentages for Lower-Level Category
Fruit Tea after adjusting for sales
figures
24.04% 4.62% 8.65% 37.31%
Percentages for Lower-Level Category
Table 3: The data for chain r1 computed in step (P4)
Data / Zones (z) School Business Residential Residential Business- Total Sampled sales figures for Lower-Level
Category Fruit Tea in each zone $24000 $15000 $9000 $4000 $52000 Total number of stores in each zone. 120 100 60 40 320
Adjustment factors for Lower-Level
Category Fruit Tea after normalization. 1.2283 1.0236 0.6142 0.4094 3.2755
Table 4: The data computed in step (P4)
Data / Chains (r) r1 r2
Sampled sales figures for item AA apple tea 200ml in school zone $5400 $3600
P(r) 5% 15%
Adjustment factors for Lower-Level Category Fruit Tea in school zone 1.2283 1.1123
Table 5: Percentages for Lower-Level Category Fruit Tea in each area needed in step (P5)
Chains (r) / Areas (a) North Center South
r1 64.43% 12.37% 23.2%
r2 10.21% 32.28% 57.51%
Table 6: The results computed in steps (P5) and (P6)
Sales / Area (a) North Center South Total The estimated total sales of item Apple
tea 200ml in school zone $88,196 $25,486 $43,986 $157,668
The estimated total sales of item Orange
tea 200ml in school zone $63,124 $19,560 $33,758 $116,442
The estimated total sales of item each
tea 200ml in school zone $20,168 $6,250 $10,786 $37,204
The estimated total sales for Lower-Level