國 立 交 通 大 學
環 境 工 程 研 究 所
碩士論文
硫酸還原菌降解 Fluorene 動力參數之研究
Fluorene Biodegradation by Sulfate Reducing
Bacteria: A Kinetics Study
研究生:廖偉志
指導教授:林志高 博士
Fluorene Biodegradation by Sulfate Reducing
Bacteria: A Kinetics Study
Student:Wei-Chih Liao
Advisor:Dr. Jih-Gaw Lin
A Thesis
Submitted to Institute of Environmental Engineering
College of Engineering
National Chiao Tung University
In Partial Fulfillment of the Requirements
For a Degree of
Master of Science
In
Environmental Engineering
August 2008
硫酸還原菌降解 Fluorene 動力參數之研究
研究生:廖偉志 指導教授:林志高 博士
國立交通大學環境工程研究所
摘要
多環芳香族碳氫化合物 (polycyclic aromatic hydrocarbons, PAHs) 在環境 中是一種具有毒性難以分解的污染物,所以從環境中去除 PAHs 是一個相當重 要的研究,而在許多的生物研究中 PAHs 已被證實可以在各種不同的厭氧條件 下被微生物降解。本研究是以硫酸還原菌 (sulfate reducing bacteria, SRB) 為優 勢菌的微生物族群來降解 Fluorene,以中央合成設計法 (central composite design, CCD) 進行批次式實驗操作條件的規劃,同時找出硫酸鹽以及微生物濃度的最 佳操作條件。再以最佳操作條件,改變 Fluorene 的濃度 (0-100 mg/L) 研究 Fluorene 對 SRB 的抑制。
實驗結果顯示以 SRB 為優勢菌的微生物族群可以利用 Fluorene 作為基 質而生長,而 Fluorene 的零階、一階降解速率常數分別為 0.21 mg/L-d 和 0.1/d。藉由反應曲面法 (response surface methodology, RSM) 找出硫酸鹽和微生 物濃度的最佳操作範圍以及發展出一個 Fluorene 去除百分比的二階模式,找 到最佳的操作點硫酸鹽濃度為 14.4 mM,微生物濃度為 37.8 mg/L,在此最佳條 件下 Fluorene 的降解百分比為 90%。
抑制實驗的數據以 Haldane’s equation 模式套配可得到動力參數 μmax、Ks
以及 Ki,其數值分別為 0.35/d、0.07 mg/L 以及 600 mg/L。由於本研究所使用 的營養鹽中含有酵母萃取物以及溶劑,微生物可以利用作為碳源使得無法在抑
制實驗中觀察到 Fluorene 對 SRB 的毒性影響,但是可以推測 Fluorene 的濃 度高於 600 mg/L 時會對 SRB 造成抑制。另外在螢光原位雜交法 (fluorescent in-situ hybridization, FISH) 的分析,可以證明 SRB 在實驗所使用的微生物族 群中為主要的優勢菌種,所佔的比例為 85%。
Fluorene Biodegradation by Sulfate Reducing Bacteria: A Kinetics
Study
Student: Wei-Chih Liao Advisor: Dr. Jih-Gaw Lin
Institute of Environmental Engineering National Chiao Tung University
Abstract
Polycyclic aromatic hydrocarbons (PAHs) are one of the most important contaminants released in the environment. Anaerobic degradation of PAHs has been demonstrated in several microcosm studies. In this study, anaerobic fluorene degradation by sulfate reducing bacterial enrichment culture was investigated. Subsequently, batch biodegradation experiments were designed using the central composite design (CCD) and carried out to estimate the optimum operating conditions of sulfate reducing bacteria (SRB) and sulfate concentrations. Biodegradation rates of fluorene were 0.21 mg/L-d in zero-order and 0.1/d in first-order kinetics.
Response surface methodology (RSM) was used to optimize the sulfate and biomass concentrations, and was used to develop a model for the responses. Applying the desirability function, the optimum conditions of sulfate and biomass concentrations were found as 14.4 mM and 37.8 mg/L, respectively. The highest fluorene removal percentage of 90% was observed at optimum conditions.
investigated over a range of initial fluorene concentrations (from 0 to 100 mg/L) using the Haldane’s model. The kinetics parameters obtained were μmax of 0.35/d, Ks
of 0.07 mg/L and Ki of 600 mg/L. Due to the addition of solvents (dichloromethane, N,N-dimethylformamide) and yeast extract in the PAHs biodegradation experiments, microorganisms grew using DMF and/or yeast extract which result no toxicity in the inhibition study. However, the fluorene biodegradation by SRB can be inhibited when fluorene concentration is higher than 600 mg/L. The FISH analysis showed that SRB was the major species in the enriched bacterial culture.
Contents
中文摘要... I Abstract ...III Contents ... V List of Tables... VII List of Figures ... VIII
Chapter 1 Introduction ...1
Chapter 2 Literature Review...3
2.1 Introduction to PAHs and Fluorene ...3
2.2 Environmental Fate of PAHs and their Problems in the Environment ...5
2.3 Anaerobic Biodegradation of PAHs ...5
2.3.1 PAHs Biodegradation under Sulfate Reducing Conditions ...8
2.4 Factors Influencing Biodegradation of PAHs ... 11
2.4.1 Concentration of Electron Acceptor ... 11
2.4.2 Biomass Concentration ...12
2.4.3 pH and Temperature ...12
2.5 Anaerobic PAHs Biodegradation Kinetics ...16
Chapter 3 Materials and Methods ...18
3.1 Introduction...18
3.2 Materials ...18
3.3 Incubation ...22
3.4 Experimental Methods and Design ...23
3.4.1 Treatability Study...23
3.4.2 Optimization Study ...25
3.4.3 Inhibition Study ...26
3.5.1 PAH Extraction ...27
3.5.2 PAH Quantification...27
3.5.3 Bacterial Cell Density Measurement ...28
3.5.4 FISH Analysis ...30
Chapter 4 Result and Discussion ...33
4.1 Enrichment of SRB ...33
4.2 Treatability of SRB Enrichment Culture ...35
4.3 Optimization Study ...39
4.3.1 Result of CCD...39
4.3.2 Response Surface and Contour Plot...44
4.3.3 Optimization of Fluorene Biodegradation ...46
4.4 Confirmation Study...46
4.4.1 Evaluation of Predicted Model ...46
4.4.2 Observations of FISH Analysis...51
4.4.3 Kinetics of Fluorene Biodegradation ...53
4.5 Inhibition Study...58
4.5.1 Biodegradation of Fluorene ...58
4.5.2 Inhibition Kinetics ...60
Chapter 5 Summary and Conclutions ...62
List of Tables
Table 2-1 Physicochemical properties of the 16 priority PAHs ...4
Table 2-2 Literature on anaerobic biodegradation of PAHs...7
Table 2-3 Factors influencing biodegradation of PAHs ...14
Table 2-4 Literature on anaerobic biodegradation of PAHs under sulfate reducing conditions. ...15
Table 3-1 Chemicals and solvents used in this study...20
Table 3-1 Chemicals and solvents used in this study (continued) ...21
Table 3-2 Experimental design for treatability study...24
Table 3-3 Ranges and levels of designed factors for CCD ...25
Table 3-4 Sequence of runs for CCD ...26
Table 3-5 Oligonucleotide probes used in this study ...32
Table 4-1 Experimental conditions and results of CCD for the optimization study ....40
Table 4-2 Sequential model sum of squares...40
Table 4-3 ANOVA for the predicted model ...42
Table 4-4 Optimized conditions for removal percentage of fluorene estimated by the desirability functions methodology...46
Table 4-5 Fluorene removal rates under anaerobic conditions ...55
List of Figures
Fig. 3-1 Experimental flowchart ...19
Fig. 3-2 Schematic diagram of incubation system...23
Fig. 3-3 Fluorene calibration curve...28
Fig. 3-4 Standard graph between MLVSS concentration and OD660...29
Fig. 4-1 Variation of fluorene concentration during incubation...34
Fig. 4-2 Variation of pH during incubation...34
Fig. 4-3 Variation of ORP during incubation ...35
Fig. 4-4 Biodegradation of fluorene by SRB enrichment culture ...37
Fig. 4-5 Variation of VSS (at OD660) during fluorene biodegradation...37
Fig. 4-6 Variation of sulfate concentration during fluorene biodegradation...38
Fig. 4-7 Variation of pH during fluorene biodegradation ...38
Fig. 4-8 Residuals versus fitted values plot for fluorene removal percentage...43
Fig. 4-9 Normal probability plot of residuals for fluorene removal percentage ...43
Fig. 4-10 Response surface (a) and contour plot (b) for removal percentage of fluorene vs sulfate and biomass concentration ...45
Fig. 4-11 Variation of fluorene concentration during biodegradation...48
Fig. 4-12 Variation of sulfate concentration during biodegradation ...48
Fig. 4-13 Variation of bacterial cell density during biodegradation ...49
Fig. 4-14 Variation of COD during biodegradation ...49
Fig. 4-15 Variation of pH during biodegradation...50
Fig. 4-16 Variation of ORP during biodegradation ...50 Fig. 4-17 Epifluorescence micrographs of bacteria (day 1). (a) DAPI stained cells, (b)
hybridization with probe EUB338 (same microscopic field with (a)), (c) DAPI stained cells, (d) hybridization with probe SRB385 (same microscopic field with (c)), (e) DAPI stained cells, and (f) hybridization
with probe SRB385Db (same microscopic field with (e))...52 Fig. 4-18 Biodegradation of fluorene. (a) Regression of concentration vs. time data
for zero-order kinetics, and (b) regression of concentration vs. time data for first-order kinetics ...54 Fig. 4-19 (a) Biodegradation of fluorene (b) two stage kinetics of fluorene
biodegradation...57 Fig. 4-20 Percentage removals of fluorene in the inhibition study...58 Fig. 4-21 Increase in VSS concentration (at OD660) in the inhibition study...60
Fig. 4-22 Specific growth rate as a function of the different initial fluorene
Chapter 1
Introduction
Polycyclic aromatic hydrocarbons (PAHs) are released into the environment from fossil fuel or other organic material combustion, the accidental spilling of oils, coal liquefaction and gasification, organic oil seepage, and surface run-offs from forest fires and natural geologic processes (Yuan et al., 2000). PAHs pose an environmental threat to human and animals due to their toxicity and potential carcinogenic effects, persistence in environment, resistance to microbial degradation, and high affinity for sediments and soils (Madsen et al., 1996; Coates et al., 1996). As a consequence, 16 PAHs have been identified as priority pollutants by the United States Environmental Protection Agency (US-EPA).
Aerobic biodegradation process has been found to be effective in the treatment of PAHs, while it is often quite expensive due to the need for aeration. Therefore, anaerobic biodegradation of PAHs is a promising alternative with lower cost to aerobic treatment in bioremediation process (Coates et al., 1996; Boopathy, 2004). In addition to the cost issue, anaerobic biodegradation is desirable because most of the real contaminated sites are under anaerobic environments (Boopathy, 2004; Chakaraborty and Coates, 2004). Previous studies have demonstrated that PAHs can be effectively degraded under sulfate reducing conditions (Coates et al., 1997; Chang et al., 2002; Rothermich et al., 2002). The most effective degradation rate of PAHs was observed under sulfate reducing conditions (Chang et al., 2002; Boopathy, 2004). But, only very limited studies have investigated the biodegradation of PAHs by sulfate reducing bacteria (SRB) as a priority microorganism. In addition, the
environmental factors such as pH, temperature, nutrients and microbial quantity control the time that PAHs persist in the environment (Bamforth and Singleton, 2005). The effects of pH and temperature in PAHs biodegradation under sulfate reducing conditions have been investigated (Chang et al., 2002). The results illustrated that the optimum pH and temperature for biodegradation of PAHs were 8.0 and 30oC, respectively. However, the optimum conditions for electron donor and biomass concentrations are not well understood. Varieties of microorganism can utilize fluorene under sulfate reducing conditions as sole carbon and energy sources (Coates et al., 1997; Chang et al., 2002). However, little has been known about the biodegradation of fluorene at high initial concentration of microorganisms.
The objective of this research was to investigate the biodegradability of fluorene by SRB enrichment culture. A series of experiments were carried out to investigate the effects of sulfate and biomass concentrations on fluorene biodegradation, and to evaluate the optimum operating conditions. This study also focused to determine the fluorene biodegradation kinetics.
Chapter 2
Literature Review
2.1 Introduction to PAHs and Fluorene
PAHs are introduced into the environment through natural and anthropogenic processes. The natural sources include forest fire, volcanic emissions and geologic processes. The anthropogenic sources include incomplete combustion of fossil fuels, by product of petroleum refining, oil spills, domestic and industrial effluents, incineration of refuse and wastes, urban run-off, shipping activities, vehicle exhaust and accidental release during transportation (Yuan et al., 2000; Chang et al., 2001). PAHs are a class of organic compounds that consist of two or more benzene rings fused in a linear, angular or clustered arrangement. The physicochemical properties of the 16 PAHs are listed in Table 2-1.
Fluorene is one of the most common PAHs found in the environment and is listed as a priority pollutant by US-EPA. Fluorene is a major component of fossil fuels and their derivatives. It is commonly identified in atmosphere (Casellas et al., 1997), fresh water (Nemr and Abd-Allah, 2003) and marine sediments (Coates et al., 1996; Tam et al., 2001). Fluorene and 9-fluorenone are highly toxic to fish and aquatic algae, and also carcinogenic to human potential (Casellas et al., 1997).
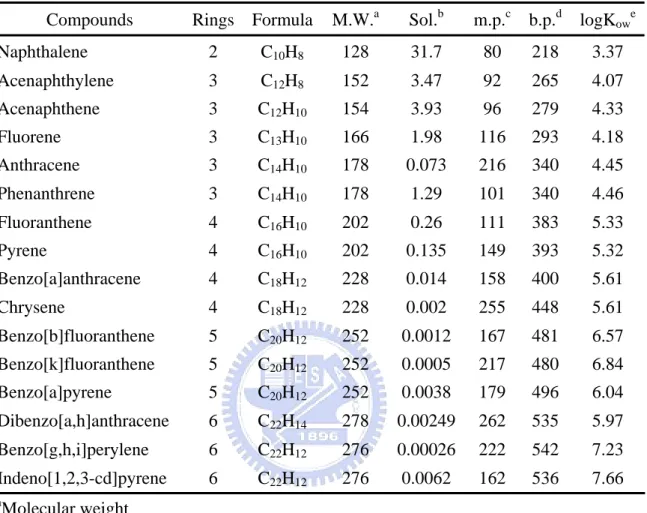
The low molecular weight PAHs present higher solubility than high molecular weight PAHs. However, the high molecular weight PAHs show higher hydrophobicity than the low molecular weight compounds. The difference in hydrophobicity is also reflected by the octanol-water partitioning coefficient (Kow)
shown in Table 2-1.
Table 2-1 Physicochemical properties of the 16 priority PAHs
Compounds Rings Formula M.W.a Sol.b m.p.c b.p.d logKowe
Naphthalene 2 C10H8 128 31.7 80 218 3.37 Acenaphthylene 3 C12H8 152 3.47 92 265 4.07 Acenaphthene 3 C12H10 154 3.93 96 279 4.33 Fluorene 3 C13H10 166 1.98 116 293 4.18 Anthracene 3 C14H10 178 0.073 216 340 4.45 Phenanthrene 3 C14H10 178 1.29 101 340 4.46 Fluoranthene 4 C16H10 202 0.26 111 383 5.33 Pyrene 4 C16H10 202 0.135 149 393 5.32 Benzo[a]anthracene 4 C18H12 228 0.014 158 400 5.61 Chrysene 4 C18H12 228 0.002 255 448 5.61 Benzo[b]fluoranthene 5 C20H12 252 0.0012 167 481 6.57 Benzo[k]fluoranthene 5 C20H12 252 0.0005 217 480 6.84 Benzo[a]pyrene 5 C20H12 252 0.0038 179 496 6.04 Dibenzo[a,h]anthracene 6 C22H14 278 0.00249 262 535 5.97 Benzo[g,h,i]perylene 6 C22H12 276 0.00026 222 542 7.23 Indeno[1,2,3-cd]pyrene 6 C22H12 276 0.0062 162 536 7.66 a Molecular weight bAqueous solubility in μg/L at 25o C c Melting point in oC d Boiling point in oC e
2.2 Environmental Fate of PAHs and their Problems in the
Environment
The majority of PAHs released into the environment is affected by volatilization, chemical oxidation, bioaccumulation and adsorption on soil particles (Yuan et al., 2000). The low molecular weight PAHs are partly dissolved, making them highly available for various degradation processes. The high molecular weight PAHs are primarily associated with particles in the atmosphere and water, and are therefore less available for degradation. Furthermore, PAHs adsorbed on particles may be transported over long distances in the atmosphere and are therefore ubiquitous in the environment (Howsam et al., 2000). PAHs exhibit toxic, mutagenic and carcinogenic properties. Therefore, there is serious concern about their environmental presence, especially their potential for bioaccumulation in many food chains (Yuan et al., 2000).
2.3 Anaerobic Biodegradation of PAHs
Many processes can contribute to the degradation of PAH compounds in polluted areas. But unlike sorption or dilution, only bacterial degradation can remove them totally from the environment by converting them to carbon dioxide. The initial step in the aerobic degradation of aromatic hydrocarbons is oxygenation (Cerniglia, 1992). However, many ecosystems, most of them in the subsurface, have only a limited supply with molecular oxygen. Increased microbial activity can lead to a rapid oxygen depletion and development of anaerobic conditions, which makes the use of oxygenases impossible. Therefore, PAHs are considered to be recalcitrant under anoxic conditions (Meckenstock et al., 2004).
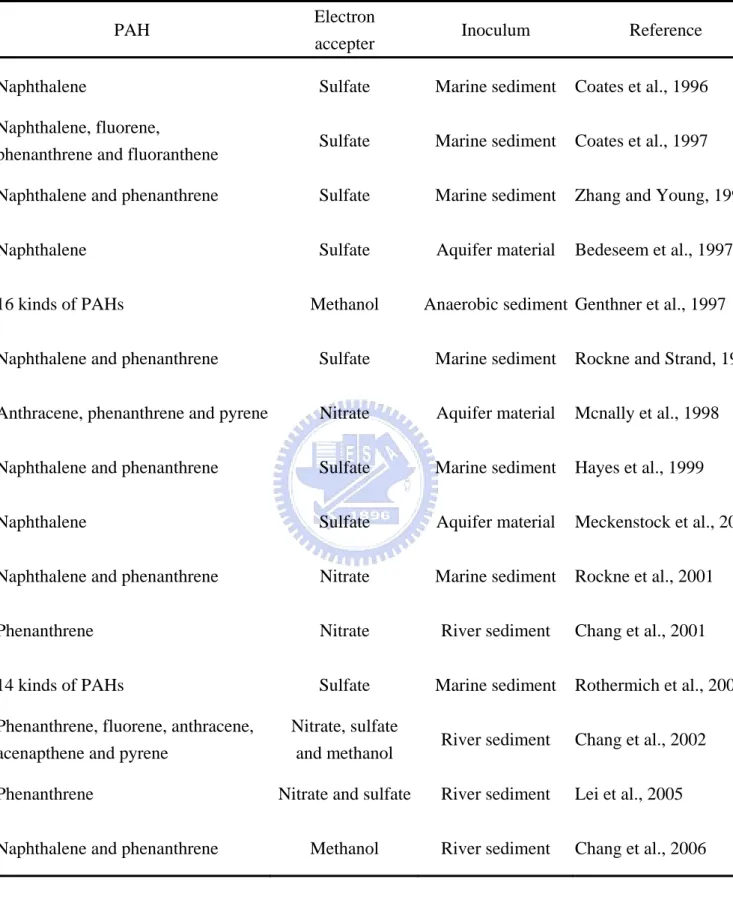
Mihelcic and Luthy (1988) reported the degradation of PAHs by microorganisms under nitrate reducing conditions. Several studies assessed different PAHs for biodegradation under different anaerobic conditions, mostly with nitrate or sulfate
reducing conditions. The results of some successful studies with PAHs biodegradation under anoxic conditions are summarized in Table 2-2. Among these anaerobic conditions, the most effective degradation rate of PAHs was observed under sulfate reducing conditions (Chang et al., 2002; Boopathy, 2004).
Table 2-2 Literature on anaerobic biodegradation of PAHs
PAH Electron
accepter Inoculum Reference Naphthalene Sulfate Marine sediment Coates et al., 1996
Naphthalene, fluorene,
phenanthrene and fluoranthene Sulfate Marine sediment Coates et al., 1997 Naphthalene and phenanthrene Sulfate Marine sediment Zhang and Young, 1997 Naphthalene Sulfate Aquifer material Bedeseem et al., 1997 16 kinds of PAHs Methanol Anaerobic sediment Genthner et al., 1997 Naphthalene and phenanthrene Sulfate Marine sediment Rockne and Strand, 1998 Anthracene, phenanthrene and pyrene Nitrate Aquifer material Mcnally et al., 1998 Naphthalene and phenanthrene Sulfate Marine sediment Hayes et al., 1999 Naphthalene Sulfate Aquifer material Meckenstock et al., 2000 Naphthalene and phenanthrene Nitrate Marine sediment Rockne et al., 2001 Phenanthrene Nitrate River sediment Chang et al., 2001 14 kinds of PAHs Sulfate Marine sediment Rothermich et al., 2002 Phenanthrene, fluorene, anthracene,
acenapthene and pyrene
Nitrate, sulfate
and methanol River sediment Chang et al., 2002 Phenanthrene Nitrate and sulfate River sediment Lei et al., 2005 Naphthalene and phenanthrene Methanol River sediment Chang et al., 2006
2.3.1 PAHs Biodegradation under Sulfate Reducing Conditions
Anaerobic biodegradation of PAHs in sediments under sulfate reducing conditions was demonstrated by Coates et al. (1996). This study reported that the biodegradation of [14C]naphthalene and phenanthrene occurred under sulfate reducing conditions. These two labeled PAHs were rapidly oxidized to 14CO2 in
50-70 days. Sulfate reduction was necessary for PAHs degradation. These researchers also proposed that the self-purification capacity of PAH-contaminated sulfate reducing environments may be greater than previously recognized. Another report by Coates et al. (1997) indicated that methylnaphthalene, fluorene and fluoranthene were mineralized to CO2 under sulfate reducing conditions, while no
degradation of pyrene and benzo[a]pyrene was observed. Results from this study also suggested that the capacity of microorganisms to biodegrade PAHs is dependent upon long-term exposure to the contaminants. Zhang and Young (1997) investigated the biodegradation of naphthalene and phenanthrene in the sediment. Results showed that these two PAHs were mineralized to CO2 and the utilization of both
compounds was inhibited in the presence of molybdate. Carboxylation as an initial reaction in the anaerobic transformation of naphthalene and phenanthrene by sulfidogenic consortia was proposed by these researchers. Bedessem et al. (1997) reported that naphthalene was microbially transformed in a sulfate reducing laboratory microcosm established under anaerobic conditions using sediments from two sulfate-rich, coal tar-contaminated aquifers enriched over a 3-year period. The results showed that 66% of [14C]naphthalene was mineralized to 14CO2 over 13 days.
Addition of sodium molybdate inhibited sulfidogenesis, and resulted in a 44% reduction in total [14C]naphthalene mineralized. This phenomenon provided evidence that naphthalene mineralization was coupled to sulfate reduction. In the study of Rockne and Strand (1998), a fluidized bed reactor was used to enrich the
bacteria from creosote-contaminated marine sediments with sulfate as potential terminal electron acceptor and naphthalene and phenanthrene as sole sources of carbon and energy. Results demonstrated that the removal of both the compounds occurred after 100-200 days. Naphthalene and phenanthrene stimulated sulfide production in the sulfate reducing enrichment with stoichiometric production of sulfide. Hayes et al. (1999) investigated the anaerobic degradation of naphthalene and phenanthrene in several marine harbor sediments. In sediments that were heavily contaminated with petroleum, [14C]naphthalene and [14C]phenanthrene were oxidized to 14CO2 without a lag, suggesting that the microbial community was
adapted for anaerobic in-situ. However, sediments not contaminated with petroleum did not significantly oxidize PAHs. The addition of molybdate, a specific inhibitor of SRB, inhibited PAHs mineralization suggesting that sulfate reduction was involved in the anaerobic oxidation of the PAHs. These results suggested that many marine harbor sediments contain microorganisms capable of anaerobically oxidizing PAHs under sulfate reducing conditions. Mechenstock et al. (2000) enriched a sulfate reducing culture from a contaminated aquifer by adding naphthalene as sole sources of carbon and energy and sulfate as the electron acceptor. In this study, 2-naphthoic acid was found as a prominent metabolite in all naphthalene degrading cultures. Rothermich et al. (2002) reported that higher molecular weight PAHs, such as chrysene and benzo[a]pyrene, were degraded under sulfate reducing conditions. The anaerobic biodegradation of fluorene, anthracene, acenaphthene, phenanthrene and pyrene in soil samples by a PAH-adapted consortium obtained from river sediments with a long-term pollution was demonstrated by Chang et al. (2002). An 80-100% PAHs reduction occurred within 90 days. Faster PAHs degradation rates were observed in cultures containing a mixture of PAHs compared to the presence of a single substrate. Lei et al. (2005) examined the feasibility of biodegradation of
sediment-bound PAHs by microbial consortia indigenous to chronically contaminated matrices. Results illustrated that phenanthrene was the only PAH to exhibit significant biodegradation under sulfate reducing conditions. The degradation was completely inhibited in the presence of molybdate suggesting that sulfate was the predominant terminal electron acceptor, and the biodegradation was probably metabolized by SRB indigenous to the sediment.
2.4 Factors Influencing Biodegradation of PAHs
Biodegradation of PAHs in the contaminated matrices such as soils and sediments is considered to be a complex phenomenon due to the toxicity and hydrophobic natures of PAHs, properties of soil or sediment, microbial environment heterogeneity, the multi nature of the biodegradation process, and the environmental factors governing the process (Mohan et al., 2006). The persistence of PAHs in the environment is dependent on a variety of factors, such as contaminant characteristics and concentration, concentration of electron acceptor, biomass concentration, presence of other carbon sources, nutrient limitations, pH and temperature. Some of these factors will alter the rate of microbial uptake and other factors change the rate of contaminant transport to microorganisms. The main influences of these factors are listed in Table 2-3.
2.4.1 Concentration of Electron Acceptor
In anaerobic biodegradation of PAHs under sulfate reducing conditions, the concentration of electron acceptor (sulfate) is a significant factor. Baskaran and Nemati (2006) indicated that the extent of sulfate reduction was dependent on the initial sulfate concentration and volumetric loading rate of sulfate. At a constant feed sulfate concentration, increases in sulfate volumetric loading rate caused the reduction rate to pass through a maximum. If the degradation rate is too slow, increased concentration of sulfate may accelerate the rate of degradation. Yuan et al. (2001) pointed out that biodegradation of phenanthrene was significantly influenced by the addition of sulfate. The degradation was lower in the presence of higher sulfate concentration due to the inhibition of enzyme-synthesis in the microorganisms. Table 2-4 shows the sulfate concentration used in previous studies for anaerobic biodegradation of PAHs under sulfate reducing conditions.
2.4.2 Biomass Concentration
In general, the presence of active microorganisms capable of degrading the PAHs is a key factor in PAHs biodegradation process. Microorganisms must be present in sufficient numbers and equipped with the necessary enzymes to perform the degradation process. It has been proposed that the rate and extent of PAHs biodegradation are related to the inoculated biomass concentration (Rothermich et al., 2002). Hayes et al. (1999) also pointed out that the rates of PAHs degradation increased with increasing the biomass concentration. In other words, the inoculation of sufficient contaminant-degrading bacteria may accelerate the degradation process. Nevertheless, the study of the effect of biomass concentration on PAHs biodegradation is rare.
2.4.3 pH and Temperature
pH and temperature play a significant role in microbial activity and control the nature and extent of degradation (Mohan et al., 2006). Normally, both metabolic activity and biodegradation rate decrease in response to a temperature drop. At low temperatures, the activity of enzymes is reduced and slower biodegradation rate is observed. In contrast, increase in temperature leads to increase in diffusion rates of organic compounds, which leads to increases in the bioavailability of hydrophobic contaminant (Northcott and Jones, 2001). In addition, cell functions and inter-membrane transport are strongly influenced by pH (Mohan et al., 2006). pH also influences the solubility of nutrients that are vital to cellular growth. It is accepted that an increase in pH causes precipitation of some essential ions, such as iron, calcium and sodium, which are essential to the biodegradation of PAHs. The effects of pH and temperature on the PAHs biodegradation under sulfate reducing conditions have been investigated by Chang et al. (2002). Results illustrated that the
optimum biodegradation of 2-, 3-, and 4-ring PAHs were determined at 30oC and pH 8.0.
Table 2-3 Factors influencing biodegradation of PAHs
Factor Influence Reference
Contaminant characteristics
Bioavailability Mass transfer
Microbial metabolism rate
Juhasz and Naidu, 2000; Johnson et al., 2005
Electron acceptor Bioavailability
Microbial metabolism rate
Yuan et al., 2001; Kleikemper et al., 2002; Baskaran and Nemati, 2006
Microorganism Microbial metabolism rate Rothermich et al., 2002; Johnson et al., 2005
Co-substrate Microbial metabolism rate Chang et al., 2002; Lei et al., 2005
pH
Bioavailability Mass transfer
Microbial metabolism rate
Moretto et al., 2005
Temperature
Bioavailability Mass transfer
Microbial metabolism rate
Namkoong et al., 2002; Northcott and Jones, 2001
Nutrients Microbial metabolism rate Chang et al., 2002; Lei et al., 2005
Table 2-4 Literature on anaerobic biodegradation of PAHs under sulfate reducing conditions.
PAH Sulfate concentration Inoculum Description Reference
[14C]naphthalene. 2.84 g (1920 mg/L) Sulfate-rich, coal
tar-contaminated aquifers.
Initial concentration 7 mg/L.
Complete mineralization after 9 days. Aqueous system. Bedessem et al., 1997 [14C]naphthalene, phenanthrene, methylnaphthalene, fluorene and fluoranthene. 10 mM (960 mg/L) Marine sediments contaminated with PAHs.
Initial concentration 1.0 μCi (fluorene). 80% (fluorene) mineralization after 37 days. Treated sediment.
Coates et al., 1997
[14C]naphthalene
and phenanthrene. 2.84 g (1920 mg/L)
Harbor sediment
contaminated with PAHs.
Initial concentration 150 μM.
Complete biodegradation after 20 days. Aqueous system.
Zhang and Young, 1997
Naphthalene
and phenanthrene. 28 mM (2688 mg/L)
Coal tar creosote- contaminated sediments
Initial concentration 8 mg/L.
Complete biodegradation after 20 weeks. A fluidized bed reactor.
Rockne et al., 1998
Naphthalene. 10 mM (960 mg/L) Sulfate reducing
enrichment culture.
Initial concentration 200 mg/L. Biotransformation to by-products, reaction time 90 days. Aqueous system.
Meckenstock et al., 2000 Phenanthrene, pyrene, anthracene, fluorene and acenapthene. 20 mM (1920 mg/L) River sediment. Initial concentration 2 mg/kg.
Complete biodegradation after 90 days. Treated soil.
Chang et al., 2002
[14C]naphthalene
and phenanthrene. 14 mM (1344 mg/L)
Harbor sediment
contaminated with PAHs.
60% (naphthalene) and 30% (phenanthrene)
2.5 Anaerobic PAHs Biodegradation Kinetics
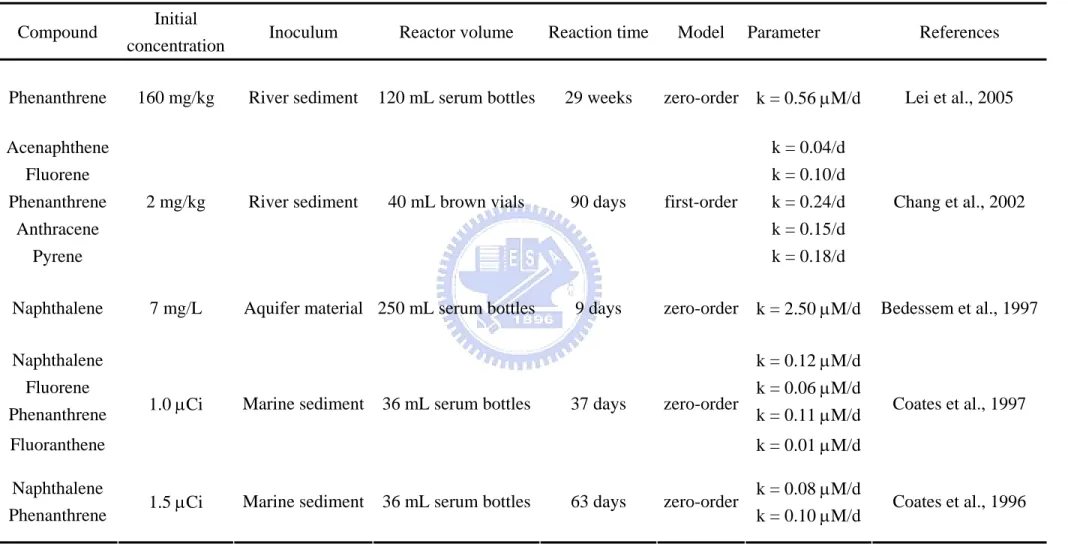
PAHs degradation rates are determined by the dissolution or mass transfer rates and the rates of microbial assimilation. The inherent maximum microbial assimilation rate of PAHs is slower than the mass transfer rate, in such case the microbial kinetics will be controlled by the overall biodegradation rate (Shuttleworth and Cerniglia, 1995). On the other hand, the microbial assimilation of PAHs is faster than the mass transfer rate, then mass transfer will be controlled by the overall biodegradation rate. In order to understand the behavior of PAHs in contaminated site and to assess the prospects of remediation, the information of degradation kinetics and the resulting residual concentration are necessity. The zero-order and first-order kinetics have been used to fit the experimental data. The degradation rates of aerobic biodegradation of PAHs have been well documented. However, little is known about the degradation rates of anaerobic biodegradation of PAHs under sulfate reducing conditions. The published constants of anaerobic PAHs degradation rate under sulfate reducing conditions evaluated using zero-order and first-order kinetics models are listed in Table 2-5.
Table 2-5 The degradation rate constants for anaerobic biodegradation of PAHs under sulfate reducing conditions
Compound Initial
concentration Inoculum Reactor volume Reaction time Model Parameter References
Phenanthrene 160 mg/kg River sediment 120 mL serum bottles 29 weeks zero-order k = 0.56 μM/d Lei et al., 2005
Acenaphthene k = 0.04/d
Fluorene k = 0.10/d
Phenanthrene k = 0.24/d
Anthracene k = 0.15/d
Pyrene
2 mg/kg River sediment 40 mL brown vials 90 days first-order
k = 0.18/d
Chang et al., 2002
Naphthalene 7 mg/L Aquifer material 250 mL serum bottles 9 days zero-order k = 2.50 μM/d Bedessem et al., 1997
Naphthalene k = 0.12 μM/d
Fluorene k = 0.06 μM/d
Phenanthrene k = 0.11 μM/d
Fluoranthene
1.0 μCi Marine sediment 36 mL serum bottles 37 days zero-order
k = 0.01 μM/d
Coates et al., 1997
Naphthalene k = 0.08 μM/d
Chapter 3
Material and method
3.1 Introduction
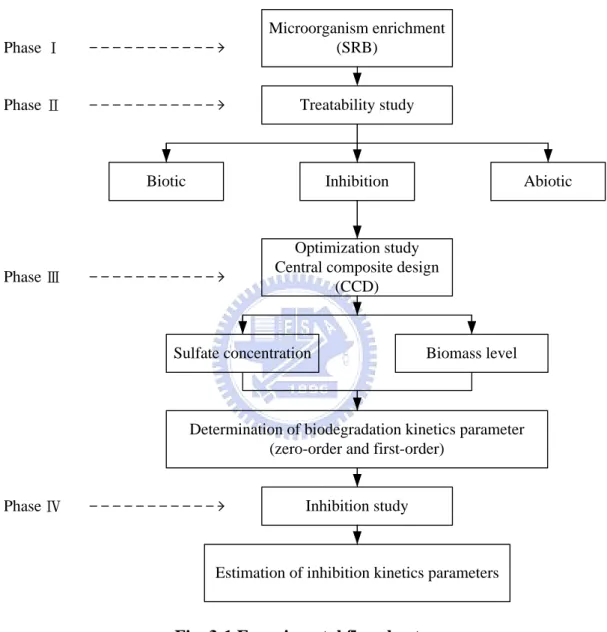
This chapter describes the details of materials used, reactor setup, experimental methods and design, and analytical methods. The research flowchart of this study is shown in Fig. 3-1.
3.2 Materials
Fluorene with 99.0% purity (analytical grade) was purchased from Fluka (Germany). All other chemicals and solvents used in this study are listed in Table 3-1. The fluorene stock solution was prepared in N,N-dimethylformamide (DMF) at 5000 mg/L and stored in dark at 4oC. The experimental fluorene concentration required for the investigation was prepared from the stock solution.
Microorganism enrichment (SRB)
Treatability study
Optimization study Central composite design
(CCD)
Sulfate concentration Biomass level Inhibition
Biotic Abiotic
Inhibition study
Determination of biodegradation kinetics parameter (zero-order and first-order)
Estimation of inhibition kinetics parameters Phase Ⅰ
Phase Ⅱ
Phase Ⅲ
Phase Ⅳ
Fig. 3-1 Experimental flowchart
Table 3-1 Chemicals and solvents used in this study
Purpose Chemicals and solvents
PAH Fluorene (C13H10): 99.0%, Fluka (Germany)
Sodium bicarbonate (NaHCO3): 99.6%, Shimakyu (Japan)
Potassium phosphate (KH2PO4): 99.0%, Shimakyu (Japan)
Ammonium chloride (NH4Cl): 99.5%, Panreac (E.U.)
Magnesium chloride, 6-hydrate (MgCl2•6H2O): 99.0%, Panreac (E.U.)
Calcium chloride, 6-hydrate (CaCl2•6H2O): 98.0%, Panreac (E.U.)
Anhydrous sodium sulfate (Na2SO4): 99.0%, Panreac (E.U.)
Iron (Ⅱ)sulfate, 7-hydrate (FeSO4•7H2O): 99.0%, Panreac (E.U.)
Yeast extract: 99%, Scharlau (Japan)
Hydrochloric acid (HCl): 35.0%, Shimakyu (Japan) Composition of mineral medium
Sodium hydroxide (NaOH): 98.0%, Panreac (E.U.) Sodium azide (NaN3): 97.0%, Yakuri (Japan)
Inhibitor
Sodium molybdate, 2-hydrate (Na2MoO4•2H2O): 99.5%, Fluka (Germany)
Barium chloride, 2-hydrate (BaCl2•2H2O): 99.0%, Fluka (Germany)
Magnesium chloride, 6-hydrate (MgCl2•6H2O): 99.0%, Panreac (E.U.)
Sodium acetate, 3-hydrate (CH3COONa•3H2O): 99.0%, Panreac (E.U.)
Potassium nitrate (KNO3): 99.0%, Panreac (E.U.)
Acetic acid (CH3COOH): 99.8%, Fluka (Germany)
Sulfate measurement
Table 3-1 Chemicals and solvents used in this study (continued)
Purpose Chemicals and solvents
PAHs dissolved solvent N,N-dimethylformamide (DMF, HCON (CH3)2): 100.0%, J.T. Baker (USA)
Potassium dichromate (K2Cr2O7): 99.5%, Panreac (E.U.)
Mercuric slufate (HgSO4): 99.5%, Shimakyu (Japan)
Silver sulfate sulfuric acid (AgSO4): 10g/L, Panreac (E.U.)
1,10 phenanthroline monohydrate (C12H8N2•H2O): 99.9%, Panreac (E.U.)
Potassium hydrogen phthalate (C8H5KO4): 99.9%, Fluka (Germany)
COD measurement
Ammonium iron (II) sulfate 6-hydrate (Fe(NH4)2(SO4)2•6H2O): 99.0%, Panreac (E.U.)
PAHs extraction solvent Dichloromethane (DCM, CH2Cl2): 99.9%, Mallinckrodt (USA)
OD660 measurement Sodium chloride (NaCl): 99.0%, Panreac (E.U.)
4’,6’-diamidino-2-phenylindole (DAPI)
EUB338 probe, SRB385 probe, SRB385Db probe Paraformaldehyde (PFA): Sigma (USA)
Diethl pyrocarbonate (DEPC, C6H10O5): 97.0%, Sigma (USA)
Hydrochloric acid (HCl): 35.0%, Shimakyu (Japan) Sodium hydroxide (NaOH): 98.0%, Panreac (E.U.)
Sodium dodecyl sulfate (SDS, C12H25O4SNa): 99.0%, Sigma (USA)
Hydroxymethyl aminomethane (Tris, C14H11NO3): 99.8%, Amresco (USA)
Di-sodium hydrogen phosphate, 7-hydrate (Na2HPO4•7H2O): 99.0%, Fluka (Germany)
Ethyl alcohol (C2H5OH): 95.0%, Shimakyu (Japan)
FISH analysis
3.3 Incubation
The SRB enriched from anaerobic sludge was used as inoculum. The SRB was enriched using modified Postgate’s C medium (Postgate, 1984) containing fluorene for 6 month. The medium contained the following constituents in 1 L of deionized water: 2.52 g NaHCO3, 0.5 g
KH2PO4, 1 g NH4Cl, 0.06 g MgCl2•7H2O, 0.06 g CaCl2•6H2O, 2.84 g Na2SO4, 0.02 g
FeSO4•7H2O and 0.5 g yeast extract.
A specially designed 1.2 L serum bottle equipped with pH and oxidation reduction potential (ORP) probes was used as the incubator (Fig. 3-2). In this study, 100 mL of SRB suspension was added into the reactor containing 900 mL of medium. The mixture was then purged with filter sterilized high purity nitrogen for about 10 min. Further, fluorene stock solution was added into the reactor to achieve the final concentration of 10 mg/L. The incubator was then sealed with PTFE-lined cap and the headspace of the reactor was replaced with pure nitrogen. Finally, the incubator was placed in a temperature-controlled chamber (Advantec, C1-612) and incubated at 30oC in dark and stirred by a teflon stirrer at 100 rpm for 21 days. During the incubation period, pH and ORP were monitored continuously.
Fig. 3-2 Schematic diagram of incubation system
3.4 Experimental Methods and Design
3.4.1 Treatability Study
The treatability of SRB enrichment culture was tested with fluorene and assessed by conducting three sets of experiments including one biotic set, one inhibited control set and one abiotic control set. The experimental design of treatability study is shown in Table 3-2. A 1.2 L serum bottle was used as bioreactor. The SRB suspension obtained from the incubator was harvested and concentrated by centrifugation at 6000 rpm for 10 min and washed thoroughly with sterile medium to remove the residual PAHs. In the biotic set, 10 mL of the concentrated SRB suspension (approximately 1000 mg/L) was inoculated into the bioreactor containing 990 mL of medium resulting in an initial biomass concentration of 10 mg/L. The
bioreactor was purged with filter sterilized nitrogen gas for 10 min prior to the addition of fluorene (from 5000 mg/L stock solution prepared in DMF and the final concentration was 5 mg/L). The bioreactor was then sealed with a stopper and incubated for 21 days in dark without shaking in a temperature-controlled chamber at 30oC. Similarly, inhibited control set was prepared in the same manner and added with molybdate (4000 mg/L) as the inhibitor. Abiotic control set was prepared with the medium containing fluorene and without SRB enrichment culture. The bioreactor contents were autoclaved at 121oC for 30 min, followed by the addition of NaN3 (10000 mg/L). Abiotic experiments were used to confirm the loss of
PAHs through volatilization, photodegradation, sorption to the inner surface of the bioreactor and abiotic degradation. Samples were collected periodically from the bioreactors and measured for pH, optical density (OD660) and concentrations of sulfate and PAHs. At the end
of experiment, the ORP of the bioreactors were measured.
Table 3-2 Experimental design for treatability study
Run Fluorene concentration SRB concentration Molybdate concentration NaN3 concentration Biotic 5 mg/L 10 mg/L 0 0 Inhibited control 5 mg/L 10 mg/L 4000 mg/L 0 Abiotic control 5 mg/L 0 0 10000 mg/L
3.4.2 Optimization Study
The optimum conditions for PAHs biodegradation was evaluated through the response surface methodology (RSM). The initial concentrations of sulfate and biomass were selected as the influencing factors and the percentage of PAHs removal was selected as the response. Ranges and levels of the designed factors are shown in the Table 3-3. A series of statistically designed experiments for the central composite design (CCD) were generated by the statistical software MINITAB 14 (Minitab Inc., USA) and exhibited in Table 3-4. Bioreactors were operated as per CCD and placed in the temperature-control chamber at 30oC for 21 days without shaking. Samples were periodically taken from the bioreactors for measuring the pH, ORP, OD660
COD and concentrations of sulfate and fluorene. The RSM was applied to determine the optimum operating conditions under sulfate reducing conditions. The assessed optimum run (with the highest fluorene removal percentage) was tested again as the confirmation test and samples collected from the bioreactor were analyzed for the pH, ORP, OD660, COD,
concentration of sulfate and fluorene and FISH analysis. The degradation kinetics was calculated using zero-order and first-order models.
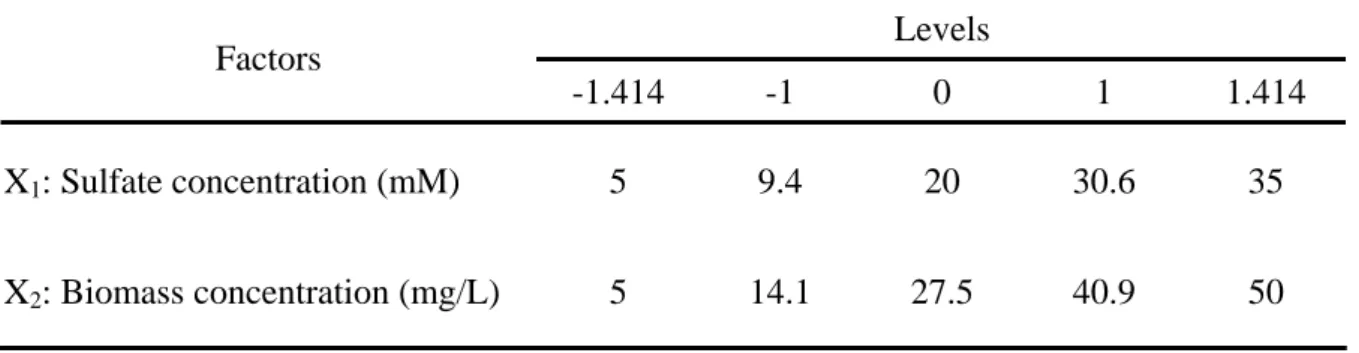
Table 3-3 Ranges and levels of designed factors for CCD
Levels Factors
-1.414 -1 0 1 1.414
X1: Sulfate concentration (mM) 5 9.4 20 30.6 35
Table 3-4 Sequence of runs for CCD
Run Order Sulfate concentration (mM) Biomass concentration (mg/L)
1 5 27.5 2 9.4 11.6 3 9.4 43.4 4 20 5 5 20 27.5 6 20 27.5 7 20 27.5 8 20 50 9 30.6 11.6 10 30.6 43.4 11 35 27.5 Abiotic control 20 0 Inhibited control 20 27.5
3.4.3 Inhibition Study
The inhibition of fluorene to SRB enrichment culture was tested at various fluorene concentrations, i.e. 0, 1, 2, 5, 10, 25, 50, 75 and 100 mg/L. Because fluorene can be utilized by SRB as sole carbon and energy sources, and cell growth on fluorene exhibits substrate inhibition effect at high concentrations. Haldane’s equation shown below was selected for assessing the inhibition of SRB enrichment culture (Loh and Yu, 2002; Yan et al., 2005) and estimating the inhibition kinetics parameters.
)
(
2 maxKi
Cs
Cs
Ks
Cs
+
+
=
μ
μ
(Eq. 3-1)Where, μ is the specific growth rate (1/d); μmax is the maximum specific growth rate (1/d); Cs
is the substrate concentration (mg/L); Ks is the half saturation constant (mg/L); Ki is the substrate inhibition constant (mg/L). μmax, Ks and Ki were obtained using the nonlinear
3.5 Analytic Methods
3.5.1 PAH Extraction
Residual fluorene was extracted with DCM in 10 mL Teflon tube in a shaker (SHIN KWANG, Taiwan) for 24 hr at room temperature. The supernatant was removed after centrifuging (Hettich, Taiwan) the mixture at 4000 rpm for 10 min. The DCM phase was stored in a brown glass vial sealed with Teflon-butyl rubber cap and refrigerated at 4oC before gas chromatographic (GC) analysis.
3.5.2 PAH Quantification
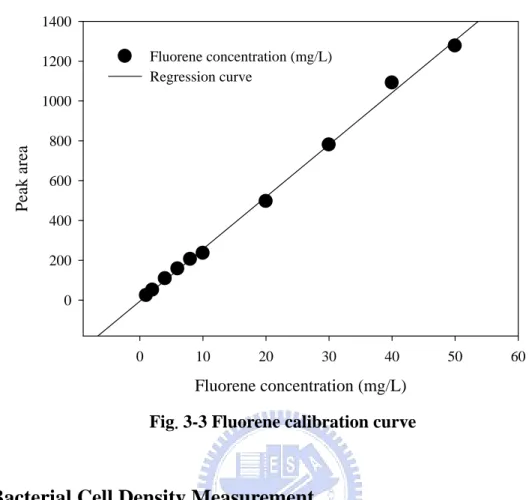
Fluorene concentration in the extract was analyzed by a Hewlett-Packard 7890 series II GC, which is equipped with a flame ionization detector (FID) and a 30 m long DB-5 fused silica capillary column (J&W, Folsom, CA, USA) with a film thickness of 0.5 μm and internal diameter of 0.53 mm. Helium was used as a carrier gas and a makeup gas at flow rates of 3 mL/min and 22 mL/min, respectively. Initially temperature of the oven was set at 120oC and hold for 1 min, then raised to 280oC at 20oC/min with 2 min holding. Both injector and detector temperatures were set at 280oC. At this condition fluorene was identified at 11 min. The calibration curve of fluorene (R2 = 0.99) is illustrated in Fig. 3-3.
Fluorene concentration (mg/L) 0 10 20 30 40 50 60 Peak ar ea 0 200 400 600 800 1000 1200 1400 Fluorene concentration (mg/L) Regression curve
Fig. 3-3 Fluorene calibration curve
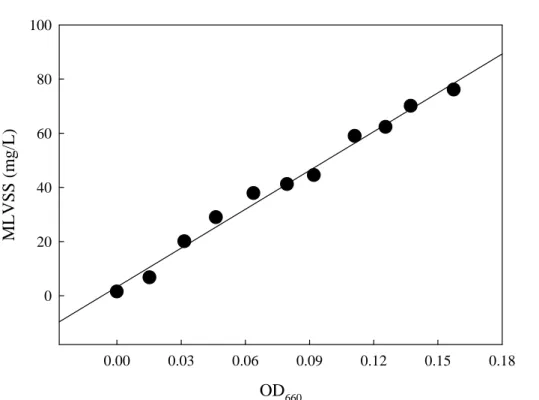
3.5.3 Bacterial Cell Density Measurement
In this study, the mixed liquid volatile suspended solid (MLVSS) concentration was used as an indicator of bacterial cell density. Due to the greater demand of sample volume and the inaccuracy of MLVSS measurement, the correlation between MLVSS concentration and OD660 (Fig. 3-4) was prepared with a high relative coefficient (R2 = 0.99) to quantify the cell
density. For OD660 measurement, the enriched cells were harvested and concentrated by
centrifugation at 6000 rpm for 10 min and diluted in a series of dilution with 0.8% NaCl solution. The OD660 of the corresponding dilutions was found by an UV digital spectrometer
at 660 nm (Rabus et al., 1996; Feio et al., 1998). The MLVSS concentrations were measured according to the Standard Methods (APHA et al., 2005).
OD660 0.00 0.03 0.06 0.09 0.12 0.15 0.18 ML VSS ( m g/L ) 0 20 40 60 80 100
3.5.4 FISH Analysis
The fixation, hybridization and microscopic counting of hybridized, and DAPI stained cells procedures used in this study were modified from that described by Amann et al. (1990). The following previously published oligonucleotides probes were used: EUB338, SRB385 and SRB385Db (Table 3-5). These probes were synthesized with FITC fluorochrome at the 5’ end. The EUB338 can detect all eubacteria. As suggested by the published studies (Ito et al., 2002; Kleikemper et al., 2002), the sum of SRB detected by probes SRB385 and SRB385Db was regarded as the total SRB population. For fixation, 1 volume of the concentrated cell suspension (0.25 mL) was mixed with 3 volumes (0.75 mL) of 4% (wt/vol) PFA in phosphate-buffered saline (PBS) (10 mM sodium phosphate, 130 mM NaCl, pH 7.2), and the mixture was incubated at 4oC for 2 hr. After fixation, the cells were centrifuged at 10000 rpm for 3 min to obtain the bacterial pellets. The bacterial pellets were washed twice with 1 mL of PBS to remove the residual fixative. The fixed cells were then preserved in the mixture of 50% of PBS-ethanol (v/v). The mixture was then stored at -20oC for less than 4 weeks until hybridization. Hybridization was performed on Teflon-covered slides with 10 glass windows. Aliquots of the fixed cell suspensions (5 μL) were spread on each of the windows and air dried. The cells were then dehydrated by subsequent incubation in 50, 80 and 100% ethanol for 3 min (each step) and were air dried. Each window was covered with 10 μL of hybridization buffer (0.9 M NaCl, 20 mM Tris-HCl buffer [pH 7.2], 0.1% SDS and 30% [v/v] formamide) with probe (50 ng/well). The slides were then placed in 50 mL centrifugation tubes and incubated in a temperature-controlled chamber for 2 hr at 46oC. Thereafter, the slides were washed twice with washing buffer at 48oC (0.07 M NaCl, 20 mM Tris-HCl buffer [pH 7.2] and 0.1% SDS) and incubated for 30 min in washing buffer at 46oC. After incubation, the slides washed with distilled water to remove the excess probe and salts. The slides
were then air dried in the dark. Fluorescence intensities of the cells hybridized with labeled oligonucleotide probes were measured with a microscope (Olympus Optical Co., Japan). For enumeration of the cells, 15 microscopic fields were randomly selected and direct cell counting was performed.
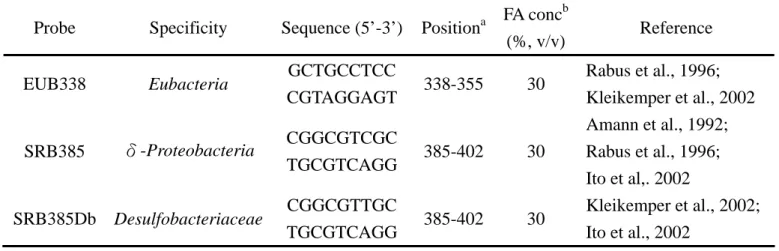
Table 3-5 Oligonucleotide probes used in this study
a
Position in the 16S rRNA of E. Coli
Probe Specificity Sequence (5’-3’) Positiona FA conc
b (%, v/v) Reference EUB338 Eubacteria GCTGCCTCC CGTAGGAGT 338-355 30 Rabus et al., 1996; Kleikemper et al., 2002 SRB385 δ-Proteobacteria CGGCGTCGC TGCGTCAGG 385-402 30 Amann et al., 1992; Rabus et al., 1996; Ito et al,. 2002 SRB385Db Desulfobacteriaceae CGGCGTTGC TGCGTCAGG 385-402 30 Kleikemper et al., 2002; Ito et al., 2002 b
Chapter 4
Result and Discussion
4.1 Enrichment of SRB
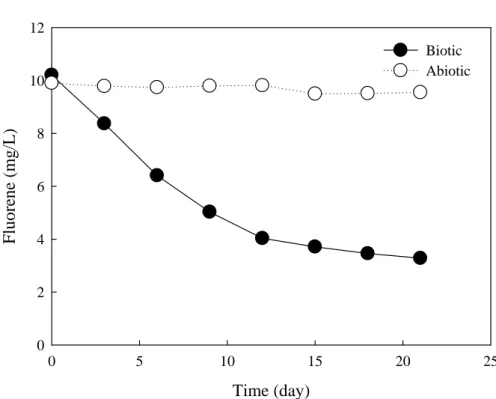
The enrichment of SRB was carried out with fluorene at 10 mg/L. During the fifth sub-cultivation, the degradation of fluorene occurred without any lag phase. After 21 days of incubation, fluorene concentration decreased from 10.2 to 3.3 mg/L (67.6% removal) as shown in Fig. 4-1. It can be seen from Fig. 4-1, no significant degradation of fluorene occurred in abiotic controls. Although only one subculture data is presented in Fig. 4-1, the subculture was repeated several times to determine the activity of the culture. The enriched SRB showed immediate fluorene degradation indicating that the culture was well adapted for fluorene biodegradation.
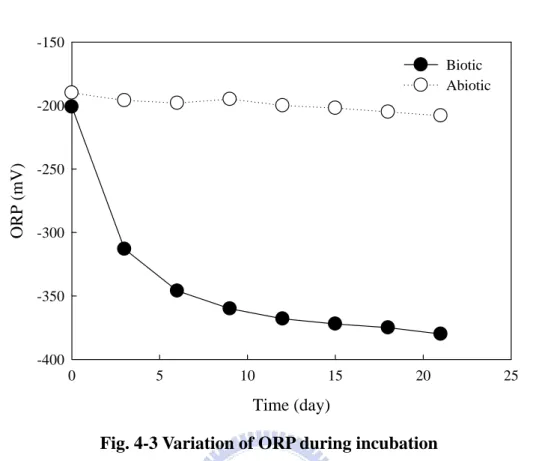
Throughout the enrichment process, no significant pH variation was observed neither in biotic (pH around 7.2 to 7.3) nor in abiotic (pH around 7.2 to 7.3) control systems (Fig. 4-2). ORP of the biotic system decreased quickly from -200 to -310 mV within 3 days of incubation (Fig. 4-3). The observed ORP value (-200 to -380 mV) in the present biotic system corresponded well with Postgate (1984).
Time (day) 0 5 10 15 20 25 Fluore ne (m g/L) 0 2 4 6 8 10 12 Biotic Abiotic
Fig. 4-1 Variation of fluorene concentration during incubation
Time (day) 0 5 10 15 20 25 pH 0 2 4 6 8 10 12 14 Biotic Abiotic
Time (day) 0 5 10 15 20 25 ORP ( m V) -400 -350 -300 -250 -200 -150 Biotic Abiotic
Fig. 4-3 Variation of ORP during incubation
4.2 Treatability of SRB Enrichment Culture
The fluorene biodegradation profile by SRB enrichment culture is showed in Fig. 4-4. The degradation of fluorene showed a rapid initial phase followed by a slower and longer phase. More than 60% of fluorene was degraded within 6 days and nearly 90% of fluorene was degraded in 21 days. Fluorene was not significantly degraded in both inhibited and abiotic experiments. The lower degradation in molybdate treatment suggests that SRB are the major group of microorganisms for the biodegradation of fluorene. Furthermore, the residual concentration of fluorene in biotic experiment was lower than that in abiotic experiment. The above findings suggest that the SRB enrichment culture has the ability for the biodegradation of fluorene. Significant increase in bacterial cell density was observed in the first 6 days (Fig. 4-5). In the biotic experiment, bacterial cell density was around 10 mg VSS/L (measured by OD660) and increased to approximately 80 mg VSS/L (measured by OD660) after 6
density, it is clear that the rapid cell growth rate resulted in a greater degradation rate. These observations reveal that the fluorene degradation was the result of microbial action of SRB. On the other hand, SRB enrichment culture was grown using fluorene as the carbon source. No microbial growth occurred in the abiotic experiment and a very less microbial growth was observed in the inhibited experiment.
Sulfate was used as the electron acceptor in this study. The variation of sulfate concentration during the incubation is presented in Fig. 4-6. Significant reduction in sulfate concentration was observed in the first 6 days. In comparison to the bacterial cell density, it is clear that the rapid cell growth rate resulted in a greater sulfate reduction. However, the concentrations of sulfate in the inhibited and abiotic experiments maintained at the same levels throughout the experiments. These results indicate that the sulfate reduction was occurred only in biotic experiments. No significant pH variation was observed for each run during the incubation period (Fig. 4-7). pH values of biotic, inhibited and abiotic experiments ranged from 7.4 to 7.8, 7.5 to 7.8 and 7.9 to 8.1, respectively. In addition, to confirm the degradation process under sulfate reducing conditions, the samples collected at the end of incubation was analyzed for ORP. The initial ORP value of each run was -200 mV. The ORP value of biotic experiment dropped remarkably to below -350 mV within 21 days of incubation. However, no significant changes in ORP values were observed in both inhibited and abiotic experiments.
Time (day) 0 5 10 15 20 25 Fl uo rene resi du e (% ) 0 20 40 60 80 100 120 Fl uo rene d eg radatio n (% ) 0 20 40 60 80 100
Fig. 4-4 Biodegradation of fluorene by SRB enrichment culture. Fluorene residual of biotic (●), inhibited (▼) and abiotic (■). Fluorene degradation percentage of
biotic (○), inhibited (▽) and abiotic (□)
Time (day) 0 5 10 15 20 25 VSS (mg /L) 0 20 40 60 80 100 120 Biotic Inhibited Abiotic
Time (day) 0 5 10 15 20 25 Sulfate (mM) 20.0 20.5 21.0 21.5 22.0 22.5 23.0 23.5 24.0 Biotic Inhibited Abiotic
Fig. 4-6 Variation of sulfate concentration during fluorene biodegradation
Time (day) 0 5 10 15 20 25 pH 0 2 4 6 8 10 12 14 Biotic Inihibited Abiotic
4.3 Optimization Study
4.3.1 Result of CCD
Sulfate and biomass concentrations were chosen as the independent variables for CCD. The RSM was used to estimate the significance of the two factors based on the removal percentage of fluorene and to find the optimum conditions. Results of CCD are summarized in Table 4-1. The maximum fluorene removal of 89% was observed under the experimental conditions of run 8 (initial sulfate concentration of 20 mM and biomass concentration of 50 mg/L). The minimum fluorene removal of 57% was observed in run 4 with the lowest biomass concentration of 5 mg/L. Runs 4 and 8 indicate that an increase in biomass concentration resulted in a significant increase in fluorene removal percentage. Fluorene was not significantly degraded in both inhibited and abiotic control runs. The smaller standard deviation of removal percentage (85.0 ± 0.7%) of center point runs (Runs 5, 6 and 7) indicates a good repeatability of these experiments. The sum of sequential squares of the model was analyzed. These analyses show that the experimental data were best represented by a quadratic model (Table 4-2).
Table 4-1 Experimental conditions and results of CCD for the optimization study
Experimental condition Experimental result Runs Fluorene concentration (mg/L) Sulfate concentration (mM) Biomass concentration (mg/L) Fluorene removal (%) 1 5 5 27.5 85.9 2 5 9.4 11.6 69.6 3 5 9.4 43.4 84.5 4 5 20 5 57.2 5a 5 20 27.5 85.6 6a 5 20 27.5 85.2 7a 5 20 27.5 84.3 8 5 20 50 89.2 9 5 30.6 11.6 70.0 10 5 30.6 43.4 79.6 11 5 35 27.5 69.8 Inhibit 5 20 27.5 27.4 Abiotic 5 20 0 2.6 a Center point
Table 4-2 Sequential model sum of squares
Source Sum of squares DFb Mean square F value p-valuec Mean vs Total 67046.08 1 67046.08 Linear vs Mean 752.19 2 376.09 9.90 0.0069 2FIa vs Linear 2.68 1 2.68 0.06 0.8100 Quadratic vs 2FI 222.61 2 111.31 7.08 0.0348 Cubic vs Quadratic 77.66 2 38.83 122.39 0.0013 Residual 0.95 3 0.32 Total 68102.17 11 6191.11 a
Interaction effects of the factors
b
Degree of freedom
c
The second-order model for the CCD is shown in Eq. 4-1 and the estimated regression coefficients of the predicted model are shown in Table 4-3.
R = 43.0738 + 1.0776 A + 1.957 B–0.0323 A2–0.0236 B2–0.0049 AB (Eq. 4-1)
Where, R is the removal percentage of fluorene (%), A is the sulfate concentration (mM) and B is the biomass concentration (mg/L).
In order to test the model’s significance and suitability, the analysis of variance (ANOVA) was conducted. Statistical data such as the sum of squares, F values, p-values and the estimated regression coefficients of the predicted model are presented in Table 4-3. The p-value less than 0.05 indicates that the model terms are significant. It can be seen from Table 4-3, A (sulfate concentration), B (biomass concentration) and AB are significant terms in the model. In addition, the model provided a high correlation coefficient (R2 = 0.93), low PRESS (<1000) and high adequacy precision (>4) suggesting that the model was adequate in the prediction of fluorene removal percentage within our experimental region.
Table 4-3 ANOVA for the predicted model
Terms Coefficient SSd F value p-valuee Constant 43.0738 Aa 1.0776 108.0261 6.8708 0.0470 Bb 1.957 644.1609 40.9705 0.0014 Aa -0.0323 74.3964 4.7318 0.6966 Bb -0.0236 200.8655 12.7756 0.0816 AB -0.0049 2.6833 0.1707 0.0160 Fitted R2 0.93 PRESSc 554.51 Adequacy precision 9.729 a Sulfate concentration b Biomass concentration c
PRESS: predication error sum of squares
d
SS: sum of squares
e
p-value less than 0.05 indicates that the model terms are significant
To test the accuracy of the model (Eq. 4-1), residual versus fitted values was plotted by the software. The fitted values of the residuals should be shapeless and have no relation to other variables if the model is correct and the hypotheses are true. The plot of residuals versus fitted values for fluorene removal percentage (Fig. 4-8) has not shown any abnormal construction such as funnel or bell shape. This indicates that the model given in Eq. 4-1 is correct and the hypotheses are valid. The normal probability plot was used in order to test the normality of error distribution. The linear profile shown in Fig. 4-9 demonstrates that the error distribution is normal and the experimental data fit in good proportion with the normal distribution.
Fitted Value Re si d u a l 90 85 80 75 70 65 60 5 4 3 2 1 0 -1 -2 -3 -4
Fig. 4-8 Residuals versus fitted values plot for fluorene removal percentage
Residual P e rcen t 5.0 2.5 0.0 -2.5 -5.0 -7.5 99 95 90 80 70 60 50 40 30 20 10 5 1
4.3.2 Response Surface and Contour Plot
The response surface and contour plots obtained from the developed model were used to examine the relationship between factors (sulfate and biomass concentrations) and response (removal percentage of fluorene). A three-dimensional response surface and the corresponding contour plot are shown in Fig. 4-10 (a) and Fig. 4-10 (b), respectively. It can be seen from Fig. 4-10, fluorene removal percentage was more influenced by the biomass concentration than the sulfate concentration. The increase in biomass concentration led to an obvious increase in fluorene removal percentage. The high fluorene removal may be due to the fact that the high biomass concentration in the system enhanced the microbial growth rate and activity at the early stage of the biodegradation process (Rothermich et al., 2002).
Furthermore, a lower fluorene removal percentage was observed at high concentration of sulfate than at low concentration. This may be due to the inhibition of enzyme synthesis of microorganism at high concentration of sulfate (Yuan et al., 2001). It can be seen from Fig. 4-10, the maximum removal percentage of fluorene (>88 %) was observed when the sulfate and biomass concentrations in ranges 10-15 mM and 35-45 mg/L, respectively. Some researchers maintained the sulfate concentration between 10 and 15 mM (Coates et al., 1997; Meckenstock et al., 2001).
(a) 3 45 Removal (%) 0 60 75 90 Biomass (mg/L) 15 10 20 0 30 40 Sulfate (mM) (b) Sulfate (mM) Bi o m a ss (m g /L ) 88 84 80 76 72 68 64 60 60 56 35 30 25 20 15 10 5 48 42 36 30 24 18 12 6
Contour Plot of Removal (%) vs Biomass concentr, Sulfate concentr
Fig. 4-10 Response surface (a) and contour plot (b) for removal percentage of fluorene vs. sulfate and biomass concentration
4.3.3 Optimization of Fluorene Biodegradation
In order to determine the optimum conditions for fluorene biodegradation, the desirability functions methodology (Corzo et al., 2008) was applied and twelve solutions were obtained (Table 4-4). From Table 4-4, it can be observed that run 8 shows a maximum fluorene removal percentage of 90%. Therefore, the corresponding concentrations of biomass (37.8 mg/L) and sulfate (14.4 mM) were considered as the optimum conditions for biodegradation of fluorene.
Table 4-4 Optimized conditions for removal percentage of fluorene estimated by the desirability functions methodology
Solution Sulfate (mM) Biomass (mg/L) Removal (%) Desirability
1 13.2 34.8 89 1 2 16.8 39.8 89 1 3 10.6 40.4 89 1 4 13.2 34.8 89 1 5 16.8 39.8 89 1 6 16.1 41.9 89 1 7 9.9 40.8 89 1 8a 14.4 37.8 90 1 9 19.1 36.7 89 1 10 12.9 29.9 87 1 11 10.6 40.4 89 1 12 20.2 32.6 87 1 a Optimum run.
4.4 Confirmation Study
4.4.1 Evaluation of Predicted Model
The verification of the predicted value of fluorene removal percentagefrom the model was assessed by conducting confirmation experiments. The experimental conditions included biotic (run 8 in Table 4-4) and abiotic runs (without SRB). Results of the confirmation
experiments show a similar fluorene removal percentage to the predicted value of the model. The fluorene removal percentage of biotic run (fluorene concentration of 5 mg/L, sulfate concentration of 14.4 mM, and biomass concentration of 37.8 mg/L) was 90%, which was same to the model predicted value (90%). Furthermore, the biotic runs were carried out in duplicates. The results matched well with the predicted results.
Profiles of fluorene concentration, sulfate concentration, bacterial cell density and COD concentration during the incubation period are shown in Figs. 4-11, 4-12, 4-13 and 4-14, respectively. As seen in Fig. 4-11, the fluorene concentration in biotic run decreased from 5.61 to 0.58 mg/L, whereas no fluorene loss occurred in the abiotic control run. It can be seen from Fig. 4-12, the sulfate concentration decreased without a lag time (reduced from 14.8 to 11.7 mM). Furthermore, the bacterial densities increased significantly in biotic experiment (Fig. 4-13) and the trend was proportional to the decreases of fluorene, sulfate and COD (Fig. 4-14). These observations reveal that fluorene was biodegraded along with sulfate reduction. Thus, it can be concluded that fluorene biodegradation is due to the result of microbial behavior of SRB. No significant pH variation was observed in all experiments during the incubation period (Fig. 4-15). ORP of the biotic reactor decreased quickly from -60 to -300 mV within 3 days of incubation (Fig. 4-16). This result indicates that the systems were maintained at favorable growth conditions for SRB (Postgate, 1984).
Time (day) 0 5 10 15 20 25 Fluor ene (mg/L) 0 1 2 3 4 5 6 Biotic Abiotic
Fig. 4-11 Variation of fluorene concentration during biodegradation
Time (day) 0 5 10 15 20 25 Sulfate (mM) 10 11 12 13 14 15 16 Biotic Abiotic
Time (day) 0 5 10 15 20 25 OD 66 0 0.00 0.05 0.10 0.15 0.20 0.25 0.30 0.35 0.40 Biotic Abiotic
Fig. 4-13 Variation of bacterial cell density during biodegradation
Time (day) 0 5 10 15 20 25 COD (mg/L) 950 1000 1050 1100 1150 1200 1250 1300 1350 Biotic Abiotic
Time (day) 0 5 10 15 20 25 pH 0 2 4 6 8 10 12 14 Biotic Abiotic
Fig. 4-15 Variation of pH during biodegradation
Time (day) 0 5 10 15 20 25 ORP ( m V) -400 -300 -200 -100 0 100 Biotic Abiotic
4.4.2 Observations of FISH Analysis
The presence and relative abundance of SRB in the enrichment culture were determined by the FISH analysis. The total cell counts were performed using the DAPI staining approach. The epifluorescence micrographs of DAPI-stained and hybridized with probes EUB338, SRB385 and SRB385Db are shown in Fig. 4-17. It can be seen from Fig. 4-17, the major portion of the detected cells was rod-shaped. Figs. 4-17(a) and (b) illustrate that a large fraction of the bacteria in the enrichment culture could be detected by the FISH technique. The universal bacterial probe EUB338 hybridized approximately 87% of the total DAPI-stained cells (Figs. 4-17(a) and (b)). In this study, the sum of SRB detected by probes SRB385 and SRB385Db was regarded as the total SRB population. As shown in Figs. 4-17(c) and (d), 61% of the total DAPI-stained cells are hybridized with SRB385 probe. The SRB385Db probe hybridized around 24% of the total DAPI-stained cells (Figs. 4-17(e) and (f)). It has been reported that Desulfovibrio, Desulfomicrobium and Desulfobulbus species can be hybridized with SRB385 probe (Rabus et al., 1996; Ito et al., 2002). In addition, SRB385Db probe is used to hybridize Desulfobacteriaceae species (Kleikemper et al., 2002). These results indicate that SRB was the major species (around 85%) in the enriched bacterial culture.
(a) (b)
(c) (d)
(e) (f)
Fig. 4-17 Epifluorescence micrographs of bacteria (day 1). (a) DAPI stained cells, (b)hybridization with probe EUB338 (same microscopic field with (a)), (c) DAPI stained cells, (d) hybridization with probe SRB385 (same microscopic field with (c)), (e) DAPI stained cells, and (f) hybridization with probe SRB385Db (same microscopic field with (e))
4.4.3 Kinetics of Fluorene Biodegradation
The extent of fluorene degradation can be determined by calculating the degradation rate constant. In this study, the fluorene degradation rate was evaluated using zero-order and first-order kinetics. The zero-order fluorene degradation rate constant was estimated as 0.21 mg/L-d (1.27 μM/d, R2
= 0.78), and first-order fluorene degradation rate was 0.1/d (R2 = 0.96), as shown in Fig. 4-18. The first-order model provided a slightly superior fit to the fluorene degradation data than the zero-order model. Chang et al. (2002) reported that the degradation rate of PAHs was found to fit well with the first-order kinetics.
C ( mg /L ) 0 1 2 3 4 5 6 Experimental data Regression curve Time (day) 0 5 10 15 20 25 ln C -1.0 -0.5 0.0 0.5 1.0 1.5 2.0 (a) (b) y = -0.2122x + 4.3465 R2 = 0.78 y = -0.1x + 1.5291 R2 = 0.96
Fig. 4-18 Biodegradation of fluorene. (a) Regression of concentration vs. time data for zero-order kinetics, and (b) regression of concentration vs. time data for first-order kinetics
In addition to the investigation of the potential and advantage of SRB enrichment cultures for fluorene biodegradation under anaerobic conditions, a comparison was made with other reports in terms of fluorene degradation rates (Table 4-5). The values of degradation rate (zero-order) differ considerably across the literature (Coates et al., 1997) as well as in this study. This may be due to the difference in initial fluorene concentration, experimental period and bacterial genus/species (Meckenstock et al., 2004). Chang et al. (2002) reported that the degradation rate of fluorene under sulfate reducing conditions (0.095/d) was higher than the nitrate reducing conditions (0.018/d). However, the direct comparison of degradation rates with the literature is difficult due to the reasons mentioned above. A higher degradation rate (0.1/d) was observed in this study. Therefore, it can be concluded that the efficiency of fluorene biodegradation was enhanced by SRB enrichment culture.
Table 4-5 Fluorene removal rates under anaerobic conditions
Degradation rate Reference Initial concentration Inoculum Reaction time Electron
acceptor Zero-order First-order Coates et al. (1997) 1.0 μCi Marine
sediment 63 days Sulfate 0.06 μM/d ---
Nitrate --- 0.018/d Chang et al. (2002) 2 mg/Kg River
sediment 90 days Sulfate --- 0.095/d This study 5 mg/L Aquifer
It can be seen from Fig. 4-19 that a two-stage degradation was observed in the biotic reactor. The degradation rate of fluorene shows a rapid initial phase from 0 to 3 days (represented as k1) followed by a slower and longer phase from 4 to 21 days (represented as k2). The
degradation rate constants of fluorene were determined using the first-order kinetics equation (Chang et al., 2002). Fluorene degradation rates in the first (k1) and second stages (k2) were
found to be 0.248/d and 0.083/d, respectively. This result indicates that SRB could use fluorene rapidly in the first stage without any lag time. Coates et al. (1997) reported that fluorene was degraded rapidly in the beginning of experiment under sulfate reducing conditions.
Time (day) 0 3 6 9 12 15 18 21 24 ln C -1.0 -0.5 0.0 0.5 1.0 1.5 Experimental data Regression curve First-stage k1 = 0.248/d Second-stage k2 = 0.083/d ln C 0 1 2 3 4 5 6 Experimental data (a) (b) y1 = - 0.2478x + 1.7579 R12 = 0.99 y2 = - 0.0832x + 1.2793 R22 = 0.99 Stage Ⅰ Stage Ⅱ
4.5 Inhibition Study
4.5.1 Biodegradation of Fluorene
The fluorene removal percentage in each run is shown in Fig. 4-20. It is evident that the runs with lower initial concentrations of fluorene had higher fluorene removal percentages and vice-versa. The initial concentration of fluorene was different in the inhibition study. The calculated first-order fluorene biodegradation rates are shown in Table 4-6. These results show that SRB activity was decreased at higher concentration of fluorene, which could be attributed to the toxicity of fluorene to microorganism (Yuan et al., 2001).
Run 2 3 4 5 6 7 8 9 Fluorene removal ( % ) 0 20 40 60 80 100 120 100 100 89.3 66.5 59.4 29.4 19.2 10.6