國立交通大學
機械工程學系
博士論文
火焰在有限長度 PMMA 燃料及伴隨熱輻射效
應下傳播情形之數值模擬研究
Numerical Study For Downward Flame Spread Over A Finite-Length PMMA With Radiation Effect
研 究 生 : 張文奎
指導教授
: 陳俊勳 教授
火 焰 在 有 限 長 度 PMMA 燃 料 及 伴 隨 熱 輻 射 效 應 下 傳 播 情 形
之 數 值 模 擬 研 究
Numerical Study For Downward Flame Spread Over A Finite-Length
PMMA With Radiation Effect
研 究 生: 張文奎 Student:Wen-Kuei Chang
指導教授: 陳俊勳教授 Advisor:Prof. Chiun-Hsun Chen
國 立 交 通 大 學 機械工程學系
博 士 論 文
A Dissertation
Submitted to Department of Mechanical Engineering College of Engineering
National Chiao Tung University in Partial Fulfillment of the Requirements
for the Degree of Doctor of Philosophy in Mechanical Engineering
July 2006
Hsinchu, Taiwan, Republic of China
火 焰 在 有 限 長 度 PMMA 燃 料 及 伴 隨 熱 輻 射 效 應 下 傳 播 情 形 之 數 值 模 擬 研究 學 生 : 張 文 奎 指 導 教 授 : 陳 俊 勳 國立交通大學機械工程研究所
摘要
本論文係以暫態燃燒模式來模擬在風洞中逆向傳播火焰在有限長度 PMMA 燃料及考慮熱輻射效應時,火焰由引燃至穩定燃燒傳播的一連續過 程。論文內容可分為三部分。在第一部分中主要的研究參數包括逆向進氣 速度、逆向進氣溫度以及燃料厚度等。模擬結果則是主要包括火焰引燃時 間以及火焰傳播速率。在不同參數的改變之下對於火焰引燃時間及火焰傳 播速率的影響將在本部分中詳細分析與討論。另外本研究各項所得的模擬 結果也會與相關的實驗數據(潘英杰,1999)以及數值模擬(吳國光等人, 2003)互相比較,經由比較的結果發現本研究的模擬結果會比先前吳國光 等人所模擬的結果更接近實驗所量測的數據,其原因是在本研究當中多加 考慮了幾項因素包括密閉空間效應、有限長度的燃料以及氣相和固相的熱 輻射等。 第二部分主要是研究逆向進氣速度對於火焰傳播行為的影響。在此部 分中所模擬的逆向進氣速度範圍為 0~100 公分/秒,而在先前的研究包括潘 英杰(1999),吳國光等人(2003)以及本論文第一部分所模擬的逆向進氣速度 範圍則是 40~100 公分/秒。由氣相與固態燃料溫度、固態燃料預熱長度以 及熱通量等模擬結果來探討火焰引燃及傳播等行為。由模擬結果得知火焰引燃時間隨著逆向進氣速度的增加而增加。但是火焰傳播速率可由逆向進 氣速度分為兩個區域。首先火焰傳播速率隨逆向進氣速度增加,當逆向進 氣速度到達 32 公分/秒時,火焰傳播速率達到最大值,接著隨著逆向進氣 速度的增加而減小。當逆向進氣速度小於 32 公分/秒時,火焰主要是受氧 氣傳輸效應的影響。當逆向進氣速度大於 32 公分/秒時,火焰主要則是受 拉伸效應的影響。除此之外,本研究顯示熱輻射效應增加火焰引燃時間並 且減小火焰強度與傳播速率。逆向進氣溫度與固態燃料溫度對於火焰傳播 行為的影響也在本部分中被探討,另外模擬結果顯示當逆向進氣速度增加 時,則逆向進氣速度效應將會大於逆向進氣溫度效應。 第三部分主要是利用三維燃燒模式來探討在風洞中逆向傳播火焰在有 限長度 PMMA 燃料上傳播之情形。此部分主要是探討三維效應對於火焰傳 播的影響。逆向進氣速度為主要之模擬參數。火焰由引燃至傳播的過程將 會在此部分中詳細討論。火焰引燃時間會隨著逆向進氣速度的增加而增 加,但在三維模擬中火焰引燃時間大於二維模擬所得結果而且隨著逆向進 氣速度的增加,二維與三維之間火焰引燃時間的差異會變小。由模擬結果 顯示火焰傳播速率隨著逆向進氣速度的增加而減少而由火焰傳至風洞壁面 的熱損失則會使火焰強度變弱。而本模擬結果與相關實驗如潘英杰(1999) 與數值模擬如吳國光等人(2003)與本論文第一部分的結果做比較。其比較結 果發現在較低的逆向進氣速度之下,本模擬結果會與實驗所得之數據更為 接近。
Numerical Study For Downward Flame Spread Over A Finite-Length PMMA With Radiation Effect
Student : Wen-Kuei Chang Advisor : Chiun-Hsun Chen Department of Mechanical Engineering
National Chiao Tung University
Abstract
This study utilizes an unsteady combustion model to investigate the ignition delay and subsequent downward flame spread over a finite-length PMMA slab under an opposed flow with the effect of radiation included in a two-dimensional wind tunnel. This study consists of three parts. In the first part, the variable parameters studied are the opposed flow temperature and velocity and the solid fuel thickness, respectively. The major simulated results include the ignition delay time and the flame spread rate. The influences of the variable parameters on the ignition delay time and the flame spread rate are discussed in detail in this section. Additionally, the predictions of the present model are compared with the corresponding experimental measurement of Pan (1999) and the simulation of Wu et al. (2003). The comparison shows that the simulated results of the present model are more similar to the experimental values because the several factors, such as enclosure, finite-length fuel plate and both gas and solid phase radiations are considered in the present combustion model.
In the second part, the opposed flow velocity is used as a parameter to study the flame spread behavior. The opposed flow velocities simulated herein are
varied from 0 to 100cm/s, whereas the ones used by Pan (1999), Wu et al. (2003) and the first part of present dissertation are varied from 40 to 100cm/s. The gas and solid phase temperatures, preheat length and heat flux are considered in order to examine the flame ignition and spread characteristics. The numerical results reveal that the ignition delay time increases with the opposed flow velocity. However, the flame spread rate varies with the opposed flow velocity in a non-monotonic manner that can be identified as two distinct regimes with a peak
value in between. The flame spread rate reaches a maximum at u∞ =32cm/s,
and then falls, regardless of whether the flow velocity is increasing or decreasing. For u∞ <32cm/s, the flame behaviors are dominated by oxygen transport. For
s cm
u∞ >32 / , the flame stretch effect controls the flame behavior. Additionally, this work demonstrates that the effect of radiation delays the flame ignition and reduces both the flame strength and the corresponding spread rate. The effects of the opposed flow temperature and thickness of the solid fuel are also investigated. The predicted results indicate that a higher opposed flow temperature or a thinner solid fuel facilitates the ignition and accelerates flame spread. The effect of opposed flow velocity eventually overcomes that of opposed flow temperature as the flow speed is further increased.
In the third part, the three-dimensional unsteady combustion model is utilized to investigate the downward flame spread over a finite-length PMMA slab under an opposed flow in the wind tunnel. The aim of this section is to examine the 3D effect on the flame spread over the solid fuel surface. The opposed flow velocity is used as parameter and the ambient oxygen concentration is at 0.233. The entire process from ignition to subsequent flame spread over the solid fuel surface is demonstrated in detail. The ignition delay time increases with an increase of opposed flow velocity. However, the ignition delay times of 3D problem are greater than ones of 2D problem and the discrepancies of ignition
delay time between the 2D and 3D problems are decrease with an increase of opposed flow velocity. The simulated results indicate that the flame spread rate decreases with an increase of opposed flow velocity and the flame intensity becomes weaker due to the heat loss from the flame to the lateral walls of wind tunnel. Additionally, the simulated results of the present model are compared with the corresponding experimental measurement of Pan (1999) and the predictions of Wu et al. (2003) and the first part of present dissertation. The comparison shows that the simulated flame spread rates of the present model are similar to the experimental values, especially in the lower speed flow regime.
誌謝
感謝恩師陳俊勳教授悉心教導 感謝我須要感謝的每一個人 謝謝你們 謝謝 Irene 妳的一路相隨 將本論文獻給我最敬愛的母親與在天堂的父親Contents
摘要 ... I ABSTRACT ... III 誌謝 ... VI CONTENTS ... VII LIST OF TABLES ... IX LIST OF FIGURES ... X NOMENCLATURE ... XV CHAPTER 1 ... 1 INTRODUCTION ... 1 1.1 Background ... 1 1.2 Literature survey ... 21.3 Scope of the present study ... 9
CHAPTER 2 ... 12
MATHEMATICAL MODEL ... 12
2.1 Description ... 12
2.2 Governing equations in dimensional form ... 12
2.3 Radiation model ... 18
2.4 Governing equations in non-dimensional form ... 22
2.5 Solution methodology ... 26
CHAPTER 3 ... 32
3.1 Numerical study for downward flame spread over a finite-length PMMA
slab with radiation effect in a two-dimensional wind tunnel ... 33
3.2 Effect of opposed flow on flame spread over a finite-length PMMA slab in a two-dimensional wind tunnel ... 42
3.3 The investigation of downward flame spread over a finite-length PMMA slab in a wind tunnel by using the unsteady three-dimensional combustion model ... 51
CHAPTER 4 ... 58
CONCLUSIONS ... 58
REFERENCES ... 62
List of tables
Table 1 Non-dimensional governing equations ... 77
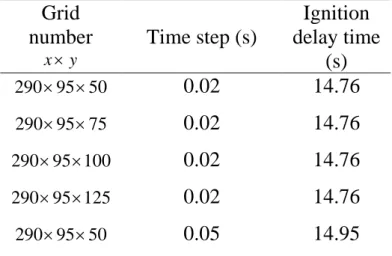
Table 2 Grid and time step test results ... 78
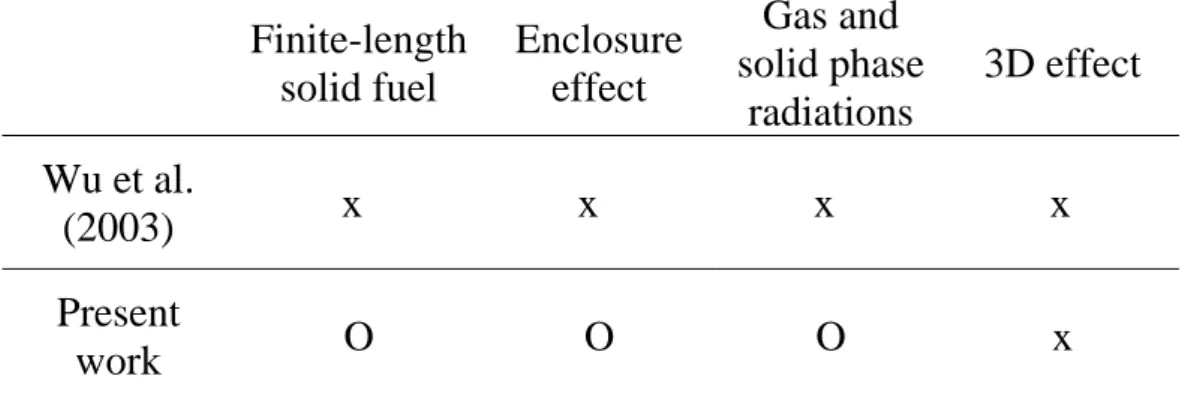
Table 3 The discrepancies between the combustion models of Wu et al. (2003) and present work. ... 79
Table 4 Gas and solid properties values ... 80
Table 5 Non-dimensional parameters ... 81
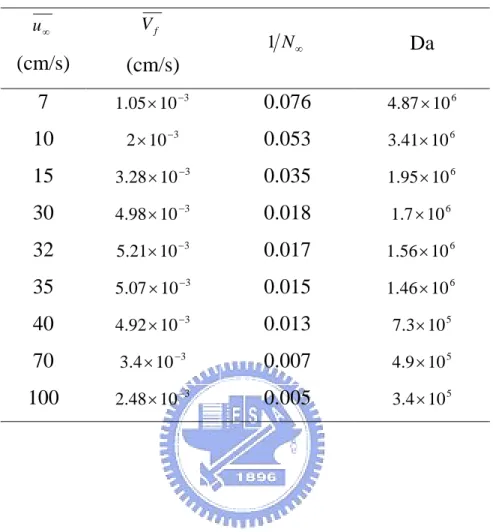
Table 6 Effect of changing opposed flow velocity ... 82
Table 7 Non-dimensional governing equations ... 83
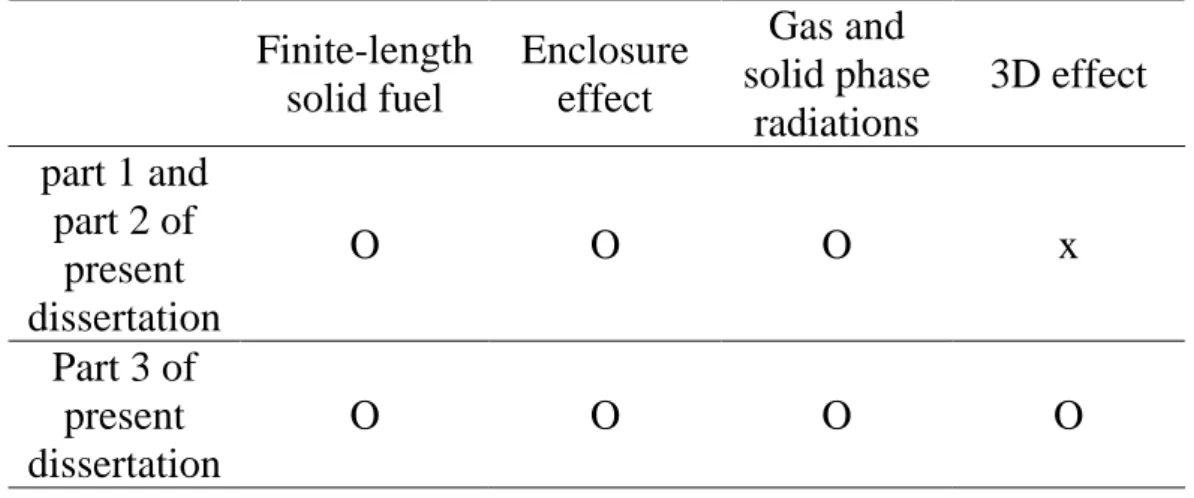
Table 8 The discrepancies between the part 1 and part 2 of present dissertation and the present work. ... 84
List of figures
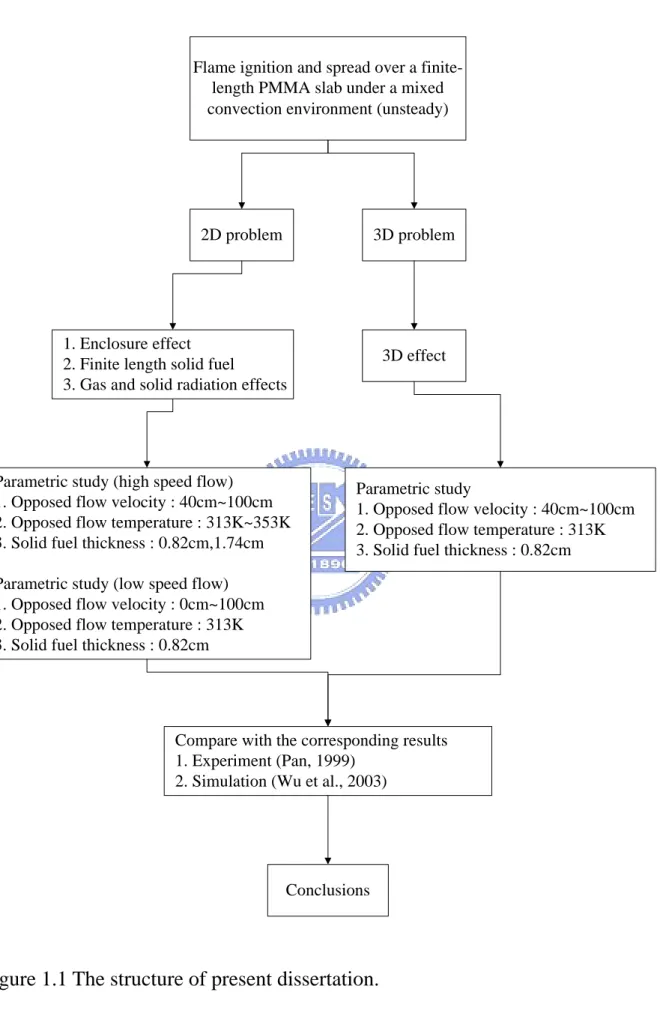
Figure 1.1 The structure of present dissertation. ... 86
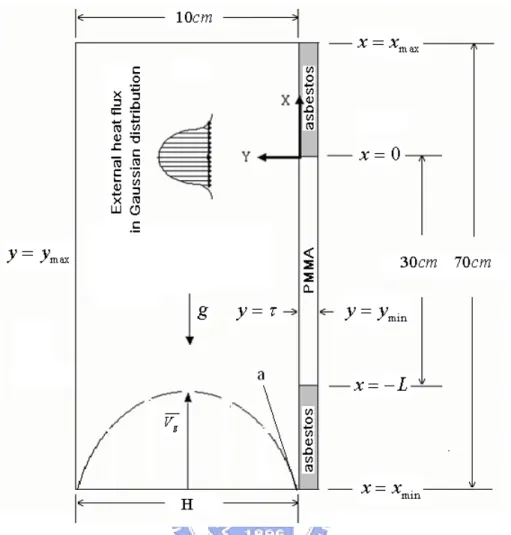
Figure 2.1 The schematic of flame spread over a thick PMMA slab in the mixed air flow in a wind tunnel. ... 87
Figure 2.2 The non-uniform mesh distribution. ... 88
Figure 2.3 Computational algorithm for transient analysis. ... 89
Figure 3.1.1 The steady temperature along PMMA surface under different
opposed flow velocities for (a) u∞ =40cm/s (b) u∞ =70cm/s (c)
s cm
u∞ =100 / , and the opposed flow temperatures are 313K, 333K and 353K,
respectively. (solid and dashed lines represent the measurements and predictions, separately) ... 90
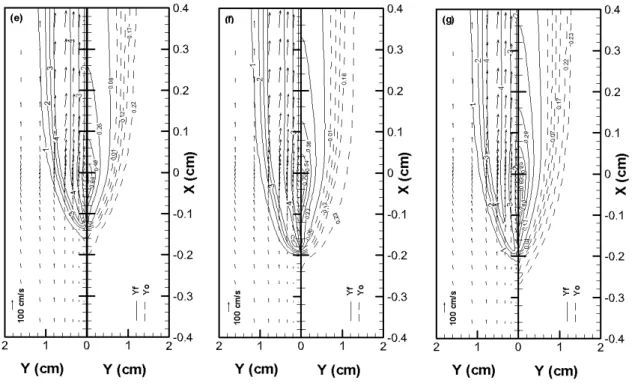
Figure 3.1.2 Time history of the flame profiles for u∞ =40cm/s, Ti =313Kand
cm 82 . 0 = τ at (a)t =12.5s , (b) t =14.12s , (c) t =14.14s , (d)t =14.16s , (e)t =17.08s, (f)t =21.24s, (g)t = 25s. Right half: fuel and oxidizer mass fraction distributions. Left half: temperature contours and flow velocity vector distribution. ... 91
Figure 3.1.2 (continue) Time history of the flame profiles for u∞ =40cm/s ,
K
Ti =313 and τ =0.82cm at (a) t =12.5s , (b) t =14.12s , (c) t =14.14s ,
(d)t =14.16s, (e)t =17.08s, (f)t =21.24s, (g)t = 25s. Right half: fuel and oxidizer mass fraction distributions. Left half: temperature contours and flow velocity vector distribution. ... 92
Figure 3.1.3 Ignition delay time versus the opposed flow temperature under different opposed flow velocity for solid fuel thicknesses are 0.82cm and 1.74cm, respectively. ... 93
different opposed flow velocity, the solid fuel lengths are (a) finite (b) infinite (c) finite (d) infinite (e) finite (f) finite, respectively. ... 94
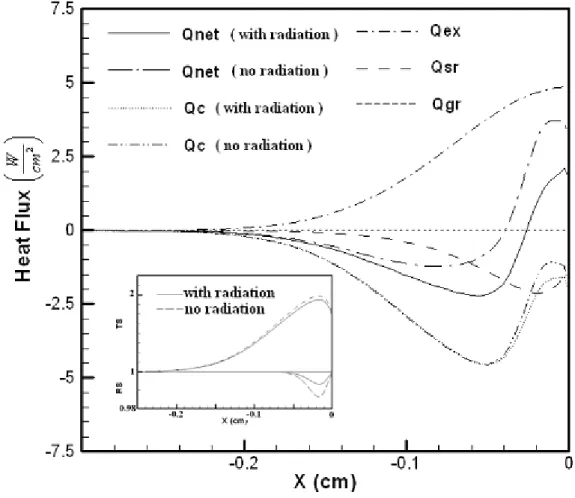
Figure 3.1.5 The distribution of heat fluxes along the solid fuel surface at
s
t =13.72 , u∞ =40cm/s , Ti =313K and τ =0.82cm with and without
radiation effects. The inset plots the distributions of the non-dimensional solid fuel temperature and the solid fuel density, respectively. ... 95
Figure 3.1.6 The pyrolysis front position varies with time at u∞ =70cm/s ,
K
Ti =333 and τ =0.82cm. ... 96
Figure 3.1.7 The flame spread rate versus the opposed flow temperature under different opposed flow velocities for the solid fuel thickness τ =0.82cm. . 97
Figure 3.1.8 The flame spread rate versus the opposed flow temperature under different opposed flow velocities for the solid fuel thickness τ =1.74cm. 98
Figure 3.1.9 The temperature contours of gas and solid phases and vector distribution at t =25s , u∞ =40cm/s and τ =0.82cm for (a) Ti =313K , (b)Ti =333K and (c)Ti =353K, respectively. ... 99
Figure 3.1.10 The distribution of heat fluxes along the solid fuel at t =25s,
40 =
∞
u cm/s and τ =0.82cm. The insets show the peak value of qnet for
(a)Ti =313K, (b)Ti =333K and (c)Ti =353K, separately. ... 100
Figure 3.1.11 The temperature contours of gas and solid phases and vector distribution at t =25s , Ti =313K and τ =0.82cm for (a) u∞ =40cm/s , (b)u∞ =70cm/s and (c) u∞ =100cm/s, respectively. ... 101
Figure 3.1.12 The temperature contours of gas and solid phases and vector distribution at t =25s, u∞ =40cm/s, Ti =313K and solid fuel thicknesses (a)
cm 82 . 0 = τ (b) τ =1.74cm, respectively. ... 102
Figure 3.1.13 The temperature contours of gas and solid phases and vector
s cm
u∞ =40 / , Ti =313K and τ =0.82cm. ... 103
Figure 3.1.14 The gas phase temperature contour distributions over the solid fuel surface for (a) Pan’s experiment (b) present work and (c) Wu’s model, at
s
t =25 , u∞ =40cm/s, Ti =313K and τ =0.82cm. The figure 13(a) displays the flame temperature in Kelvin temperature scale and the non-dimensional temperature simultaneously. ... 104
Figure 3.2.1 Ignition delay times as functions of opposed flow velocity at a fixed opposed flow temperature of 313K with and without radiation. ... 105
Figure 3.2.2 Flow velocity vector distributions and non-dimensional temperature contours for gas and solid phases at various opposed flow velocities, (a)7cm/s, (b)15cm/s, (c)32cm/s, (d)40cm/s, (e)70cm/s and (f)100cm/s, at a fixed opposed flow temperature of 313K. The centerline of wind tunnel is at 5cm along the Y axis of left hand side (not display in the figure)... 106
Figure 3.2.3 Fuel and oxidizer mass fraction distributions at various opposed flow velocities, (a)7cm/s, (b)15cm/s, (c)32cm/s, (d)40cm/s, (e)70cm/s and (f)100cm/s, at a fixed opposed flow temperature of 313K. ... 107
Figure 3.2.4 Flame spread rates versus opposed flow velocity at a fixed opposed flow temperature of 313K with and without radiation. ... 108
Figure 3.2.5 Heat flux magnitudes qgr and qsr at various opposed flow
velocities at a fixed opposed flow temperature of 313K. qgr and qsr,
represent the gas phase radiation feedback to solid fuel and the radiation heat loss from the solid fuel to the ambient. ... 109
Figure 3.2.6 Temperature contour of gas phase and streamline distribution at a fixed opposed flow temperature of 313K and opposed flow velocities of 7cm/s, 32 cm/s and 100cm/s. ... 110
Figure 3.2.7 Preheat lengths versus opposed flow velocity at a fixed opposed flow temperature of 313K with and without radiations. ... 111
Figure 3.2.8 Maximum flame temperatures versus opposed flow velocity at a fixed opposed flow temperature of 313K with and without radiation. ... 112
Figure 3.2.9 Total heat fluxes gained by solid fuel versus opposed flow velocity at a fixed opposed flow temperature of 313K with and without radiations, respectively. ... 113
Figure 3.2.10 Ignition delay times versus opposed flow temperature under different opposed flow velocity for solid fuel thicknesses of 0.82cm and 1.74cm. ... 114
Figure 3.2.11 Flame spread rate versus opposed flow temperature under different
opposed flow velocity for solid fuel thicknesses of 0.82cm and 1.74cm. 115
Figure 3.3.1 The schematic of downward flame spread over a finite-length PMMA slab in the mixed air flow in a wind tunnel. ... 116
Figure 3.3.2 The non-uniform mesh distribution. ... 117
Figure 3.3.3 The flame profiles at t =30s , u∞ =40cm/s , Ti =313K and
cm
82 . 0 =
τ . Right half: the simulated result of present work. Left half: the
camera image obtained by Pan’s experiment. ... 118
Figure 3.3.4 The three-dimensional flame profiles and flow velocity vectors for
s cm
u∞ =40 / , Ti =313K and τ =0.82cm at (a) t =1s (b) t =14.76s (c)
s
t =14.78 and (d) t =25s. ... 119
Figure 3.3.5 Ignition delay times as functions of opposed flow velocity at a fixed opposed flow temperature of 313K and solid fuel thickness of 0.82cm for 2D and 3D problems, separately. ... 120
Figure 3.3.6 The flame spread rate versus the opposed flow temperature under different opposed flow velocities, 40 cm/s, 70 cm/s and 100 cm/s for opposed flow temperature of 3131K and the solid fuel thickness of 0.82 cm. Notably, there are three computed results in each solid and dash line. .... 121
contours of gas phase for (a) 2D problem and (b) 3D problem, respectively, at a fixed opposed flow velocity of 40cm/s and temperature of 313K and solid fuel thickness of 0.82cm. ... 122
Figure 3.3.8 The flame characteristics on X-Z plane for opposed flow velocity of 40cm/s and temperature of 313K and solid fuel thickness of 0.82cm at t = 25s. The right half displays the gas phase temperature contours and flow velocity vectors; the left half presents the fuel and oxidizer mass fractions, respectively. ... 123
Figure 3.3.9 The flame characteristics on Y-Z plane for opposed flow velocity of 40cm/s and temperature of 313K and solid fuel thickness of 0.82cm at t = 25s. The right half displays the gas phase temperature contours and flow velocity vectors; the left half presents the fuel and oxidizer mass fractions, respectively. ... 124
Figure 3.3.10 The flame characteristics on Y-Z plane for opposed flow velocity of 100cm/s and temperature of 313K and solid fuel thickness of 0.82cm at t = 25s. The right half displays the gas phase temperature contours and flow velocity vectors; the left half presents the fuel and oxidizer mass fractions, respectively. ... 125
Nomenclature
a Absorption coefficient, 1/cm
A Pre-exponential factor for fuel pyrolysis, 1/s
B Pre-exponential factor for gas phase reaction, cm3/mols
E Activation energy, J/mol
C The specific heat ratio of the gas mixture to solid fuel, Cp Cs p
C Specific heat for gas mixture, J/gK
s
C Specific heat for solid fuel, J/gK
D Specific diffusivity, cm2/s
Da Damköhler number, Bρ*δ /Vr
E Non-dimensional activation energy, E RT∞ f Stoichiometric oxidizer/fuel mass ratio
g Non-dimensional gravitational acceleration, g /ge
e
g Earth normal gravity, cm s2
Gr Grashof number, 3 * *2
)
(ρ ρf δ ρ ν
g ∞ −
0
I Zeroth moment of intensity
k Conductivity, W/cmK
L Non-dimensional latent heat, L/CsT∞
L Latent heat, J/g
Le Lewis number, α /D
s
m ′′ Non-dimensional mass flux, "α* ρ 2τ
/ s r
s V
m ∞
∞
N Conduction-radiation parameter based on T∞, * 3 *
/σT∞ α V
k r
Pr Prandtl number, ν /α
q Heat of combustion per unit mass of fuel, J/g c
q Conductive heat flux, W/cm2 ex
q External heat flux, W/cm2 gr
q Gas phase radiation heat flux, W/cm2 sr
q Solid phase radiation heat flux, W/cm2 net
q Net heat flux, W/cm2
R Non-dimensional density Re Reynolds number, ρ*α* μ*
t Time, s
T Gas phase temperature, K
s
T Solid phase temperature, K
i
T Incoming flow temperature, K
u Velocity parallel to the fuel surface, cm/s
∞
u Opposed flow velocity, cm/s
v Velocity normal to the fuel surface, cm/s
f
V Flame spread rate, cm/s
r
V Reference velocity, cm/s
x Coordinate parallel to the fuel surface, cm
y Coordinate normal to the fuel surface, cm
F
Y Fuel mass fraction
O
Y Oxygen mass fraction
Greek Symbols
γ Temperature ratio, T /* T∞
δ Reference length, cm ρ Density of gas phase, g/cm3
s
ρ Density of solid fuel, g/cm3 τ Solid fuel thickness, cm
σ Stefan-Boltzmann constant, J/K4cm2s
λ Wavelength, μm
ε Surface emissivity
μ Non-dimensional dynamic viscosity, *
/μ μ ν Kinematic viscosity, cm2/s
F
ω& Non-dimensional gas phase reaction rate
Overhead Dimensional quantities Superscript * Reference state " Flux Subscript ex External i Incoming flow max Maximum min Minimum o Oxizider s Solid phase ∞ Ambient condition
Chapter 1
Introduction
1.1 Background
This work investigates flame ignition and the characteristics of the subsequent flame spread over a finite-length PMMA slab in an opposed convection environment in a wind tunnel, using an unsteady combustion model that incorporates both gas and solid phase radiations. The corresponding experimental test channel is 70 cm long with a rectangular
cross section of 10*10 cm2. The specimens are mounted on the groove of
the test section and the sides of the groove are covered with asbestos plates. Thermocouples and a laser holographic interferometer are used to measure the temperatures of the solid fuel surface and the gas, respectively. This study is motivated by an earlier study of Wu et al. (2003), which only considered the ignition and the subsequent flame spread over a fuel plate of infinite-length in an open atmosphere without both gas and solid phase radiations. In that investigation, the differences between the predicted flame spread rates and the corresponding experimental measurements were attributed to the effects such as the enclosure, the fuel length, the gas and solid phase radiations and the 3D effect. Hence, this work makes an intensive modification according to the aspects mentioned above. The serial parameters studies are performed to investigate the influences of these effects on ignition and flame spread behavior and attempt to mitigate the discrepancies between results of the numerical predictions and the experimental measurements.
1.2 Literature survey
Pan (1999) and Chen (1999) investigated the steady flame spread characteristics over PMMA in an opposed forced convection environment in a wind tunnel. The variable parameters were the velocity and the temperature of the opposed flow and the thickness of solid fuel. They found that the flame spread rate increases with an increase flow temperature, a drop in the flow velocity or the fuel thickness. Their image results further showed that the thermal boundary layer becomes thicker as the opposed flow temperature increases at a fixed flow velocity or the opposed flow velocity declines at a constant flow temperature. Wu et al. (2003) developed an unsteady combustion model with mixed convection to explore the flame spread behaviors of a thick PMMA slab of infinite length in an environment with opposed flow. The simulated flame spread rates were compared with the measurements made by Pan (1999). The results were highly consistent except in the low-speed flow regime. The discrepancies can be attributed to the radiation, fuel size and the three dimensional effect are not under the consideration in the model. Fujita et al. (2000) experimentally studied the radiative ignition on paper sheet in microgravity. The results showed that the gas phase temperature becomes higher than that of the solid surface before ignition, and the main mechanism of radiative solid ignition here is due to the gas phase reaction. Furthermore, the ignition delay time strongly depends on the oxygen concentration and ambient pressure. It decreases with a higher oxygen concentration or ambient pressure. Fujita et al. (2002) experimentally investigated the effect of external flow on flame spread over polyethylene wires in microgravity. The results revealed that the flame spread rate is controlled mainly by preheat length, standoff distance and flame temperature. The flame spread phenomenon can be divided into three regimes based on flow velocity. These are an oxygen transport control
regime, a geometrical effect regime and a chemical-kinetics controlled regime.
Wichman (1983) developed a theoretical model to estimate the rate of flame spread under conditions of heat transfer control with account taken of the fact that the gas velocity was not uniform. The results indicated that the functional dependence of the spread rate on the external gas velocity is modified from the one obtained in the classical study of DeRis (1968). Thereafter, Wichman (1992) explained two mechanisms for the extinguishment of spreading flames. In the first, the particle residence time in the reaction zone is reduced by the increased flow velocity, giving a blow off extinction. In the second, flow velocity decreases toward flame spread rate and extinction again occurs eventually. Takahashi et al. (2002) analytically and experimentally studied flame spread over a thin PMMA sheet in microgravity. They concluded that reducing the relative flow velocity enlarges the size of preheat zone, increasing radiant loss, and that radiant heat loss reduces the flame spread rate and may also cause extinction. Olson et al. (2001) experimentally investigated the radiative ignition and subsequent three dimensional flame spread over thin cellulose fuels. They found that gas phase residence time over the heated spot is a critical parameter in ignition delay. After ignition, the flame in a fan shaped pattern spreads from the central ignition spot and is toward upstream. The flame spread angle increases with increasing external air flow and oxygen concentration. They also found that due to the oxygen shadow effect, the upstream and downstream flame spread over the fuel plate is not observed simultaneously. The downstream flame only starts to spread after upstream flame spread is complete and extinguished. Ito et al. (2005) experimentally investigated the propagation and extinction mechanisms of opposed-flow flame spread along a thick slab of PMMA. They showed that as the opposed-flow rate increases or the ambient
oxygen concentration decreases, the Damkohler number decreases. When the Da falls below a critical value, extinction or no flame spreading may occur. The radiative heat loss has very little effect on the extinction because it is small compared with the other heat transfer rates. The results also demonstrated that the steady flame spread rate is proportional to the net total heat transfer rate to the preheat zone. However, no matter what the enough heat feedback to the preheat zone or not, the flame spread rate decreases rapidly when nearing the extinction limit.
West et al. (1994) studied the surface radiation effects on flame spread over thermally thick fuels in an opposed flow. They concluded that the fuel surface radiation is important for thermally thick fuel at all flow levels, however, and it is important for thermally thin fuel only at low velocity level. Bhattacharjee and Altenkirch (1991) developed a numerical model to study the effect of surface radiation on flame spread in a quiescent microgravity environment by using the oxygen concentration and solid surface emittance as parameters. They found that the flame spread rate and temperature decrease as solid surface emittance increases in any oxygen level, and the flame shrinks in size while moving closer to the surface. In the other hand, the rate of decrease in flame spread rate being more severe at higher values of solid surface emittance and lower oxygen levels. Bhattachariee et al. (2000) experimentally, computationally, and analytically investigated the downward flame spread over a polymethylmethacrylate plate in an oxygen/nitrogen environment at normal gravity. They presented that the flame spread rates in the thermal regime as the fuel thickness was changed from the thin- to the thick-limit. A simple formula for the transition thickness between the thin and thick fuel regimes was proposed, and it seemed to agree well with experimental measurements. From the computational results, they also concluded that the radiative effects seem not to influence the flame spread rate except at
very high ambient pressures. Rhatigan et al. (1998) examined the effects of gas phase radiation on the burning and extinction of a solid fuel. They plotted the heat fluxes, flame temperature and burning rate as functions of the flow stretch rate. The computed results demonstrated that the gas phase radiative effects are stronger at lower stretch rates. Fernandez-Pello and Hirano (1982) experimentally studied the controlling mechanism of flame spread over the surface of combustible solids. The heat transfer and gas phase chemical kinetic aspects of the flame spread process were addressed respectively for the flame spread in oxidizing flow. They indicated that chemical kinetics of gas phase plays a critical role and it must be considered when flame spread in opposed gas flow occurs at near extinction or non-propagating conditions. Son and Ronney (2002) experimentally studied flame spread over thermally thick fuels. They found that the radiative preheating and reabsorption effect are less important in normal gravity, because a substantial flow velocity is caused by buoyancy, reducing the thickness of the flame and thereby reducing the volume of radiating gas. Takahashi et al. (2000) and Ayani et al. (2006) examined flame spread rates over PMMA sheets in normal gravity and in microgravity. They found that the flame spread rate over a thermally thin fuel is inversely proportional to the thickness of the fuel, whereas that over a thermally thick fuel is proportional to the opposed flow velocity, in complete agreement with analyzed research by DiRis (1969). Other investigations, such as Wichman and Williams (1983a), Wichman and Williams (1983b) and Delichatsios (1986), have developed formulas that show identical proportionalities. Tizon et al. (1999) analyzed the wind-aided flame spread process along a solid fuel rod under oblique forced flow. Their results indicated that the effects of gas-phase chemical kinetics were important for large strain rates and the spread rate depended strongly on the strain rate. They also found that the effects of radiation
from the gas phase are negligible because the heat transfer by convection typically dominates at large Reynolds numbers of the transverse velocity. Zhu and Gore (2005) studied the opposed-flow laminar methane/air diffusion flames by the numerical simulations. They indicated that the peak flame temperature and the soot volume fraction increase with increasing pressure or decreasing injection velocity for all radiation conditions. The soot and gas radiation effects are stronger at the higher pressures or lower velocities. The simulated results also showed that the peak soot volume fraction and soot emission index decrease by 85 and 97% with an increase in injection velocity from 10 to 100 and 200 cm/s, separately.
Kumar et al. (2003a) used a two dimensional flame spread model with flame radiation to compare the extinction limits and spreading rates in opposed and concurrent spreading flames over thin solids. The varying parameters were oxygen percentage, free stream velocity, and flow entrance length. Numerical results showed that at low free stream velocities with shorter entrance length, the flame spread rates are higher and have a lower oxygen extinction limit, whereas in high free stream velocities, the flame spread rates are lower and have a higher oxygen extinction limit. The flame spread rate in opposed flow varies with free stream velocity in a non-monotonic manner, with a peak rate at an intermediate free stream velocity. The flame spread rate in concurrent flow increases linearly with free stream velocity. Kumar et al. (2003b) also presented a numerical study on flame-surface radiation interaction in flame spread over thin solid fuels in quiescent microgravity and in normal gravity environments. It was observed that the flame in microgravity is very sensitive to the surface radiation properties. The fuel with high solid absorptivity can absorb substantial flame radiation and flame spreads faster than the corresponding adiabatic case irrespective of value of solid
emissivity. Lin and Chen (1999) investigated how the gas-phase radiation, whose model included both the cross-stream and stream-wise gas phase radiation coupled with solid phase one, affected the spreading flame. By comparing the results with the predicted ones of Chen and Cheng (1994), which only considered the radiation effect in cross-stream direction. They concluded that the stream-wise radiation contributes to reinforce the forward heat transfer rate subsequently increasing the flame spread rate.
Di Blasi (1995a) examined, by numerical simulation, the effects of the thickness on the concurrent spread of flames over thin and thick fuels under forced convection. Three main flame spread regimes were identified. In the kinetic region, the flame spread rate increases with the solid fuel thickness below 0.008 cm. In the thermally thin region, the flame spread rate falls as the solid fuel thickness increases in the range from 0.008 cm to 0.5 cm. Finally, in the thermally thick region, the flame spread rate becomes almost constant when the solid fuel thickness exceeds 0.5 cm. Di Blasi (1995b) also investigated the opposed flame spread over cellulosic fuels in a microgravity environment, using the forced gas flow and the solid thickness as the varied parameters. For very thin fuels, flame spread rate increases with the solid thickness and the solid radiative heat loss controls the flame spread rate. As the fuel thickness becomes thicker, the flame spread rate decreases with the solid thickness and the flame radiative heat transfer playas role of increasing importance. For the thick fuels, flame radiation is reduced whereas surface radiative heat loss is again at a high level. Suzuki et al. (1994) studied the downward flame spread over paper sheets of thickness between 0.4 and 10mm to investigate the mechanisms by which flames spread. They identified four flame spreading behaviors under the conditions in the four regions. The flame spread is stable at the limiting thickness of the paper sheets. They also derived an energy equation for the heat flux through the pyrolytic region
and the solid surface in front of the leading edge.
Nakabe et al. (1994) investigated the ignition and transition to flame spread over a thermally thin fuel in a microgravity environment. A comparison was made between the axis-symmetric configuration and a two-dimensional configuration. The results indicated that ignition is earlier in two-dimensional configuration and the difference between the two configurations is roughly 25% in the same boundary conditions. Jiang and Fan (1995) made the predictions of flame spread in slow forced flow under gravitational acceleration normal to the fuel surface and flame spread in a quiescent environment in an enclosed chamber under gravitational acceleration parallel to the fuel surface. The results indicated that the effect of oxygen transport on flame spread is greater than that of heat transfer in a microgravity environment. In addition, the microgravity level has a significant effect on the flame spread over a vertical wall in an enclosed chamber under gravitational acceleration parallel to the fuel surface. Mell and Kashiwagi (2000) numerically studied the effects of finite sample width on transition and flame spread in microgravity. They found that the finite width effects are insignificant when the ambient wind is relatively large and the influence of thermal expansion on the net incoming oxygen supply decreased as the ambient wind speed increased. Thus, the flame spread behavior of the three-dimensional flame tended to that of the two-dimensional flame with increasing ambient wind speed.
Nakamura et al. (2002) numerically studied the enclosure effect on the spread of the flame over solid fuel under microgravity. Because the confinement of the flow field and the thermal expansion initiated by heat and mass addition in the chamber, the flame spread rate for the case with enclosure is faster than the one without any enclosure. The predictions also showed that the enclosure effect is stronger at lower flow velocity.
Shih and T’ien (1997) theoretically studied the concurrent flow flame spread over a thin solid in a low speed flow tunnel. They found that the flow is accelerated in the downstream as the tunnel height is decreased. The flame is pressed to the solid fuel and the heat conduction rate to the solid; the flame length and the spread rate are also increased. However, the conductive heat loss to the wall becomes great which reversed the trend and decreases the flame length as the tunnel height becomes too small. Shih and T’ien (2000) numerically investigated the concurrent spread of flames over a thin solid in a low-speed flow tunnel in microgravity. The simulated results demonstrated two distinctive flame behaviors. With a high oxygen content or fast flow, the flame was long and far from the quenching limit. With a low oxygen content or slow speed, the flame was short and in the region near the quenching limit. They also found that the three dimensional effect on flame spreading was stronger in the low-speed flow regime. Shih and T’ien (2003) numerically studied the concurrent flame spread over a thin solid in a low-speed flow tunnel in microgravity by using three-dimensional combustion model. Several 3D effects due to the presence of the tunnel walls are examined. The walls change the velocity profiles and accelerate the flow in a direction parallel to the fuel. The cold walls conduct heat away from the flame, which produces heat loss and a quenched layer. Moreover, the oxygen side diffusion enhances the combustion reaction at the base region and pushes the flame base closer to the solid surface, increasing the flame spread rate. They also concluded that 3D effects are dominated by the heat loss to the side walls in the downstream portion of the flame and the flame spread rate increases with fuel width in higher speed flows.
1.3 Scope of the present study
investigates the flame ignition and subsequent flame spread characteristics over a finite-length PMMA slab under mixed convection conditions using an unsteady combustion model that incorporates both gas and solid phase radiations in a wind tunnel. This study consists of three topics. The first topic modifies several aspects of the original combustion model of Wu et al. (2003), such as the enclosure, the finite-length fuel plate and the gas and solid phase radiations. The varying parameters, such as opposed flow velocity and temperature and the solid fuel thickness, are in the same ranges as those used in the Pan’s experiment (1999). The entire process, from ignition to subsequent flame spread, is examined in detail. Additionally, the influences of the opposed velocity and temperature, the solid fuel thickness and length and the gas and solid phase radiations on the flame spread behavior are studied as well. The simulated results are compared with the corresponding experimental measurement of Pan (1999) and the prediction of Wu et al. (2003).
The second topic studies the flame spread in the lower flow velocity regime to investigate the influence of radiation on the flame spread behavior. The aforementioned series of studies, such as those of Pan (1999), Wu et al. (2003) and the part 1 of present dissertation, concluded that the influence of opposed flow velocity on the flame spread behavior exceeds that of opposed flow temperature as flow velocity is increased further, and that the discrepancies between the predicted and measured results, especially in the low flow speed regime are due to the radiation effect. Moreover, numerous investigations, such as those of West et al. (1994), Rhatigan et al. (1998), Tizon et al. (1999) and Zhu and Gore (2005), demonstrated that the radiation effect becomes stronger as the flow speed declines. Therefore, this work systematically investigates the effect of opposed flow velocity on the flame spread characteristics considering the radiation effect over a finite-length PMMA slab in a two-dimensional wind
tunnel. The opposed flow velocities simulated herein are varied from 0 to 100cm/s, whereas the ones used by Pan (1999), Wu et al. (2003) and the part 1 of present dissertation are varied from 40 to 100cm/s. The effects of opposed flow temperature, solid fuel thickness and radiation heat loss at various flow velocities are also discussed.
In the third topic, the three-dimensional unsteady combustion model is basically developed from the original two-dimensional one of part 1 of present work to investigate the influences of 3D effect on the flame spread behavior over a finite-length PMMA slab. The earlier investigations demonstrated that the effect of opposed flow velocity on the flame spread behavior is greater than one of opposed flow temperature. Furthermore, numerous studies, such as those of Mell and Kashiwagi (2000), Nakamura et al. (2002) and Shih and T’ien (2003), indicated that the 3D effect is dominated by the flow velocity. Therefore, the parametric study in this part utilizes the opposed flow velocity as parameter to investigate the influence of 3D effect on ignition and subsequence flame spread behavior. The opposed flow temperature and the solid fuel thickness are fixed at 313K and 0.82cm, respectively. The entire process from ignition to subsequent flame spread is examined in detail and the simulated results are also compared with the corresponding experimental data of Pan (1999) and the predictions of Wu et al. (2003) and the part 1 of present dissertation. Finally, possible extensions of this work are suggested.
The writing sequence of present dissertation is: the mathematical model as well as the corresponding governing equations, initial and boundary conditions and solution methodology are presented in the chapter 2. A detailed discussion in simulated results is given in the chapter 3. Finally the conclusions are presented in the chapter 4.
Chapter 2
Mathematical model
2.1 Description
Figure 2.1 presents the physical configuration of two-dimensional ignition over a vertically oriented PMMA slab in a mixed convective environment. The test section of the wind tunnel is 70 cm long and 10 cm high. The solid fuel plates used in the simulation are 30 cm long and 0.82 cm and 1.74 cm thick. The solid fuel is assumed to be homogeneous, meaning that its composition is uniform. At t<0, a steady flow in the wind tunnel builds up over the entire test section. In the channel flow the
surface velocity gradient is given by a=4Vg /H , where Vg is the
centerline flow velocity and H is the height of the wind tunnel. At t≥0, an external heat flux with a Gaussian distribution with a width of 0.5 cm
and a peak value of 5 W/cm2, is imposed on the solid fuel surface and
centered at x=0, where the top end of the solid fuel is connected to an adiabatic plate. Restated, only half of the incident radiation energy is used to heat the PMMA fuel. The solid fuel absorbs the external heat flux to raise its temperature gradually. Then, the solid fuel begins to pyrolyze and generate fuel vapors, which mix with air to form the flammable mixture adjacent to the surface of the fuel. Ignition occurs when the gas phase temperature is high enough to promote the chemical reaction. Subsequently, the flame begins to propagate, eventually reaching a steady rate of flame spread.
2.2 Governing equations in dimensional form
modified from those developed by Lin and Chen (2000) and Wu and Chen (2004). However, Wu and Chen (2004) applied the P1 radiation model, in which the semi-gray scheme is adopted to define the effective absorption coefficient. Since the gas phase radiative properties depend strongly on the temperature and mixture concentrations, the simple assumptions used in these prior simulations are unrealistic and unsuitable for determining the radiative properties. Therefore, this work modifies the model of Wu and Chen (2004) by using the narrow band model instead of the P1 model to calculate the gas phase absorption coefficient and the radiation intensity. In this problem, the mathematical model consists of both gas and solid phase equations, which are coupled at the interface. This study makes the following assumptions for gas and solid phase.
In the gas phase, the following assumptions are made. 1. The flow field is two-dimensional.
2. The average molecular weight is constant.
3. The mixture is assumed to be an ideal gas with a constant and equal specific heat, equal binary diffusion coefficient, constant Prandtl and
Lewis numbers and a constant value of ρμ.
4. Viscous dissipation and compressive work are neglected.
5. The Soret and Duffour effects as well as the pressure gradient diffusion are neglected.
6. The gas phase chemistry is described using a one-step overall chemical reaction.
7. The reaction rate is described by a second-order Arrhenius law kinetics.
In the solid phase, the assumptions are made.
1. The solid fuel is assumed to be homogeneous that its compositions are uniform.
3. An Arrhenius-typed pyrolysis law is used to describe the fuel gasification.
4. The solid thickness is remained constant by assuming the flame spreads relatively fast enough that the fuel surface near the flame base remains approximately flat.
5. A burnout is defined when the solid fuel density becomes 7 percent of its virginal value and the char is removed simultaneously.
The assumptions regarding radiation in gas and solid phases are as follows: 1. Gas phase radiation is 2D. The narrow band model is employed to
determine the radiation heat flux.
2. The gas is optically thin and the scattering effect is neglected because the production of soot is not considered in the gas phase chemical reaction.
3. The participating media are CO2 and H2O.
4. Soot radiation and surface reflectivity are neglected. 5. The fuel surface is opaque and diffuse.
The gas and solid phases governing equations in dimensional form are listed as follows:
Gas phase governing equations: Continuity equation:
( )
0 ) ( = ∂ ∂ + ∂ ∂ + ∂ ∂ y v x u t ρ ρ ρ (2.1) X-momentum equation:(
ρ ρ)
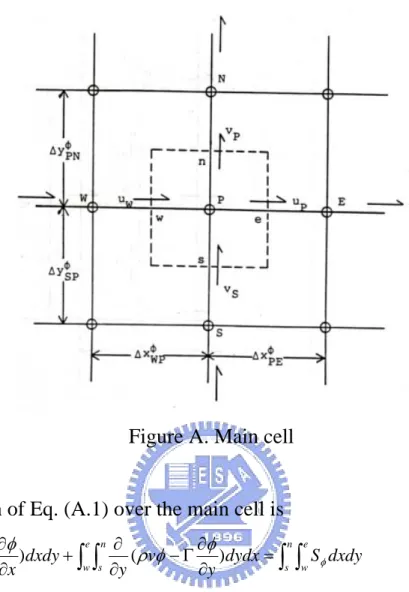
μ μ μ ρ ρ ρ − + ⎥ ⎦ ⎤ ⎢ ⎣ ⎡ ⎥ ⎦ ⎤ ⎢ ⎣ ⎡ ∂ ∂ + ∂ ∂ ∂ ∂ + ⎥ ⎦ ⎤ ⎢ ⎣ ⎡ ⎥ ⎦ ⎤ ⎢ ⎣ ⎡ ∂ ∂ + ∂ ∂ − ∂ ∂ ∂ ∂ + ∂ ∂ − = ∂ ∂ + ∂ ∂ + ∂ ∂ ∞ g x v y u y y v x u x u x x P y u v x u u t u 3 2 2 (2.2) Y-momentum equation:⎥ ⎦ ⎤ ⎢ ⎣ ⎡ ⎥ ⎦ ⎤ ⎢ ⎣ ⎡ ∂ ∂ + ∂ ∂ ∂ ∂ + ⎥ ⎦ ⎤ ⎢ ⎣ ⎡ ⎥ ⎦ ⎤ ⎢ ⎣ ⎡ ∂ ∂ + ∂ ∂ − ∂ ∂ ∂ ∂ + ∂ ∂ − = ∂ ∂ + ∂ ∂ + ∂ ∂ x v y u x y v x u y v y y P y v v x v u t v μ μ μ ρ ρ ρ 3 2 2 (2.3) Energy equation: r F p p p q q y T k y x T k x y T v C x T u C t T C ⎥− −∇⋅ ⎦ ⎤ ⎢ ⎣ ⎡ ∂ ∂ ∂ ∂ + ⎥ ⎦ ⎤ ⎢ ⎣ ⎡ ∂ ∂ ∂ ∂ = ∂ ∂ + ∂ ∂ + ∂ ∂ ρ ρ ω ρ & (2.4) where y q x q q r y r x r ∂ ∂ + ∂ ∂ = ⋅
∇ is the gas phase radiation term.
Fuel species equation:
F F F F F F y Y D y x Y D x y Y v x Y u t Y ρ ρ ρ ρ ω ρ ⎥+ & ⎦ ⎤ ⎢ ⎣ ⎡ ∂ ∂ ∂ ∂ + ⎥⎦ ⎤ ⎢⎣ ⎡ ∂ ∂ ∂ ∂ = ∂ ∂ + ∂ ∂ + ∂ ∂ (2.5) Other species equation:
i i i i i i y Y D y x Y D x y Y v x Y u t Y ρ ρ ρ ρ ω ρ ⎥+ & ⎦ ⎤ ⎢ ⎣ ⎡ ∂ ∂ ∂ ∂ + ⎥⎦ ⎤ ⎢⎣ ⎡ ∂ ∂ ∂ ∂ = ∂ ∂ + ∂ ∂ + ∂ ∂ (2.6) where i=O2,CO2,H2O
The gas phase chemistry is described by the one-step overall chemical reaction, which is1
[
fuel]
+ fO[ ]
O2 → fC[
CO2]
+ fH[
H2O]
+qwhere
O
f : stoichiometric O2 fuel mass ratio
C
f : stoichiometric CO2 fuel mass ratio
H
f : stoichiometric H2O fuel mass ratio
q: heat of combustion per unit mass of fuel
The corresponding reaction rate is described by a second-order Arrhenius-typed chemical kinetics, ω&F =−Bρ2YFYO exp(−E RT), and the
relationship among these reaction rates is expressed as follow.
H H C C O O F ω f ω f ω f
ω& = & =− & =− & . Equation of state:
T R
P=ρ (2.7)
The viscosity variation with temperature is assumed to be:
r
T C1
=
μ (2.8)
where C1 is a determined constant and the index r, usually ranged from
0.75 to 1.25 (Turns, 1996), is adopted as 1.0. Since the incoming flow velocity around the flame is much slower than the speed of sound, the ratio of the pressure difference to the absolute pressure throughout the region of interest is much less than one, implying that the dependence of density on pressure can be ignored. Therefore, the relationship between gas phase density and temperature can be rewritten as:
T
1 ∝
ρ (2.9) Solid phase governing equation:
Conservation of mass equation:
⎟ ⎟ ⎠ ⎞ ⎜ ⎜ ⎝ ⎛ − ⎟ ⎟ ⎟ ⎟ ⎟ ⎠ ⎞ ⎜ ⎜ ⎜ ⎜ ⎜ ⎝ ⎛ − − = ∂ ∂ − = ∂ ′′ ∂ ∞ s s s sf sf s s s s T R E A t y m exp 1 ρ ρ ρ ρ ρ (2.10)
Conservation of energy equation:
(
)(
)
[
]
y T C m T T C C L y m y T k x T k t T C s p s s p s s s s s s s s s ∂ ∂ − − − + ∂ ′′ ∂ + ∂ ∂ + ∂ ∂ = ∂ ∂ ∞ " 2 2 2 2 ρ (2.11)These two equations provide a system of coupled partial differential
equations to be solved for ρs and Ts under the given boundary and
initial conditions and the heat transfer by conduction from gas phase to solid phase is obtained as soon as the gas phase equations are solved. The governing equations are subjected to the following initial and boundary conditions.
Initial conditions: Gas phase:
At t ≤0 ∞ ∞ = = = = = = − = = Hy y v Y Y Y Y Y T T H u y u u ( ) 42 ( 2), 0, F C H 0, O O , (2.12) Solid phase: At t ≤0 ∞ ∞ = = s Ts T s ρ , ρ (2.13) Boundary conditions: Gas phase: At x=xmin 0 ), ( 4 ) ( = 2 − 2 = = Hy y v H u y u u (2.14) 4 0 3 2 1 , , , 0 ∞ ∞ ⎟ = ∞ ⎠ ⎞ ⎜ ⎝ ⎛ ∂ ∂ − = = = = = I T x a T T Y Y Y Y YF C H O O σ (2.15) At x=xmax 0 0 = ∂ ∂ = ∂ ∂ = ∂ ∂ = ∂ ∂ = ∂ ∂ = ∂ ∂ = ∂ ∂ = ∂ ∂ x Y x Y x Y x Y x I x T x v x u F O C H (2.16) At y=τ, −L≤ x≤0 w w w s m v T T u=0, = , ′′ =ρ (2.17) τ ρ = ∂ ∂ − ′′ = ′′ y F Fw w Fs w y Y D Y m Y m (2.18) τ ρ = ∂ ∂ − ′′ = ′′ y i iw w is w y Y D Y m Y m , wherei=O2,CO2,H2O, YFs =1,Yis =0 (2.19) 4 0 3 2 1 I Ts y a ⎟⎟⎠ =ε ⎞ ⎜⎜ ⎝ ⎛ ∂ ∂ − (2.20) At y=τ, xmin ≤x≤−L, 0≤x≤xmax 0 0 = ∂ ∂ = ∂ ∂ = ∂ ∂ = ∂ ∂ = ∂ ∂ = ∂ ∂ = = y Y y Y y Y y Y y I y T v u F O C H (2.21) At y= ymax
0 0 = ∂ ∂ = ∂ ∂ = ∂ ∂ = ∂ ∂ = ∂ ∂ = ∂ ∂ = = y Y y Y y Y y Y y I y T v u F O C H (2.22) Solid phase: At x=−L ∞ = s s ρ ρ , Ts = T∞ (2.23) At x=xminand x= xmax
0 = ∂ ∂ x Ts (2.24) At y= yminand xmin ≤x≤ xmax
0 = ∂ ∂ y Ts (2.25) At y=τ, −L≤ x≤0
(
)
τ τ εσ μ r y s ex s s q T T q y T y T k + − − + ∂ ∂ = ∂ ∂ ∞ 4 4 (2.26) where − τ(
Ts4 −T∞4)
εσ and τ r y qare heat lost by radiation from solid to ambient gas and radiation feedback from gas to solid, respectively.
At y=τ, xmin ≤x≤−Land 0≤x≤xmax
0 = ∂ ∂ y Ts (2.27) 2.3 Radiation model
The transfer of energy from and within a burning environment is controlled by diffusive, convective and radiative processes. Because the temperatures associated with combustion are high, a proper physical description needs to account for radiation unless the characteristic radiation-to-convection ratio of the system is small. Bhattacharjee and Grosshandler (1989) define the following radiation/convection parameter,
flux of material brought into the flame times its heat capacity, ρiuicp, and
the optical thickness of the system based upon the absorption coefficient, a , and a stream-wise dimension. The highly absorbing fires in large volumes can be strongly influenced by radiation; conversely, a large thermal input can diminish the importance of radiation if the absorption properties, temperature and volume of interest remain about constant. However, the absorption coefficient of the cool gases surrounding a fire can influence the transfer of energy from a burning object to a distant object.
The radiation model used in the study of Wu and Chen (2004) is the P1 model, which the semi-gray scheme is adopted to define the effective absorption coefficient. Because the gas phase radiative properties are highly dependent on the temperature and mixture concentrations, the simple assumptions are unrealistic and unsuitable to determine the radiative properties. Therefore, this work modifies the original model of Wu and Chen (2004) by using the narrow band model instead of the P1 model. The present radiation model incorporates the subroutine RADCAL developed by Grosshandler (1993) to determine the gas absorption coefficient. The absorption coefficient of the combined gases is calculated from a narrow band model and a combination a tabulated spectral properties and theoretical approximations to the vibration-rotational molecular bands.
For the forced convection channel flow, the radiation terms
x qrx ∂ ∂ and y qry ∂ ∂
in Eq. (2.4) can be expressed as (Siegel and Howell, 1992):
⎟ ⎟ ⎠ ⎞ ⎜ ⎜ ⎝ ⎛ − = ∂ ∂ I T a x qrx π σ π 4 4 (2.28)
⎟ ⎟ ⎠ ⎞ ⎜ ⎜ ⎝ ⎛ − = ∂ ∂ I T a y qry π σ π 4 4 (2.29)
Substitute Eqs. (2.28) and (2.29) into the energy equation (2.4) and the radiation term can be expressed as
⎟ ⎟ ⎠ ⎞ ⎜ ⎜ ⎝ ⎛ − = ∂ ∂ + ∂ ∂ = ⋅ ∇ a T I y q x q q r y r x r π σ π 4 8 (2.30) in which π σ 4 T
represents the blackbody intensity, Ib , and I is the
radiation intensity. I can be obtained from the solution of the radiation transfer equation, which is listed as below (Grosshandler,1980):
∫ ∫
∞=∫
⎟⎠ ⎞ ⎜ ⎝ ⎛− ′ = 0 0 exp 0 ω ω ω ω π ω U u b k du dud e k I (2.31)where kω and ebω respectively represent the spectral absorption
coefficient and Planck’s blackbody distribution function. The spectral absorption coefficient and the spectral optical depth of the combustion products, including carbon dioxide and water vapor, are calculated according to the narrow band model, RADCAL (Grosshandler, 1993). RADCAL utilizes the optical depth to determine the spectral transmittance and intensity as each new spatial element is added to the radiating path. Radiation from the far wall is counted after being attenuated by the calculated transmittance along the total length of the path. Then, the spectral intensity is integrated across the spectrum to obtain the total radiated energy flux.
The radiation transfer equation (2.31) can be represented by the spectral transmittance, τω, and the expression can be rewritten as
∫ ∫
∞= − = 0 ) ( 1 ) , ( ω τ ω ω ω τ π ω l b T d e I (2.32) where τω is defined as ) ( ) (l e Xω l ω τ = − (2.33)and Xω represents the optical depth, defined as
∫
′ ′ = lk l dl l X 0 0 ) ( ) ( ρ ρ ω ω (2.34)for the mixture of carbon dioxide and water vapor. The combined optical depth along a non-homogeneous path can be obtained by adding together the contributions to optical depth from each species, therefore, Eq. (2.34) can be rewritten in the form as (Grosshandler,1980):
[
]
dl l T P T l P l k l P l k l X mix l w w c c ′ ′ ′ ′ + ′ ′ =∫
) ( ) ( ) ( ) ( ) ( ) ( 0 0 0 , , , ω ω ω (2.35)where the subscripts c and w refer to the carbon dioxide and water vapor, respectively.
The radiation properties of carbon dioxide and water vapor are highly non-gray and the steep gradients of the temperature and composition concentrations in the combustion system cause significant non-homogeneity for the radiation properties. Therefore, the
determination of proper values of kωused in Eq. (2.35) is an important
issue. The Curtis-Godson approximation (1964) presented the absorption coefficient in a non-homogeneous gas of path length, l, and the expression is 2 1 0 0 2 2 0 0 , ) ( ) ( ) ( 1 4 ) ( ) ( 1 ) ( − ⎥ ⎥ ⎥ ⎥ ⎥ ⎦ ⎤ ⎢ ⎢ ⎢ ⎢ ⎢ ⎣ ⎡ ′ ′ ′ ′ ⎟⎟ ⎠ ⎞ ⎜⎜ ⎝ ⎛ ′ ′ + =
∫
∫
l d l l d S l d d S l d l d S l k l L CG l CG CG ρ ρ γ ρ ρ ω (2.36)where the S d is the mean line-strength to spacing parameter and can be
found by summing up the contributions to line strength, S, from each rotational line divided by the distance, d, between adjacent lines. The
other important parameter in the equation is 1d, which represents the
mean inverse line spacing.
temperature and wave number. For the carbon dioxide, they are determined from the modified anharmonic oscillator/rotator model developed by Malkmus (1963). For the water vapor, they are tabulated based upon the experimental measurements by Ludwig et al. (1973). The narrow band model, RADCAL (Grosshandler, 1993), utilizes these data of carbon dioxide and water vapor to calculate the absorption coefficient for the primary infrared bands. Finally, the spectral optical depths of each individual species can be determined and the radiation intensity of combustion gases will be obtained by the radiation transfer equation.
2.4 Governing equations in non-dimensional form
This combustion model solves the system of governing equations non-dimensionally. This procedure can avoid too large or too small values appearing in computation. Now a nondimensionalization procedure is presented as follows. The choice for the reference velocity (Vr ), temperature (
*
T ) and the characteristic length (δ ) are specified first. The opposed flow velocity is selected as reference velocity in this study. The reference temperature is defined as the average temperature of the
ambient temperature (T∞ ) and adiabatic flame temperature (Tf ). The
thermal diffusion length is chosen as the characteristic length, defined as
r
V
/
*
α
δ = , which is based on the balance between the convection and
conduction terms in the energy equation. According to the selected reference velocity, temperature and characteristic length, the dimensionless quantities are defined as follows.
δ / x x= y= y/δ 2 * /α r V t t= r V u u= / v=v/Vr m m Vr * /ρ ′′ = ′′ ∞ =T T T / γ =T /* T∞ ρ = ρ/ρ*
e g g g = / * /μ μ μ= * 2 ) (P P Vr P= − ∞ ρ ∞ =E RT E q=q/CpT∞ Pr=ν /α D Le=α / Da=Bρ*δ /Vr 3 * *2 ) (ρ ρf δ ρ ν g Gr = ∞ − s p C C C = L=L/CsT∞ * k k ks = s ∞ = s s s ρ ρ ρ Ts =Ts/T∞ * /α α αs = s ∞ =E RT Es s/ * 2 r s s A V A = α * 2 / s s r ex ex q C T V q = α τρ ∞ ∞ τ ρ α* 2 " " / s r s s m V m = ∞ τ =τCsρs∞Vr /k* KP =KP ⋅δ * * * Re= ρ α μ I0 =I0 σT∞4 a=aδ * 3 * /σ ∞ α ∞ =k V T N r
The notation appeared above can be referred in nomenclature and the quantities with superscript * are evaluated at reference temperature. Consequently, the non-dimensional equations can be obtained by substituting above definitions into the dimensional equations. The resultant non-dimensional governing equations for both the gas and solid phases are expressed as follows.
Gas phase: Continuity equation: 0 ) ( ) ( = + + y v x u t ∂ ρ ∂ ∂ ρ ∂ ∂ ∂ρ (2.37) X-momentum equation: ) ( Re Re Re 3 2 Re 2 2 ρ ρ ∂ ∂ ∂ ∂ μ ∂ ∂ ∂ ∂ ∂ ∂ μ ∂ ∂ μ ∂ ∂ ∂ ∂ ∂ ∂ ρ ∂ ∂ ρ ∂ ∂ ρ − + ⎥ ⎦ ⎤ ⎢ ⎣ ⎡ ⎥ ⎦ ⎤ ⎢ ⎣ ⎡ + + ⎥ ⎦ ⎤ ⎢ ⎣ ⎡ ⎥ ⎦ ⎤ ⎢ ⎣ ⎡ + − + − = + + ∞ Gr x v y u y y v x u x u x x P y u v x u u t u (2.38) Y-momentum equation: