國
立
交
通
大
學
光電工程研究所
博 士 論 文
應用版畫色序法實現高畫質低功率之
節能液晶顯示器
A High Image Quality and Low Power Consumption
Eco-LCD Using Stencil Field-Sequential-Color Method
研 究 生:林芳正
指導教授:謝漢萍 博士
黃乙白 博士
應用版畫色序法實現高畫質低功率之
節能液晶顯示器
A High Image Quality and Low Power Consumption Eco-LCD
Using Stencil Field-Sequential-Color Method
研 究 生:林芳正 Student:Fang-Cheng Lin
指導教授:謝漢萍 博士 Advisors:Dr. Han-Ping D. Shieh
黃乙白 博士
Dr. Yi-Pai Huang
國 立 交 通 大 學
光 電 工 程 研 究 所
博 士 論 文
A Dissertation
Submitted to Institute of Electro-Optical Engineering College of Electrical and Computer Engineering
National Chiao Tung University in partial Fulfillment of the Requirements
for the Degree of Doctor of Philosophy
in
Department of Photonics August 2009
Hsinchu, Taiwan, Republic of China
應用版畫色序法實現高畫質低功率之
節能液晶顯示器
博士研究生:林芳正 指導教授:謝漢萍 教授
黃乙白 助理教授
國立交通大學 光電工程學系/光電所
摘 要
全球化的氣候異常變遷已被公認為近年來最重要的環保問題,面對這樣的窘境,開 發且廣泛使用節能家電用品成為讓地球永續發展的重要一環。有鑑於電視相關顯示產品 的用電量約佔家用電的百分之十,因此,本論文除了提升顯示器的影像品質外,更朝向 低耗能的環保液晶顯示技術發展。 本論文將液晶顯示器視為一組雙面板的顯示架構,包含一個高解析度的液晶面板與 一個可獨立調變光強度且由發光二極體 (LED) 組成的低解析度背光面板。在此雙面板的 架構下,分為兩個階段針對背光及液晶兩面板提出不同於先前的方法,進一步提升高動 態範圍 (high dynamic range, HDR) 及色序型 (field‐sequential color) 兩大顯示技術的顯 像品質。首先,在第一階段針對背光部分,提出 IMF (Inverse of a Mapping Function) 背光決 定法。IMF 可依據不同輸入影像,演算出符合該畫面特性的動態背光映對函數 (mapping function)。從實驗結果發現,利用 IMF 背光決定法,除了提升液晶顯示器的對比度外, 在維持與傳統液晶顯示器相同的最高亮度下,更大幅降低 30%的電能消耗。
在第二階段部分,由於色序型液晶顯示器在不需要彩色濾光片的情形下,可提升三 倍的光使用率以進一步降低電能消耗,但色序型顯示器確有著致命的潛在缺陷:色分離 現象。此缺陷將大幅降低影像品質,甚至造成人眼觀看時的不舒適感,因此提出優化無 彩色濾光片液晶面板的方法。不同於先前需要超過 300Hz 的子畫面更新頻率,我們提出 低於 240Hz 的版畫概念色序型液晶顯示技術 (Stencil‐FSC) 來抑制色分離現象並巧妙的 將高動態範圍技術應用於傳統的色序型顯示技術。如同版畫技巧,Stencil‐FSC 先將三原 色的影像內容初步集中於第一個子畫面,如此一來,可大幅降低剩下各子畫面的亮度, 僅用來補足第一個子畫面顯示不足的顏色。經由 80 張不同影像內容的模擬結果,色分 離平均抑制量為傳統色序型顯示器的 50%,從實際的拍攝結果也幾乎察覺不出色分離現 象。 最後,我們將 Stencil‐FSC 的概念硬體實現於 32 吋的色序型液晶顯示器。實驗量測 結果顯示其不僅提升影像對比至 26,000:1、114% NTSC 的色域表現,同時,更大幅降低 平均電能消耗至 35 瓦特以下,相當於傳統同尺寸 LED 背光液晶顯示器耗電量的 20%。 在如此低耗能高品質的顯示技術下,期許未來人類在與親朋好友享受高品質多媒體影像 的同時,也能為地球的永續發展盡一分心力。
A High Image Quality and Low Power Consumption
Eco-LCD Using Stencil Field-Sequential-Color Methods
Doctoral Student: Fang-Cheng Lin Advisors: Dr. Han-Ping D. Shieh Dr. Yi-Pai Huang
Department of Photonics & Institute of Electro-Optical Engineering
National Chiao Tung University
A
BSTRACTClimate change is now widely recognized as a major environmental problem. In creating a sustainable world, energy-efficient household electronics should be developed and popularized. Since TV-related activity occupies 10% of overall household power usage, developing high image performance and low power consumption “Eco-LCDs” becomes the main subject in this dissertation.
An LCD was studied as a dual-panel structure: a low resolution controllable LED backlight and a high resolution LC panel. Based on this dual-panel concept, we divided this dissertation into two stages and proposed novel methods to improve both high dynamic range (HDR) and field-sequential color (FSC) technologies.
In the first stage, we proposed the IMF method to optimize HDR-LCD backlight signals. IMF provided a dynamic backlight gamma to achieve high contrast ratio and high brightness images while reducing average power consumption by 30% when compared to the same size LED backlight LCD.
(CBU). In the second stage, we proposed the Stencil-FSC method at less than 240Hz field rate to suppress CBU. This method was much different from the prior CBU suppression methods which usually used field rate more than 300Hz. Stencil-FSC ingeniously applied local HDR technology to an FSC-LCD. The originality of Stencil-FSC was to use a multi-color image concentrating image luminance in a single field. The intensities of the residual primary-color sub-frames were therefore greatly reduced. Through simulations, CBU was suppressed by 50% for eighty test images when compared to conventional RGB-driving and made CBU almost imperceptible in experimental photos.
In addition, this dissertation successfully demonstrated the Stencil-FSC method on a 32-inch FSC-LCD to yield a high dynamic contrast of 26,000:1, a wide color gamut of 114% NTSC, and average power consumption of less than 35 Watts which was equivalent to 20% of the same size full-on LED backlight LCD. In the future, we expect that human beings will enjoy high quality multimedia with families or friends and simultaneously maintain a healthy Earth.
A
CKNOWLEDGEMENTS
經過交大四年的洗禮,終於在今年暑假完成了博士學業,也為自己的人生向前邁出 一大步。此時此刻,心中充滿著無限的喜悅及感恩的心,在此,對一路走來所有指導過 我的師長、陪伴我一起研究的實驗室伙伴及無時無刻鼓勵我的家人獻上誠摯的謝意。 首先要感謝我的指導教授:謝漢萍博士及黃乙白博士,兩位老師所提供的優質實驗 室,不僅擁有堪稱世界一流的軟硬體設備,更擁有豐富的業界資源。在謝老師嚴謹且耐 心地指導下,讓我在研究上屢屢有重大突破;同時,在黃老師亦師亦友的激勵下,更是 讓我們的研究團隊多次拿下比賽大獎。除此之外,兩位老師更是積極鼓勵我參加國際大 型會議以拓展國際觀,讓我可以在學生時期就能多次有著與國外頂尖研究團隊討論的機 會,對我的論文研究獲益良多。同時也要感謝口試委員:許根玉教授、王聖智教授、武 東星教授、程章林主任及連水池協理,由於您們對本論文的指導及口試時的建議及討論, 使本論文更臻完善。此外,由衷地感謝 Steve Wallace 老師多次幫此篇論文校稿並對於我 的口頭報告技巧給予相當多的建議。 四年的實驗室研究生涯,要感謝 HDR 和 FSC 團隊中與我一同打拼的學長、學弟妹們: 阿合仔、YK、振宇、國振、凌嶢、勝昌、雅婷、小明、建良、宛徵、致維、宜如、宜伶、 阿竹、毅翰、世勛、瑋玲、綺文、上翰和李玄。特別是均合、景明及期竹,感謝你們在 硬體及程式演算法方面的努力,讓我們多次為實驗室拿下許多榮譽,喜歡並珍惜與你們 並肩作戰的感覺。此外,更謝謝博士生涯期間,與我相互勉勵的舜哥(祝早日找到女友)、 安琪學姐、司芬學姐、康弘學長、企桓學長、仁宇學長、柏儒、予潔、MOCA、俞文、 淑萍、美儒、精益、奕智、小皮、侑興、坤岳、勇智、友群、仁杰、其霖、明農、柏全、 大白、浩彣、育誠、TJ、佑禛、博文、靖堯、俊賢、景文、怡菁、璧丞、裕閔、甫奕、 姚順、耆賢及泳材。更謝謝所辦姐姐們:雅惠、穎佳、Kate、賢敏、家貞、婉姝、裔文 及于蓓,在所有行政業務的協助。也謝謝一起為資格考打拼的萓蘘學姐、老歐及俊逸。 總之,是你們讓我的博班生活多采多姿,真的很感謝! 四年來所獲得的榮譽當然還包括著業界團隊給予的支援,在此感謝中華映管莫啟能 處長、戴文智博士、劉家麟經理、繼中、顯鈞;友達光電劉軍廷副總、汪德美副理、葉 斯哲副理、博仁及所有曾經幫助過我的優秀工程師群,謝謝你們! 最後,特別要將此論文獻給我的家人,尤其是在天上的老爸,恭喜您有個博士兒子。 此外,能順利取得學位,真的要感謝老媽多年在佛堂所積的善果,老哥、大嫂及老姊無 論在精神上或是物質上的支持也是功不可沒。當然,對於認識 13 年,從學生時期就一 直支持著我,直至今年三月完婚的老婆‐文娟,也要獻上無限的感恩,謝謝妳這段時間 對我無常脾氣的忍受,還經常給我打氣鼓勵。除此之外,也要感謝家族長輩從小到大的 支持及照顧:外公、岳母、阿姨、姨丈、大舅、大舅媽、小舅、小舅媽及姑姑們。也謝 謝其他與我從小一起長大的堂表兄弟姊妹們。最後將此喜悅分享給曾經教導過我的師長 以及一起成長的朋友們,真的很感恩,謝謝大家!T
ABLE OF
C
ONTENTS
摘 要 ... i
A
BSTRACT... iii
A
CKNOWLEDGES... v
T
ABLE OFC
ONTENTS... vi
F
IGUREC
APTIONS... ix
T
ABLEL
IST... xiv
C
HAPTER1
I
NTRODUCTION... 1
1.1 THIN FILM TRANSISTOR LIQUID CRYSTAL DISPLAYS (TFT-LCDS) ... 2
1.2 ISSUES OF CURRENT TFT-LCDS ... 4
1.3 LED-BASED LCDTECHNOLOGIES ... 6
1.3.1 High Dynamic Range Display Systems ... 7
1.3.2 Field-Sequential Color LCDs ... 8
1.4 MOTIVATIONS AND OBJECTIVES ... 9
1.5 ORGANIZATION OF THIS DISSERTATION ...12
Chapter 2
P
RINCIPLES... 13
2.1 FUNDAMENTALS OF HIGH DYNAMIC RANGE DISPLAYS ...13
2.2 STRUCTURE OF THE HUMAN EYE ...15
2.3 TYPES OF EYE MOVEMENTS ...17
2.3.1 Saccade and Fixation ... 17
2.3.2 Smooth Pursuit ... 18
2.4 COLOR BREAKUP MECHANISMS ...19
2.4.1 Static Color Breakup ... 19
2.4.2 Dynamic Color Breakup ... 20
2.5 COLOR SPACES AND COLOR DIFFERENCES ...21
2.5.1 Color Matching Functions and Three Tristimulus ... 21
2.5.2 CIELAB Color Space and Color Difference of ∆E*ab ... 23
2.5.3 Color Difference of CIEDE2000 ... 24
C
HAPTER3
D
YNAMICB
ACKLIGHTG
AMMA ONH
IGHD
YNAMICR
ANGELCD
S25
3.1 DUAL-PANEL DISPLAY FOR HDRIMAGES ...263.1.2 LC Signal Compensation ... 30
3.2 VERIFICATION ON A 37-INCH HDR-LCD ...32
3.2.1 Target Images and Hardware ... 32
3.2.2 Target Parameters ... 33
3.2.3 Results and Discussions ... 34
3.3 SUMMARY ...37
C
HAPTER4
CBU
S
UPPRESSION ANDL
OWP
OWERC
ONSUMPTION BYS
TENCIL-FSC
M
ETHOD... 38
4.1 PRIOR COLOR BREAKUP SUPPRESSIONS FOR FSC-LCDS ...38
4.2 STENCIL FIELD-SEQUENTIAL-COLOR METHOD ...40
4.2.1 Concept ... 40
4.2.2 Backlight Intensity Distribution ... 43
4.2.3 Production of Four Field-Images ... 44
4.3 OPTIMIZATION OF THE STENCIL-FSCMETHOD ...45
4.3.1 Relative CBU value for CBU Evaluation ... 45
4.3.2 Backlight Dimming Ratio—Optimizing for Multi-Color Field Image ... 46
4.3.3 Optimization for point spread function (PSF) and Backlight Divisions ... 49
4.4 SIMULATIONS AND EXPERIMENTS ...53
4.4.1 Simulations of CBU Suppression ... 53
4.4.2 Experiments on a 32-inch FSC-LCD ... 54
4.5 SUMMARY ...58
4.6 DISCUSSION ...58
C
HAPTER5
CBU
S
UPPRESSION--180H
ZS
TENCIL-FSC ... 60
5.1 180HZ STENCIL-FSCMETHOD ...61
5.1.1 Concept and Algorithm ... 61
5.1.2 Optimization of 180Hz Stencil-FSC ... 64
5.2 CBUSUPPRESSION COMPARISONS VIA SIMULATIONS ...69
5.2.1 Comparison to other Reduction Methods ... 69
5.2.2 360Hz-RGBKKK, 240Hz Stencil-FSC, and 180Hz Stencil-FSC ... 70
5.3 VERIFICATION ON A 120HZ 46-INCH MVALCD ...72
5.4 SUMMARY ...73
C
HAPTER6
C
ONCLUSION ANDF
UTURE WORK... 74
6.1 CONCLUSION ...74
6.1.1 Backlight Module: IMF for Dynamic Backlight Control ... 75
6.1.2 LC Panel: Color Filters Removed ... 75
6.3 FUTURE WORK--GREEN-COLOR SATURATION IMPROVEMENT ...79
6.4 FUTURE PERSPECTIVES ...81
6.4.1 Is 120Hz Stencil-FSC Possible? — Further Field Rate Reduction ... 81
6.4.2 Is an LCD Powered by a Battery Possible?— Further Power Reduction ... 81
R
EFERENCES... 83
A
PPENDIX... 88
F
IGURE
C
APTIONS
Fig. 1-1 Cause and effect of global warming. (a) Cause: rising carbon dioxide concentration and (b) a consequence: a helpless polar bear. ... 1 Fig. 1-2 The first wall-hanging televisions fabricated by Sharp Cooperation [2]. ... 2 Fig. 1-3 Traditional LCD structure: a backlight module and an LC panel. ... 3 Fig. 1-4 Low optical throughput in a CCFL-backlight LCD attributed to the low optical
transmittance efficiency of optical components. ... 5 Fig. 1-5 (a) Typical color filter transmittance spectra with illuminant spectra of a CCFL backlight
(top) and a RGB-LED backlight (bottom). (b) LCD color gamut with backlights employing the RGB LEDs, CCFLs and white LEDs [4]. ... 5 Fig. 1-6 Differing image color saturation and contrast ratio abilities in (a) CCFL backlight and (b)
RGB-LED backlight LCDs. ... 6 Fig. 1-7 A typical materials cost structure of a 32-inch LCD panel (Q4’ 2008)[5]. ... 6 Fig. 1-8 Real world dynamic range with 10 orders of luminance magnitude. ... 7 Fig. 1-9 An LC-TV with a local dimming backlight can be regarded as the superposition of two
displays with different spatial resolutions: a low resolution backlight (left) and a high resolution LC panel (right). ... 8 Fig. 1-10 (a) Light leakage results in a low contrast image on a full-on backlight LCD, and (b) an
excessively dark backlight signal results in image detail lost on an HDR-LCD. ... 8 Fig. 1-11 (a) The field-sequential color (FSC) LCD mechanism: Displaying red, green, and blue
field-images at 180Hz field rate. (b) Color breakup (CBU) occurring while relative velocity exists between the screen object and the human eye. ... 9 Fig. 1-12 Two stages for minimizing power consumption and enhancing image quality. (a) A current
CCFL full-on BL LCD and (b) advanced LCD: color filter-less with dynamic RGB-LED BL LCD. ...10 Fig. 2-1 The algorithm for an LED-based HDR display [10]. ...14 Fig. 2-2 Schematic HDR Display image processing steps: (a) desired image, (b) LED-based
backlight signals, (c) LC compensated signals, and (d) final output image [9]. ...14 Fig. 2-3 A drawing of a cross section through the human eye with a schematic enlargement of the
retina including rod and cone light receptors [40]. ...16 Fig. 2-4 Distribution of rods and cones in the retina [42]. ...16 Fig. 2-5 Response sensitivity of three cone-types-- L-, M-, and S-cones [43]. ...17 Fig. 2-6 An example of saccadic movement while playing a shooting game with tracing directions
(white lines) and fixation points (yellow numbers). (Adopted from the on-line game of Counter Strike) ...18 Fig. 2-7 Experiments of the human eye velocity in tracing a moving object [24]. ...18
observed color breakup during or just after saccade [25]. ...20 Fig. 2-9 Mechanism of the dynamic CBU. (a) Human eyes synchronized with the moving image and
(b) the eye-trace integration on the retina. The extra color field will be observed at the bar edge. ...21 Fig. 2-10 Color matching experiment. (a) The observer sees a white screen divided into two halves,
one half illuminated by a test light, the other half illuminated by a mixture of one or more primary lights (here three are shown). (b) The observer can adjust the intensity of the primary light(s) to try to make the two halves of the screen match [44]. ...22 Fig. 2-11 Color matching functions from (a) human experiments and (b) transformation using
mathematics [45]. ...22 Fig. 3-1 The first stage of this dissertation. Using a dynamic LED-BL enhances image contrast and
lowers power consumption. ...25 Fig. 3-2 Schema of a dual-panel display with a low resolution backlight and a high resolution LC
panel. ...26 Fig. 3-3 The mapping functions of two conventional backlight determination methods, the Average
and Square-Root methods [9][10]. ...27 Fig. 3-4 The cumulative distribution function (CDF) and inverse of a mapping function (IMF) curves
of backlight signals for (a) high CR, (b) dark, (c) bright, and (d) medium gray-level images. ...29 Fig. 3-5 An example of using the IMF method. (a) High CR target image – Lily, (b) BL image of
Lily, and (c) the mapping curves of CDF and IMF. ...30 Fig. 3-6 An example of using the IMF method. (a) Low CR target image (bright image) – Yushan, (b)
BL image of Yushan, and (c) the mapping curves of CDF and IMF. ...30 Fig. 3-7 The processing of convolution. (a) BL signal, (b) light spread function, and (c) BL image. 31 Fig. 3-8 (a) Target image; Convolution results of backlight signal determined by the (b) Average, (c) Square-Root, and (d) IMF methods. ...31 Fig. 3-9 Target images with their CR measuring points; Lmax and Lmin are respectively marked with a
solid-blue circle and a dotted-pink circle. Areas within the red rectangles in Figs. (a) and (b) are magnified, shown in Figs. 3-10 and 3-11. ...32 Fig. 3-10 The results of the magnified section in the test image- Lily. (a), (b), and (c) are produced
using the Average, Square-Root, and IMF methods, respectively. (d) The target image. ...33 Fig. 3-11 The results of the magnified section in the test image- Robot. (a), (b), and (c) are produced using the Average, Square-Root, and IMF methods, respectively. (d) The target image. ...33 Fig. 3-12 Lateral pictures of a 37 inch HDR-LCD while using the (a) the full-on backlight, (b) IMF,
(c) Square-Root, and (d) Average methods. (The panel was provided by AU Optronics, Taiwan) ...35 Fig. 3-13 Image characteristics of different images using different methods. (a) Distortion ratio, (b)
contrast ratio, (c) maximum luminance, and (d) power consumption. ...36 Fig. 3-14 Comparisons of mapping curves using 256 and 4 registers in computing histogram. (a) Lily
Fig. 4-1 The second stage of this dissertation. Removing color filters lowers power consumption. ..38 Fig. 4-2 Prior color breakup suppression methods. (a) Double field rate, (b) mono-color field
insertion, and (c) Black-fields insertion. ...39 Fig. 4-3 Target image_ Peter Pan (©Disney) and field images using the conventional FSC-LCD and
Stencil-FSC method. ...40 Fig. 4-4 A “multi-color” image is yielded by a low resolution controllable RGB-LED backlight and a
high resolution color filter-less LC cell. ...41 Fig. 4-5 Stencil-FSC algorithm processing. (a) Input image_ Girl (b) local color-backlight dimming
technology, (c) backlight and LC images, and (d) 4 field-images produced. (Girl ©Microsoft, http://www.microsoft.com/surface/index.html) ...42 Fig. 4-6 Processing of local color-backlight dimming algorithm. ...42 Fig. 4-7 Simulated backlight intensity distribution of Lotus in various cutoff frequency:Do=0.015,
0.009, and 0.003 at 16×12 backlight division combination. ...44 Fig. 4-8 Insufficiently colorful first field-image (a) Test image_ Maple, (b) LC signal, and (c) the
first field-image. ...47 Fig. 4-9 Processing of colorized backlight image. (a) Original backlight signal, (b) applying the
dimming ratio (DR=10%), and (c) the final colorized backlight signal. ...47 Fig. 4-10 Four Stencil-FSC sub-frame images using the (a) original color backlight and (b) colorized backlight with DR=10%. ...47 Fig. 4-11 Four particular color test images. (a) Cyan-moon, (b) Maple, (c) Blossom, and (d) Lotus. 48 Fig. 4-12 Simulation results for the dimming ratio (DR) vs. (a) the relative CBUDR and (b) the
distortion ratio (D) in the four test images. ...48 Fig. 4-13 Simulation backlight division combinations with three corresponding backlight signals for
image_ Lotus. (p is the column number and q is the row number) ...50 Fig. 4-14 Point spread function (PSF) in frequency domain. Relation between the number of
backlight divisions and the cutoff frequency (D0)value when creating minimum ΣΔE00. ...51
Fig. 4-15 Point spread function (PSF) in spatial domain. Relation between the number of backlight divisions and S.D. (σx and σy) of a Gaussian PSF when creating minimum ΣΔE00. ...52
Fig. 4-16 The optimized Gaussian PSF with σx=54 pixels and σy=32 pixels in the 24×24 backlight
division combination. PSF views from (a) vertical, (b) lateral (y-direction), and (c) bottom (x-direction). ...52 Fig. 4-17 Simulation results of the number of backlight divisions vs relative CBURGB in the nine test
images. ...53 Fig. 4-18 Relative CBURGB in the nine test images while using 240Hz Stencil-FSC. ...54
Fig. 4-19 Implemented Stencil-FSC on a 32-inch FSC-LCD TV with 25 W power consumption. (a) Backlight photo and (b) Stencil-FSC LCD TV. (The panel was provided by CPT, Taiwan) ...54 Fig. 4-20 (a) Four field-image demo photos of Girl on a 32-inch FSC-LCD using the Stencil-FSC
Fig. 4-22 CBU experimental results for Girl using the (a) conventional FSC-LCD and (b) the Stencil-FSC method. ...56 Fig. 4-23 CBU experimental results for Lily using the (a) conventional FSC-LCD and (b) the
Stencil-FSC method. ...57 Fig. 5-1 (a) Target image_ Girl (Girl ©Microsoft) and each field-image using the conventional
(b)RGB-driving, (c) 240Hz Stencil-FSC, and (d) 180Hz Stencil-FSC methods ...60 Fig. 5-2 A “green-based multi-color” image is yielded by a low resolution RGB-LED backlight and
a high resolution color filter-less LC cell. ...62 Fig. 5-3 180Hz Stencil-FSC algorithm. (a) Input image, Girl (©Microsoft), (b) local color-backlight
dimming technology, (c) backlight and LC signals, and (d) 3 yielded field-images. ...62 Fig. 5-4 Redundant red or blue light propagates through the first green-based sub-frame resulting in
reduction of green color saturation (blue circle part). ...63 Fig. 5-5 Six more test images-- top: Lily, Girl, Blossom; bottom: Basketball, Soccer, and Color Ball.
...65 Fig. 5-6 (a) Simulated backlight intensity distribution in various Gaussian standard deviation:
σx=σy=16, 30, and 60 pixels. (b) Simulation backlight division combinations with three
corresponding backlight images for the test image_ Soccer. (p is the column number and q is the row number) (*: taken by Jacky Lee, http://jac3158.com/blog) ...65 Fig. 5-7 Optimized S.D. (σx and σy) of a Gaussian PSF for different number of backlight divisions. 67
Fig. 5-8 Simulation result of the number of backlight divisions vs relative CBURGB in the twelve test
images. ...67 Fig. 5-9 Simulation result of the number of backlight divisions vs. average ΔE00 in the twelve test
images. ...68 Fig. 5-10 The optimized Gaussian PSF with σx=40 pixels and σy=26 pixels in the 32×24 backlight
division combination. PSF views from (a) vertical, (b) lateral (y-direction), and (c) bottom (x-direction). ...68 Fig. 5-11 (a) Two test images of Color Ball and Girl. (b) Simulated images after 180Hz Stencil-FSC
processing. (c) CIEDE2000 error images between test and processed images with average ΔE00
of 1.3 and 1.4 respectively. ...69 Fig. 5-12 Comparison of the average relative CBURGB using conventional RGB-driving, double field
rate (360Hz-RGBRGB), black-fields insertion (360Hz-RGBKKK) [63], 240Hz Stencil-FSC, and 180Hz Stencil-FSC methods for the eighty test images (see appendix). ...70 Fig. 5-13 Experimental photos using conventional RGB-driving (red frame) and 180Hz Stencil-FSC methods (blue frame) of (a) Soccer, (b) Lily, and (c) Color Ball. ...72 Fig. 6-1 Whole schema of final dissertation results. ...75 Fig. 6-2 Comparison of optical throughputs between a conventional LCD (top) and a color filter-less LCD (FSC-LCD). ...76 Fig. 6-3 Redundant red or blue light propagates through in the first green-based field-image resulting
Butterfly and Lotus. (b) Simulated images after the 180Hz Stencil-FSC processing. (c) CIEDE2000 error images between test and processed images with PDRs of 46% and 40% respectively. ...78 Fig. 6-4 The improved algorithm of the 180Hz Stencil-FSC method. (a) Test image-Lotus, (b)
backlight and LC images, and (c) three field-images yielded. ...80 Fig. 6-5 The improved 180Hz algorithm avoids the redundant lights propagating through the first
field-image and maintains image fidelity. (a) Two test images of Butterfly and Lotus. (b) Simulated images after the improved 180Hz Stencil-FSC processing. (c) CIEDE2000 error images between test and processed images with PDRs of 3.6% and 2.5% respectively. ...80 Fig. 6-6 Target image_ Girl (©Microsoft), and each field-image using the 240Hz Stencil-FSC,
180Hz Stencil-FSC, and upgraded 120Hz Stencil-FSC methods [71]. ...81 Fig. 6-7 Further power reduction through using RGBW 4-in-1 LED in the backlight system. ...82
T
ABLE
L
IST
Table 1-1 The objectives of this dissertation. ... 11 Table 2-1 Two common types of eye movements for color breakup discussion. ...19 Table 3-1 The distortion ratio (D), luminance (Lmax and Lmin), contrast ratio (CR), and power
consumption (P) of Lily, Robot, Shore, and Yushan using the conventional method (full-on) and three different backlight determination methods. ...35 Table 4-1 Nine test images with different levels of color and detail complexity. ...49 Table 4-2 Comparison of three 32-inch LCDs of IPS-CCFL, conventional FSC, and Stencil-FSC
method displaying two test images_ Girl and Lily. ...57 Table 5-1 Comparisons between the conventional RGB-driving, 360HZ-RGBKKK [63], 240Hz
Stencil-FSC [33]-[35], and 180Hz Stencil-FSC [36][37]. ...71 Table 6-1 Dissertation comparisons between objectives and results on a 32-inch LCD. ...77
Chapter 1
I
NTRODUCTION
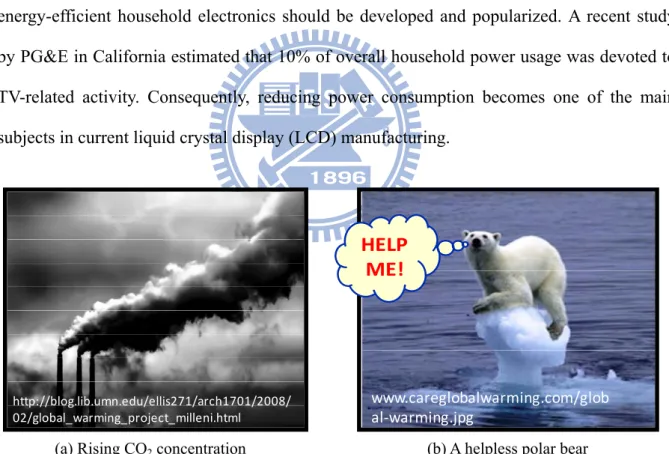
Concerns about saving energy and protecting the environment are gradually increasing. After the documentary, “An Inconvenient Truth,” featuring Al Gore in 2006, the global warming issue receives wide attention [1]. The greenhouse effect makes the Earth warmer. Polar bears almost have no place to live on the Earth (Fig. 1-1). Climate change is now widely recognized as a major environmental problem. When facing the climate change, energy-efficient household electronics should be developed and popularized. A recent study by PG&E in California estimated that 10% of overall household power usage was devoted to TV-related activity. Consequently, reducing power consumption becomes one of the main subjects in current liquid crystal display (LCD) manufacturing.
(a) Rising CO2 concentration (b) A helpless polar bear
Fig. 1-1 Cause and effect of global warming. (a) Cause: rising carbon dioxide concentration and (b) a consequence: a helpless polar bear.
The history of LCDs can be traced to the year 1964. G. Heilmeier was the first person to turn a clear liquid milky by applying electricity at Radio Corporation of America (RCA).
www.careglobalwarming.com/glob al‐warming.jpg http://blog.lib.umn.edu/ellis271/arch1701/2008/ 02/global_warming_project_milleni.html
HELP
ME!
Heilmeier also had the foresight to imagine that a wall-sized full-color LC display was achievable. T. Peter Brody fabricated the first active matrix LCD in 1972, which was initially limited to small display applications, like calculators, watches, etc. In 1988, Sharp demonstrated the first active matrix full-color and full-motion LCD panel. Until 1991, M. Aramoto of Sharp’s Audio-Video Group introduced the first wall-hanging- television product, the “Liquid Crystal Museum.” Heilmeier’s dream had become a reality [2][3].
Fig. 1-2 The first wall-hanging televisions fabricated by Sharp Cooperation [2].
In the past decades, thin film transistor liquid crystal displays (TFT-LCDs) have become the most wide-spread display technology for applications ranging from small mobile devices, car navigation systems, laptops, and monitors to large-sized TV applications and projectors, etc. The high number of LCD applications can be attributed to several features, such as high resolution, high brightness, light weight, and a thin profile.
1.1 Thin Film Transistor Liquid Crystal Displays (TFT-LCDs)
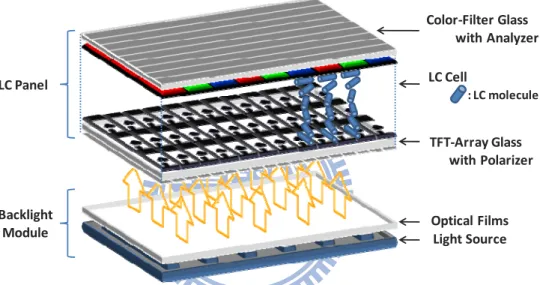
A traditional TFT-LCD is composed of two main structures: a backlight module and an LC panel, as shown in Fig. 1-3. As liquid crystals (LCs) are not emissive, TFT-LCDs must rely on additional light sources (e.g. CCFLs or LEDs) which are generally behind the LC cell and are called “backlight.” The LC panel is basically a sandwich structure with LC molecules
filled between two glass substrates: a TFT-array glass and a color-filter glass. The TFT-array glass consists of a polarizer and TFTs. The number of TFTs is three times more than the number of pixels. The LC controls the light transmission using different molecular orientations that vary in accordance with the applied voltage. The color-filter glass is composed of a polarizer (analyzer) and a color-filter layer. In the color filter, each pixel segment is made up of three primary-color (red, green, and blue) sub-pixels approximate 150 micro-meters in size for a 37-inch LCD.
Fig. 1-3 Traditional LCD structure: a backlight module and an LC panel.
The TFT-LCD is generally illuminated using a constant full-on backlight which consists of conventional cold cathode fluorescence lamps (CCFLs). The backlight polarization state changes to the linear state after propagating through a polarizer on the TFT-array glass. Different voltages between these two glasses control LC orientations and create different phase retardations due to the LC birefringence property. When the linear polarized lights propagate through the LC cell, the polarization states are modulated by differing LC orientations. Consequently, lights from different sub-pixels continue to propagate into red, green, and blue color filters in different intensities and become colorized. After passing
LC Panel TFT‐Array Glass with Polarizer LC Cell Light Source Optical Films Color‐Filter Glass with Analyzer Backlight Module : LC molecule
1.2 Issues of Current TFT-LCDs
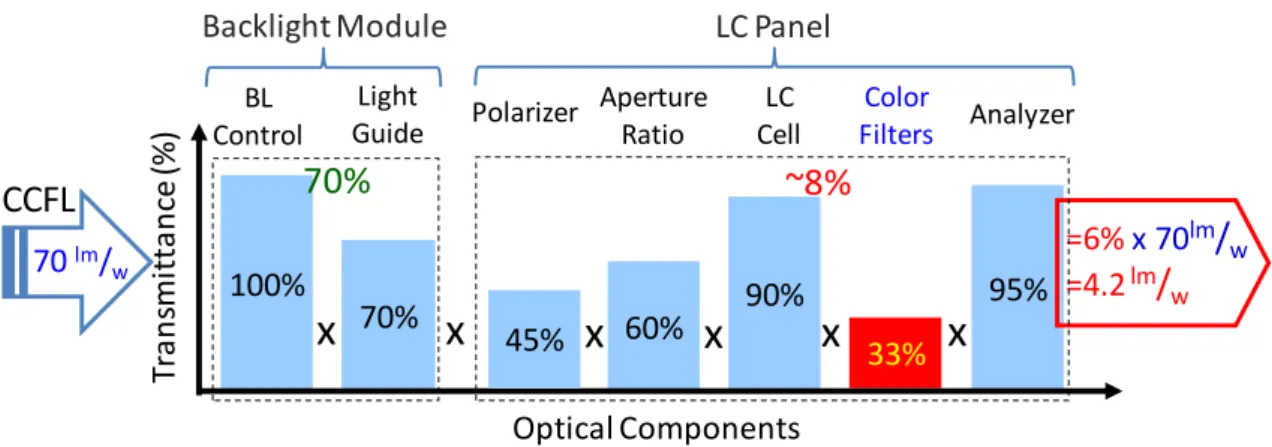
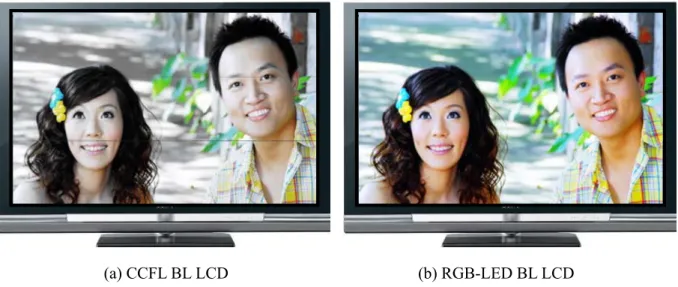
Although LCDs have many advantages, some issues still must be improved. The notorious issues are low optical throughput, imperfect "dark" state, low color saturation, and others. A traditional LCD backlight system is generally illuminated by a full-on CCFL backlight. The generated light propagates through an optical stack comprised of a set of polarizers, color filters, and diffusers. Substantial proportions of light are scattered and absorbed by these components. Overall, approximately only 5~8% of backlight reaches the front-of-screen image, more than 90% of backlight is consumed (Fig. 1-4). Second, an imperfect dark state is due to light leakage from LCs and a pair of non-ideal crossed polarizers; the poor image contrast ratio of conventional LCDs results in fuzzy images. An additional issue is that CCFL spectrum widely covers all visible wavelengths (e.g. 400~700nm) and the transmittance spectra of color filters are not pure peaks at red, green, and blue (Fig. 1-5(a)). Therefore, the primary colors perceived by human eyes in a conventional LCD are often made up of several different frequencies resulting in color gamut shrinkage. Fig. 1-5(b) illustrates that the color gamut of RGB-LED backlight is much larger than that of CCFL backlight [4]. Images produced on LCDs with backlights employing CCFLs and RGB-LEDs are compared in Fig. 1-6 in which the RGB-LED backlight LCD shows a more vivid color image.
These issues are attributed to the full-on CCFL backlight and color filters which absorb more than 70% backlight intensity. Consequently, LCD manufacturing utilizes the light emitting diode (LED) which is high power efficiency and near point light source to replace conventional CCFL backlight. In addition, the inefficient color filters are removed to enhance the poor optical throughput and save 19% of the material cost in a typical 32-inch LCD panel, as illustrated in Fig. 1-7 [5].
Fig. 1-4 Low optical throughput in a CCFL-backlight LCD attributed to the low optical transmittance efficiency of optical components.
(a) Spectra of light sources and color filters (b) Color gamut with different BLs
Fig. 1-5 (a) Typical color filter transmittance spectra with illuminant spectra of a CCFL backlight (top) and a RGB-LED backlight (bottom). (b) LCD color gamut with backlights employing the RGB LEDs, CCFLs and white LEDs [4].
=6% x 70lm/ w =4.2lm/ w 100% 70% 60% 90% 33% 95%
x
x
x
x
x
CCFL 45%x
BL Control Light Guide Polarizer LC Cell Aperture Ratio Color Filters Analyzer 70% ~8% Tr a n sm itta n ce (% ) Optical Components 70 lm/ w LC Panel Backlight Module Wavelength (nm) No rm al iz ed In te ns it y No rm al iz ed Int en si ty CCFL‐BL LCD RGBLEDs‐ BL LCD x y(a) CCFL BL LCD (b) RGB-LED BL LCD
Fig. 1-6 Differing image color saturation and contrast ratio abilities in (a) CCFL backlight and (b) RGB-LED backlight LCDs.
Fig. 1-7 A typical materials cost structure of a 32-inch LCD panel (Q4’ 2008)[5].
1.3 LED-based LCD Technologies
Light emitting diodes (LEDs) are praised for several advantages, such as being mercury-free, having small form factor, a long lifetime, high power efficiency, wide color gamut, and fast switching operation [6]. Therefore, LEDs are being applied to the LCD backlight system and not only save power but also enable the panel lighter and thinner [7]. The advanced technologies of scanning backlight driving [8], high dynamic range [9]-[15],
Backlight 23% Color Filter 19% Polarizer 10% Target: 2% Chemicals 4% LC: 6% Others 2% Driver IC 5% Inverter 5% PCB, etc: 14% Glass: 10% Ref: DisplaySearch http://www.displaysearch.com.tw/
and field-sequential color [16]-[21] are swiftly developed resulting from this new option for backlight systems.
1.3.1 High Dynamic Range Display Systems
Scenes in the real-world contain a dynamic range over 10 orders of luminance magnitude from starlight to sunlight (Fig. 1-8). The human visual system perceives over 5 orders in real time and evolves to all ranges through long-time adaptation [22]. However, in spite of recent advances in cell technology, the dynamic range of current state-of-the-art LCDs is typically limited to only three orders of magnitude; especially the dark region of the picture is not truly dark because of light leakage. Therefore, using LED light sources as a backlight instead of CCFLs, the backlight panel is locally dimmed and greatly increases the dynamic range of such a display while simultaneously substantially reducing power consumption. This type of display is also called the “high dynamic range (HDR) display.”
Fig. 1-8 Real world dynamic range with 10 orders of luminance magnitude.
Local dimming backlights effectively combined a low-resolution display (the backlight) with a high-resolution one (the LC panel), as shown in Fig. 1-9. These backlights generated only the amount of light required to correctly represent the video content while dimming under dark areas. Therefore, a high dynamic range/high contrast image was achieved using an HDR display. However, many image details were lost while applying an excessively dark backlight determination method even though LC signals were compensated [23], as illustrated in Fig. 1-10. 10‐1 10‐2 1 10 102 103 104 105 106 10‐3 Star Quarter moon Full moon Twilight Family living room LCD overcast day Full daylight Direct sunlight Luminance (lux) Sunny day
Fig. 1-9 An LC-TV with a local dimming backlight can be regarded as the superposition of two displays with different spatial resolutions: a low resolution backlight (left) and a high resolution LC panel (right).
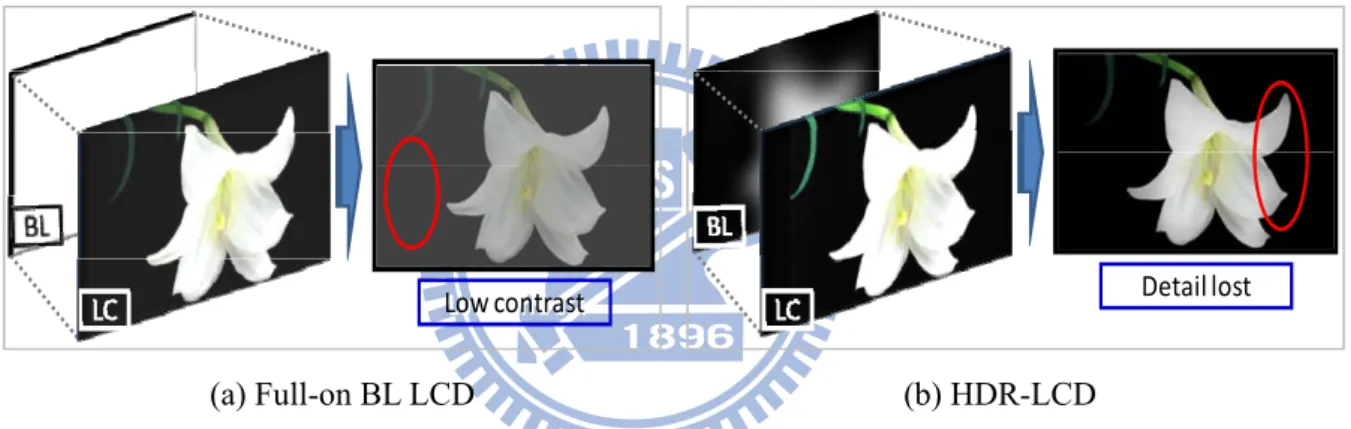
(a) Full-on BL LCD (b) HDR-LCD
Fig. 1-10 (a) Light leakage results in a low contrast image on a full-on backlight LCD, and (b) an excessively dark backlight signal results in image detail lost on an HDR-LCD.
1.3.2 Field-Sequential Color LCDs
A high optical throughput field-sequential color (FSC) LCD without color filters was proposed to further reduce power consumption [16]-[21]. By rapidly displaying red (R), green (G), and blue (B) field-images sequentially, a full-color image was created by temporal color synthesis, as illustrated in Fig. 1-11(a). To prevent luminance flicker, the three-primary colors system required a minimum refresh rate of 180Hz. Consequently, fast-response LEDs were applied to LCD backlight systems to replace conventional CCFLs. After removing color filters, FSC-LCDs possessed many benefits, such as high optical
LC panel (High resolution) LED Backlight
(Low resolution)
throughput, wide color gamut, low material cost, three times the possible screen resolution, and other features compared to LCDs with color filters.
However, FSC-LCDs still face an inherent visual artifact, color breakup (CBU), which occurs when relative velocities exist between the screen object and the human eye. This may occur during both smooth motion pursuit (eye velocity is slower than 90 degree/sec) and particularly saccadic movement (eye velocity is faster than 90 degree/sec) [24]-[30]. During eye movements, the separated R, G, and B sub-pixels of an image degrade image quality and cause viewer discomfort, as shown in Fig. 1-11(b). Once the CBU issue is overcome, a low power consumption and high image quality LCD becomes feasible.
(a) FSC-LCD mechanism (b) Color breakup
Fig. 1-11 (a) The field-sequential color (FSC) LCD mechanism: Displaying red, green, and blue field-images at 180Hz field rate. (b) Color breakup (CBU) occurring while relative velocity exists between the screen object and the human eye.
1.4 Motivations and Objectives
In creating a sustainable world, energy conservation and altering of our "consuming" live style is worthy to be practiced. This is a great incentive to reduce the power dissipation of state-of-the-art LCDs. In addition, as people always admire beautiful scenes; higher image
Time Sequentially
Red Green Blue
5.56 ms
1 frame (60 Hz): 16.7 ms Data
Load SetLC FlashLED LoadData SetLC FlashLED LoadData SetLC FlashLED
Relative velocity
qualities (e.g. image resolution, contrast ratio, color saturation) are required. Hence, LCD manufacturing is working hard on enhancing image quality and lowering power consumption. An LED-based backlight LCD opens up an alternative way for creating a low power “Eco-Display.” Particularly, the HDR- and FSC-related LCDs have an essential role to play in display manufacturing. To make them more feasible, some topics, such as HDR-LCD backlight determinations and FSC-LCD color breakup have to be developed and resolved. To effectively improve image quality and reduce power consumption, we study these topics in two stages, 1st stage: replacing a CCFL full-on backlight by a dynamic RGB-LED backlight; 2nd stage: removing color filters for the LC panel. Finally, these two stages are convolved together to reach a high image quality eco-LCD.
(a) Current CCFL BL LCD (b) Advanced LCD
Fig. 1-12 Two stages for minimizing power consumption and enhancing image quality. (a) A current CCFL full-on BL LCD and (b) advanced LCD: color filter-less with dynamic RGB-LED BL LCD.
In the first stage, we propose an efficient method, “Inverse of a Mapping Function (IMF),” to optimize backlight signals [31][32]. The IMF method provides a dynamic gamma function for the backlight panel to not only maintain a high contrast ratio but also maintain maximum luminance and clear image detail. Additionally, power consumption and image distortion are also reduced. The detailed IMF method is described in Chapter 3.
LC Panel
Backlight Module
CCFL Æ
RGB‐LED
Full‐on CCFL Dynamic RGB‐LED
Color
filter‐less
Stage 1 Stage 2
In the second stage, local color-backlight dimming technology is ingeniously applied on an FSC-LCD to overcome the CBU issue and name “Stencil Field-Sequential-Color” (Stencil-FSC). The Stencil-FSC field rate is controlled at less than 240Hz (4 field-images), including the 240Hz (4-field) [33]-[35] and 180Hz (3-field) Stencil-FSC methods [36][37]. Stencil-FSC methods are consequently implemented on an FSC-LCD using a commercial OCB-mode [38][39] because of their low field rates. Using local color-backlight dimming technology, a high luminance multi-color image is generated on a color filter-less LCD. Therefore, the intensities of the residual primary-color images are greatly reduced and effectively suppress CBU. Utilizing a “multi-color” field in a single field-image to suppress CBU is an originality and much different from previous CBU suppression methods. The detailed Stencil-FSC methods are expressed in Chapters 4 and 5.
According to current specifications of 32-inch CCFL and RGB-LED backlight LCDs, the objectives of this dissertation are as follows: using a dynamic RGB-LED backlight system to enhance the image contrast ratio more than 20,000:1, save 50% power consumption, and increase the color gamut to more than 110% NTSC. Finally, using a 180Hz driving algorithm to render CBU imperceptible and maintain image fidelity (Table 1-1).
Table 1-1 The objectives of this dissertation.
Current 32‐inch LCD This Dissertation CCFL BL RGB‐LED BL ~1,500 : 1 ~1,500:1 StaticContrast Ratio > 20,000:1 110 (100%) 190 (172%) Power Consumption (W) < 55 (50%) 72 >105 Color Gamut (% NTSC) > 110
ColorBreakup (CBU) Imperceptible
Field Rate (Hz) 180 Image fidelity D<5% or ΔE00<3 % 100 × ≡ pixels total of # pixels distorted of # D
1.5 Organization of this Dissertation
This dissertation is organized as follows: the fundamental HDR algorithm and basic color science principles are in Chapter 2. In this Chapter, the human eye movements and CBU mechanism are also presented. In Chapter 3, a dynamic backlight gamma curve, inverse of a mapping function (IMF) embedded into an HDR-LCD is proposed to enhance image contrast while simultaneously reduce power consumption. Following, HDR technology was applied on FSC-LCDs to suppress CBU. The 240Hz Stencil-FSC and 180Hz Stencil-FSC methods are consequently proposed in Chapters 4 and 5. In these two chapters, the algorithm, optimization of hardware parameters, simulations and experimental results are presented. Finally, Chapter 6 concludes the dissertation; current issues and future work are also discussed.
Chapter 2
P
RINCIPLES
The fundamental algorithm of a high dynamic range (HDR) system is first discussed in this chapter, including determining backlight signals and compensating LC signals. Following, the physiological structure of the human eye and types of eye movements are presented to help develop a proper method to suppress the color breakup (CBU) issue. The CBU mechanisms caused by different eye movements are also discussed. In addition, the color difference of CIEDE2000 was utilized to evaluate the differences between simulated images and original images while using the proposed algorithm. Therefore, the definition of CIEDE2000 is presented.
2.1 Fundamentals of High Dynamic Range Displays
The dynamic range of real-world environments exceeds the capabilities of existing display technology by several orders of magnitude. To present a high dynamic range on an LCD, an LED-based backlight is utilized because of its point-like light source and individual control.
The HDR algorithm is expressed in Fig. 2-1 [10]. Each input image(1) is recalculated for the LED-based backlight(3) and LC panel(6). The first step in this algorithm is to down-sample
the input image resolution to the resolution of LED array. After that, taking the square root(2) of the reduced resolution image(2a) as the backlight signals, the LC signals are then
compensated for the variation in the LED-based backlight. To correctly compensate the LC signal, the next step is to calculate the backlight intensity distribution(4) (p
1*IL) generated by
the LED-based backlight through summing up the contributions of each LED for this input image. It is important that the point spread function (p1) used in this process accurately
reflects the effective light distribution of each LED, including any interaction with the optics and films used in the package. Moreover, the compensated LC signal can be generated through dividing the input image by the simulation of backlight intensity distribution(5), as shown in Eq. 2-1. Finally, the HDR-LCD shows a completed image.
ribution nsity dist light inte s the back represent I p ls d LC signa compensate and al ent origin I' repres I, where I p I I L 1 L ⊗ ⊗ = 1 ' (2-1)
The LED is driven to the appropriate intensity, and the LED backlight creates a luminance distribution which is similar to backlight intensity distribution simulation. Then, the LC panel modulates this luminance distribution so that the final output image matches the input image, as illustrated in Fig. 2-2 [9].
Fig. 2-1 The algorithm for an LED-based HDR display [10].
(a) Input image (b) LED signals (c) Compensated LC (d) Final image
Fig. 2-2 Schematic HDR Display image processing steps: (a) desired image, (b) LED-based backlight signals, (c) LC compensated signals, and (d) final output image [9].
2.2 Structure of the Human Eye
The human eye is an adaptive lens. Fig. 2-3 shows the cross section of the human eye [40]. When light goes into the pupil of the eye and continues through the lens which acts the same as a camera focusing light onto the retina. The retina contains two types of photoreceptors, rods and cones, named for their shapes. The rods are more numerous, roughly 125 million, and are more sensitive than the cones to detect small amounts of light, such as starlight. However, they are unable to distinguish color. 6 to 7 million cones perform in bright light, giving detailed colored views, but they fail at low light levels [41]. Cones are much more concentrated in the central yellow spot known as the “macula.” In the center of macula is the “fovea centralis,” a 0.2 mm diameter rod-free area with very thin, densely packed cones. In addition, the fovea is the area of the eye responsible for sharpest vision.
The distribution of rods and cones in the retina is not uniform, as illustrated in Fig. 2-4 [42]. The density of cones falls rapidly to a constant level at about 10 to 15 degrees from the fovea. At about 15 to 20 degrees from the fovea, the density of the rods reaches a maximum. Because there is only one pigment type for rods, humans only see objects as shades of gray. In contrast, there are 3 types of cones which refer to as the short-wavelength (S-cone), middle-wavelength (M-cones) and long-wavelength (L-cones) sensitive cones (Fig. 2-5) [43]. This is why humans perceive vivid colors. While receiving light, the retina converts it into nerve signals, and then the nerve signals are sent through the optic nerve, at the back of the eye, to the brain. Hence, in the optical nerve region, there is no any receptor to sense light stimuli and is so-called “blind spot.”
Fig. 2-3 A drawing of a cross section through the human eye with a schematic enlargement of the retina including rod and cone light receptors [40].
Fig. 2-4 Distribution of rods and cones in the retina [42].
Rods Cones Fovea (Blind spot) Rods Rods Fovea Blind Spot Cones Cones 180 160 140 120 100 80 60 40 20 Nu m b er of Ro d s or Co n e s pe r mm 2 (x 1000) 70 60 50 40 30 20 10 0 10 20 30 40 50 60 70 80 90 Perimetric Angles (degree)
Fig. 2-5 Response sensitivity of three cone-types-- L-, M-, and S-cones [43].
2.3 Types of Eye Movements
Since only the fovea, which is around 10 degrees distribution of the retina (Fig. 2-4), is employed for distinct vision, the human eye perceives scenery by voluntarily or spontaneously moving. Most primates use two types of voluntary eye movement and fixation to track interesting objects: saccade and smooth pursuit.
2.3.1 Saccade and Fixation
Saccade is a rapid, random eye movement while perceiving static objects. The eye moves around the objects and locates interesting parts (fixation) to gather visual information. Saccade to an unexpected stimulus normally takes about 200 ms to initiate and lasts from about 20 to 200 ms, depending on amplitude. Fig. 2-6 is an example of saccadic movement. When a police wants to shoot terrorists in a shooting game, he has to move his eyes rapidly (saccade), gaze at objects (fixation) and then distinguish the terrorists from following officers. Generally, saccade is spontaneous when examining new targets, reaching a peak angular speed of 1000 degree/sec.
0.00 0.10 0.20 0.30 0.40 0.50 0.60 0.70 0.80 0.90 1.00 380 430 480 530 580 630 680 730 780 Rela ti ve Se n si vi ty Wavelength (nm) L‐bar M‐bar S‐bar
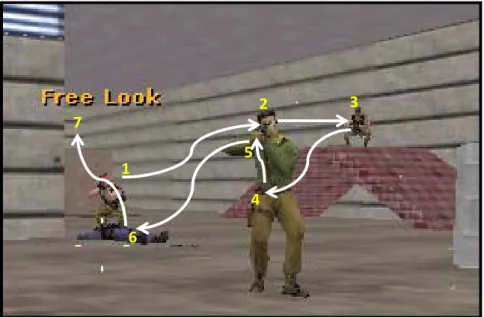
Fig. 2-6 An example of saccadic movement while playing a shooting game with tracing directions (white lines) and fixation points (yellow numbers). (Adopted from the on-line game of Counter Strike)
Fig. 2-7 Experiments of the human eye velocity in tracing a moving object [24].
2.3.2 Smooth Pursuit
Smooth pursuit is a predictable movement while following moving objects. When following a moving object, the human eye will trace at the same velocity as the object focusing on the fovea and catching clear images. Compared to saccade, pursuit velocity is
1 2 3 4 5 6 7 0 40 80 120 160 200 Ey e ve lo ci ty (d eg re e/ se c) 120 80 40 Target velocity (degree/sec) Smooth pursuit Saccade
much slower, and research has proposed the velocity is about 90 degree/sec. If a target moves at a velocity faster than 90 degree/sec, the eye cannot pursue it, as shown in Fig. 2-7 [24].
Table 2-1 Two common types of eye movements for color breakup discussion.
Eye movement is a natural response for human beings when perceiving the whole scenery (Table 2-1). Nevertheless, unconscious eye movement results in color breakup on FSC-related displays and prevents FSC-related applications.
2.4 Color Breakup Mechanisms
The color breakup (CBU) phenomenon is perceived while the eye is moving. Therefore, CBU is strongly dependent on two main types of eye movements: saccade and smooth pursuit. Consequently, the CBU phenomenon is categorized into static CBU and dynamic CBU according to images and eye movements.
2.4.1 Static Color Breakup
Static CBU phenomenon happens when observing static images. While humans watch a static image, eyes will move around the image to gather details. During or after saccade, static CBU is perceived. The mechanism of static CBU is illustrated in Fig. 2-8 [25][26]. Fig. 2-8(a) shows three static white bars with a black background showing on an
Types of Eye
Movements
Stimulus
Effect
Speed
Smooth
Pursuit
Slowly moving objects Track slowly moving objects Slow, usually only up to 90 degree/secSaccade
Either peripherally detected motion or decision to change fixation Examine new objects, visual search Very fast, up to 1000 degree/secsaccadic movement, like the white line in Fig. 2-8(a). In a conventional FSC-LCD using a RGB color sequence, the display shows red, green, and blue fields sequentially. When eyes move in saccade, the field images of different colors are projected onto the retina separately, and CBU is perceived, as illustrated in Fig. 2-8(b). The effective factors of static CBU are saccade velocity, image difference between objects and background, and display filed rate.
(a) (b)
Fig. 2-8 Mechanism of the static CBU. (a) White bars on an FSC display and a saccade path and (b) observed color breakup during or just after saccade [25].
2.4.2 Dynamic Color Breakup
The other type of CBU, dynamic CBU, happens while perceiving dynamic images [27]. In order to focus on the fovea, human eyes will pursue the moving object at the same velocity (Fig. 2-9). When a white bar is moving from left to right on an FSC-LCD using a RGB color sequence, the observer perceives it through pursuit movement. Fig. 2-9(b) shows the spatial-temporal relation. The horizontal axis is the position of the FSC-LCD, the vertical axis is time, and the eye trace direction is indicated by oblique black lines. After eye integration, the three primary-colors are projected onto the retina separately and causes the colorful band appeared on the edge of the white bar. From the observing mechanisms of these two types of CBU, static CBU is more serious and troublesome than dynamic CBU because of faster eye velocity.
(a) (b)
Fig. 2-9 Mechanism of the dynamic CBU. (a) Human eyes synchronized with the moving image and (b) the eye-trace integration on the retina. The extra color field will be observed at the bar edge.
2.5 Color Spaces and Color Differences
2.5.1 Color Matching Functions and Three Tristimulus
Color matching experiments was conducted in 1931 to describe the color that the human eye perceives, as illustrated in Fig. 2-10. Based on this study, a set of color matching functions (CMFs): r(λ), g(λ), and b(λ) was derived as shown in Fig. 2-11(a)
[44]. To avoid the negative values appearing on the CMFs, the CMFs were transformed to
) (λ
x , y(λ), and z(λ) using mathematics Fig. 2-11(b)). This is the well-know CIEXYZ
color space established by the Commission Internationale de l’Éclairage (CIE) in 1931. Consequently, the color perceived can be quantified by the CIE as three tristimulus: X, Y, and Z. The color (X, Y, Z) is affected by three components: illuminant (P), a object’s reflectance factor (R), and the CMFs of the human eye, (x(λ), y(λ), and z(λ)), and is given
in Eq. 2-2. λ λ λ λ λ λ λ λ λ λ λ λ d z R P Z d y R P Y d x R P X ) ( ) ( ) ( ) ( ) ( ) ( ) ( ) ( ) (
∫
∫
∫
= = = (2-2) Position on the monitor Time Retina(a) Experimental setup (b) Patterns on the screen
Fig. 2-10 Color matching experiment. (a) The observer sees a white screen divided into two halves, one half illuminated by a test light, the other half illuminated by a mixture of one or more primary lights (here three are shown). (b) The observer can adjust the intensity of the primary light(s) to try to make the two halves of the screen match [44].
(a) (b)
Fig. 2-11 Color matching functions from (a) human experiments and (b) transformation using mathematics [45]. Primary lights Test light Surrounding field Observer Test light Surrounding field Primary lights White screen
2.5.2 CIELAB Color Space and Color Difference of ∆E*ab
However, the CIEXYZ causes arguments since it is not uniform enough to describe the color difference, especially for green and blue colors [46][47]. Therefore, the CIE recommended two color-difference formulas for industrial applications, the CIELAB and CIELUV in 1976. The non-linear transformations from CIEXYZ to CIELAB are described in Eqs. 2-3~2-7. In these equations, Xn, Yn, and Zn are the tristimulus values of the reference
white. L* represents lightness, a* approximate redness-greenness, and b* approximate yellowness-blueness. A more uniform color difference formula of ∆E*ab is consequently
given in Eq. 2-8. The CIELAB provided a uniform chromaticity diagram so that most of color-difference formulas were established based on the CIELAB color space, including CIE94 [47] and CIEDE2000 [48]-[50].
0.008856 ) / ( 3 . 903 0.008856 16 ) / ( 116 * 3 / 1 * ≤ = > − = n n n n for Y/Y Y Y L for Y/Y Y Y L (2-3) )] f(Y/Y ) [f(X/X a*= 500 n − n (2-4) )] f(Z/Z ) [f(Y/Y b* = 200 n − n (2-5) 2 2 * (a*) (b*) Cab = + (2-6) *) / * ( tan 1 * b a Hab = − (2-7) ed. ilar defin ) are sim Z/Z ) and f( f(X/X /Y for Y ) (Y/Y ) Y f(Y/ for Y/Y ) (Y/Y ) Y f(Y/ where n n n n n n n n 0.008856 116 16 7.787 0.008856 1/3 ≤ + = > = 2 * 2 * 2 * * ( L) ( a ) ( b ) Eab = Δ + Δ + Δ Δ (2-8)
2.5.3 Color Difference of CIEDE2000
In the past three decades, color scientists have found that the 1976 CIELAB is more uniform than the CIEXYZ color space. However, the CIELAB is unable to describe large color differences precisely, particular in the blue color region. Therefore, the CIE modified the formula to describe all color-difference ranges and proposed the CIEDE2000. In 2001, the CIEDE2000 formula was published and is expressed in Eq. 2-9 [48][49]. The methodology used for developing the formula from experimental color difference data was described by Luo, Cui, and Rigg [50]. The formula provides an improved procedure for the computation of industrial color differences. In Eq. 2-9, the parameters SL, SC, and SH are the
weighting functions for lightness, chroma, and hue differences, respectively (Eq. 2-10). kL,
kC, and kH values are the parametric factors adjusted according to different viewing
parameters, for the lightness, chroma, and hue components, individually. RT function is
intended to improve the performance of the color-difference equation for describing chromatic differences in the blue region. The color difference of CIEDE2000 considers more color conditions. Therefore, this dissertation utilizes CIEDE2000 to evaluate the color difference between original images and simulated images which are processed by the proposed methods. ⎟⎟ ⎠ ⎞ ⎜⎜ ⎝ ⎛ Δ ⎟⎟ ⎠ ⎞ ⎜⎜ ⎝ ⎛ Δ + ⎟⎟ ⎠ ⎞ ⎜⎜ ⎝ ⎛ Δ + ⎟⎟ ⎠ ⎞ ⎜⎜ ⎝ ⎛ Δ + ⎟⎟ ⎠ ⎞ ⎜⎜ ⎝ ⎛ Δ = Δ H H ab C C ab T H H ab C C ab L L 00 S K H S K C R S K H S K C S K L E * * 2 * 2 * 2 * (2-9) * ab H * ab C L , S C , and S C S =1 =1+0.045 =1+0.015 (2-10) unction Rotation f : R e ma, and hu ance, chro s of lumin g function : Weightin , S , S S a, and hue nce, chrom of lumina ic factors : Parametr , K , K K hue roma, and minance,ch nces of lu : Differe H , C , L where T H C L H C L ab ab * Δ * Δ * Δ
Chapter 3
D
YNAMIC
B
ACKLIGHT
G
AMMA ON
H
IGH
D
YNAMIC
R
ANGE
LCD
S
A high dynamic range liquid crystal display (HDR-LCD) enhanced the image contrast ratio and lowered power consumption by utilizing local backlight dimming technology. This dissertation studied an HDR-LCD as a dual-panel display composed of a backlight module and a liquid crystal (LC) cell. In the first stage of backlight panel optimization, as an optimized gamma of LC signals to enhance the final image, the backlight module was similarly given with a dynamic gamma function to control the contrast ratio of an HDR image (Fig. 3-1). The inverse of a mapping function (IMF) method, proposed as a dynamic gamma mapping curve for the backlight module, has been demonstrated to further improve HDR image quality. By implementing the IMF method on a 37-inch HDR-LCD with 8×8 backlight divisions, the image contrast ratio was enhanced by ~20,000:1 while maintaining high brightness, clear image detail, and an average power reduction of 30% compared to a 37-inch LED LCD without using local backlight dimming technology.
Fig. 3-1 The first stage of this dissertation. Using a dynamic LED-BL enhances image contrast and lowers power consumption.
CCFL Æ LED Stage 1
3.1 Dual-Panel Display for HDR Images
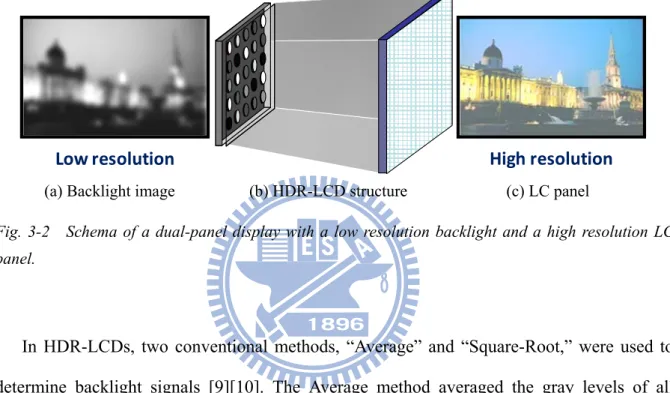
To enhance HDR-LCD image quality, a dual-panel LCD was created from a backlight module and an LC panel (Fig. 3-2). The backlight module was a low resolution panel to control the image contrast ratio. The second panel, the LC cell, was a high resolution panel to maintain image details according to the backlight intensity distribution.
(a) Backlight image (b) HDR-LCD structure (c) LC panel
Fig. 3-2 Schema of a dual-panel display with a low resolution backlight and a high resolution LC panel.
In HDR-LCDs, two conventional methods, “Average” and “Square-Root,” were used to determine backlight signals [9][10]. The Average method averaged the gray levels of all sub-pixel values in each backlight division. The mapping function of original and modified backlight levels is an oblique line with a slope of one (Fig. 3-3). On the other hand, the Square-Root method calculated the average value in each backlight division first, and then took its square root after normalizing the average value. Thus, the Square-Root method enhanced the backlight signal and maintained final image brightness.
For practical applications, the number of backlight divisions in the HDR-LCD was reduced to lower IC driver usage and simplify hardware computation complexity. However, due to the decrease of backlight resolution, many image details were lost through applying the Average method because of low backlight brightness. Using the Square-Root method, image
details were much clearer than that of the Average method, but the contrast ratio (CR) decreased substantially because of “over-enhancement” in darker backlight zones. Additionally, both of these methods used fixed backlight mapping curves (Fig. 3-3) that might be not suitable for diverse types of images, such as high and low CR images.
Consequently, we proposed an efficient method, the inverse of a mapping function (IMF), to control backlight signals. The IMF method was decided by inverting the mapping function of each image; in other words, the IMF method provided the backlight signal with a dynamic gamma to optimize the backlight “image.” Thus IMF maintained not only a high contrast ratio but also maximum luminance and clear image detail. Additionally, power consumption and image distortion were also reduced.
Fig. 3-3 The mapping functions of two conventional backlight determination methods, the Average and Square-Root methods [9][10].
0 50 100 150 200 250 0 50 100 150 200 250 BL va lue af te r proce ss ing (G ra y Le ve l) BL value before processing (Gray Level) Square‐Root method Average method
3.1.1 Backlight Determination-- Inverse of a Mapping Function Method
Several mapping methods have been proposed to successfully enhance image performance [51]-[55]. In this dissertation, histogram equalization [51] was utilized as the mapping function. The basic procedure of the IMF method was first to compute the global histogram of a target image to get a probability density function (PDF). Then the PDF from the lowest to the highest gray level was accumulated to obtain the mapping function (also called the cumulative distribution function, CDF) of the traditional histogram equalization. Finally, inverting the CDF of a target image with the oblique line y=x generated a new curve for backlight modulation called the “Inverse of a Mapping Function (IMF) [31][32].”
Before IMF processing, a zone-value of each backlight division was first decided. To optimize the image quality and power consumption, a weighting, n (0≤ n ≤ 1), was taken for the average (Avg) and maximum (Max) values in each backlight division. The zone-value is given in Eq. 3-1. In this work, n=0.9 was the optimized weighting for the IMF method. . ) 1 ( . n Avg Max n Value Zone− = × + − × (3-1)
A significant feature of the IMF method was the optimization of backlight signals based on each input image, i.e. backlight signals with a dynamic gamma were controlled frame by frame to produce high quality images in high and low CR images. For example, in a high CR image (Fig. 3-4(a)), the CDF curve has steep slopes in high and low gray-level areas; in contrast, the IMF curve has gentle slopes in these two areas. Therefore, backlight signals for dark regions distributed to the lower IMF area, and backlight signals for bright regions distributed to the higher IMF area. Hence, the backlight panel showed a high CR image using the IMF method. Additionally, IMF also maintained the brightness of the target image showing less distortion image details. Fig. 3-5 shows a high CR target image_ Lily, and its backlight image obtained using the IMF method.
Excluding high CR images, Figs. 3-4(b)-(d) show the CDF and IMF curves of low CR images, i.e. dark, bright, and medium gray-level images. Most backlight signals were distributed to a particular area with uniform values, thus eliminating the visible boundaries of each LED backlight block. For example, most backlight signals of the bright image,
Yushan (Fig. 3-6), distributed to the higher IMF area (with gray levels between 220 and
250). Likewise, dark and medium gray-level images were also modulated with a uniform brightness distribution. So the LC signals were easily compensated and produced a high-quality image.
(a) High CR image (b) Dark image (c) Bright image (d) Medium GL image
Fig. 3-4 The cumulative distribution function (CDF) and inverse of a mapping function (IMF) curves of backlight signals for (a) high CR, (b) dark, (c) bright, and (d) medium gray-level images.
![Fig. 1-2 The first wall-hanging televisions fabricated by Sharp Cooperation [2].](https://thumb-ap.123doks.com/thumbv2/9libinfo/8473646.183642/18.892.188.742.381.717/fig-wall-hanging-televisions-fabricated-sharp-cooperation.webp)
![Fig. 2-11 Color matching functions from (a) human experiments and (b) transformation using mathematics [45]](https://thumb-ap.123doks.com/thumbv2/9libinfo/8473646.183642/38.892.142.796.507.966/color-matching-functions-human-experiments-transformation-using-mathematics.webp)
![Fig. 3-3 The mapping functions of two conventional backlight determination methods, the Average and Square-Root methods [9][10]](https://thumb-ap.123doks.com/thumbv2/9libinfo/8473646.183642/43.892.227.691.523.996/mapping-functions-conventional-backlight-determination-methods-average-square.webp)
