國 立 交 通 大 學
機 械 工 程 學 系
碩士論文
空氣噴流衝擊至一大直徑加熱圓盤之渦流結構與熱傳
特性研究
Vortex Flow and Thermal Characteristics Resulting
from a Confined Round Jet of Air Impinging onto a
Large Heated Horizontal Disk
研 究 生 : 王壹龍
指 導 老 師: 林 清 發 博 士
空氣噴流衝擊至一大直徑加熱圓盤之渦流結構與熱傳
特性研究
Vortex Flow and Thermal Characteristics Resulting from a
Confined Round Jet of Air Impinging onto a Large Heated
Horizontal Disk
研 究 生:王 壹 龍 Student:Yi-Lung Wang
指導教授:林 清 發 Advisor:Tsing-Fa Lin
國立交通大學
機械工程學系
碩士論文
A Thesis
Submitted to Institute of Mechanical Engineering
Collage of Engineering
National Chiao Tung University
In Partial Fulfillment of the Requirements
For the degree of
Master of Science
In
Mechanical Engineering
June 2008
Hsinchu, Taiwan, Republic of China
誌 謝
時光飛逝,回首在新竹這兩年來的點點滴滴,在時光洪流裡,亦不得不臣服 的我,心中難掩不捨,百感交集地欲言又止。在交大這充滿學術氣息的環境下似 乎讓我在知識上成長茁壯許多。本論文之所以可以順利完成,首先要感謝的是指 導老師 林清發教授嚴謹及殷切的指導,使學生能培養出獨立思考、釐清並自行 解決問題的能力;更在學生撰寫論文時,不辭辛勞逐字斧正文稿,在此獻上最高 謝意。在研究所期間的一步一腳印,要特別感謝謝汎鈞學長在實驗設備設計、架 設上的協助指導,亦要感謝博士班陳尚緯、張文瑞、陳建安等博士班學長在生活 及課業上指導與建議,使我受益匪淺,謝謝您們。 永龍、浚圩、長志這群不只是求學中的同學,更是生活上的好朋友。研究所 之所以能在緊湊忙碌又充滿歡樂中的氣氛中度過,即是靠這些同學兼好友的夥伴 們相互協助幫忙,令我永生難忘。另外也要感謝 書磊、譯徵、文慶等一群努力 的學弟幫忙及合作,希望你們能繼續保持實驗室優良傳統,並帶著實驗室進步。 最後更要感謝父母及家人對於我無怨無悔付出及支持,使我可以無後顧之憂 的專注於研究,並且可無憂無慮過求學生活。並特別要感謝女友思宇的陪伴與體 恤,生活最精采的部分是妳陪我渡過,不管在課業上或生活上的關心與支持使我 有勇氣面對一切的困難挑戰。也要感謝 兔子、阿一等大學的同學還可以在研究 所一起打球陪我度過這些日子。 最後,僅以本文獻給我所關心的人和所有關心我的人。 壹龍 謹致 2008/6 于風城交大Vortex Flow and Thermal Characteristics Resulting from a Confined Round Jet of Air Impinging onto a Large Heated Horizontal Disk
Student: Yi-Lung Wang Advisor: Prof. Tsing-Fa Lin Department of Mechanical Engineering
National Chiao Tung University
ABSTRACT
An experiment is carried out in the present study to investigate the vortex flow patterns resulting from a round air jet impinging over a large confined heated horizontal circular disk of 16 inch in diameter. In the present experiment the jet flow rate is varied from 0.4 to 10.0 (standard liter per minute) for the jet Reynolds number ranging from 27 to 676 with the injection pipe diameter Dj = 20.0 mm and jet-disk
separation distance H = 12.5mm and 25.0 mm. The temperature difference between the disk and the air injected at the inlet of the jet is varied from 0 to 14.0℃ for the Rayleigh number Ra ranging from 0 to 7,340.
The results from the flow visualization for H=25.0 mm indicate that the vortex flow is characterized by the primary and/or secondary inertia-driven circular rolls along with several buoyancy-driven rolls. The number and strength of the buoyancy induced rolls increase with the buoyancy-to-inertia ratio, which can vary from 1 to 5. Besides, at a low Gr/Rej2 slightly deformed circular buoyancy rolls prevail in the test
section. For slightly higher Gr/Rej2 the flow is dominated by the highly deformed
Gr/Rej2 . For all cases examined here the vortex flow is unsteady at long time after the
initial transients have died out and is irregular to a certain degree since the buoyancy effect is rather strong for the large impinging plate tested here. In addition to the roll deformation, the mutual pushing, merging and splitting of the buoyancy rolls occur nonperiodically in time. This unsteady and irregular vortex flow is also reflected in the data for the air temperature variations with time. Some quantitative buoyancy-driven vortex flow characteristics such as the size and location of the buoyancy rolls are summarized and correlated empirically. Moreover, a flow regime map is provided to delineate various induced vortex flow patterns and the boundaries separating various vortex flow patterns are also correlated empirically.
When the jet-disk separation distance is reduced to 12.5 mm for ΔT varied from 8.0℃ to 14.0℃ ( corresponding to the Rayleigh number ranging from 1,470 to 2,670 ), circular waves traveling in the radial direction and radial vortex rolls appear in the confined impinging jet flow. These waves are somewhat deformed and are not axisymmetric. The radial rolls originate in the stagnation region of the impinging jet and grow in size in the radial direction. The size of the radial rolls is also nonuniform in the circumferential direction. Besides, the moving waves and radial rolls can coexist in the flow. Moreover, the ranges of the jet Reynolds number and Rayleigh numbers leading to the new vortex flow patterns are determined. Flow regime maps delineating various vortex flow patterns including all inertia- and buoyancy-driven roll and wave patterns found here are given. And the boundaries among various vortex flow patterns are empirically correlated.
TABLE OF CONTENTS
ABSTRACT i
TABLE OF CONTENTS
iii
LIST OF TABLES
v
LIST OF FIGURES
vi
NOMENCLATURE xiii
CHAPTER 1 INTRODUCTION
1.1 Motivation 1.2 Literature Review1.3 Objective and Scope of Present Study
1
1
1
4
CHAPTER 2 EXPERIMENTAL APPARATUS AND
PROCEDURES
2.1 Experimental Apparatus 2.2 Experimental Procedures8
8
11
CHAPTER 3 DIMENSIONLESS GROUPS AND
UNCERTAINTY ANALYSIS
3.1 Dimensionless Groups 3.2 Uncertainty Analysis16
16
16
CHAPTER 4 RESULTS AND DISCUSSION
4.1 Vortex Flow Patterns
4.1.1 Effects of Jet Reynolds Number 4.1.2 Effects of Rayleigh Number
4.1.3 Vortex Flow Evolution
4.1.4 Quantitative Characteristics of Buoyancy-Driven Rolls
4.1.5 Thermal Characteristics 4.1.6 Flow Regime Map
4.2 The New Flow Patterns at Certain Buoyancy-to-Inertia Ratio
20
21
23
24
24
25
26
27
28
CHAPTER 5 CONCLUDING REMARKS
126
LIST OF TABLES
Table 3.1 Summary of uncertainty analysis. --- 19 Table 4.1 The characteristic of buoyancy-driven rolls---31
LIST OF FIGURES
Fig. 1.1 Flow structure associated with a circular jet impinging onto a flat plate
for unconfined impinging jet.---6 Fig. 1.2 Flow structure associated with a circular jet impinging onto a flat plate
for confined impinging jet without side wall. --- 7 Fig. 2.1 Schematic diagram of the experimental system.--- 13 Fig. 2.2 Schematic of the test section from side view showing the design of the
bottom heated disk --- 14 Fig. 2.3 The heated consists of three parts : resistance heating element, holder and
insulator --- 15 Fig. 2.4 The location of thermocouple--- 16 Fig. 4.1 Steady side view flow photos taken at the cross plane θ=0∘& 180∘for
various jet Reynolds numbers at Ra=0 (△T=0°C) for Dj= 20.0 mm and
H=25.0mm --- 32 Fig. 4.1 continued--- 33 Fig. 4.2 Side view flow photos taken at the cross plane θ=0∘& 180∘for various
jet Reynolds numbers at Ra=2940 (△T=2°C) for Dj= 20.0 mm and
H=25.0mm. --- 34 Fig. 4.3 Side view flow photos taken at the cross plane θ=0∘& 180∘for various
jet Reynolds numbers at Ra=4400 (△T=3°C) for Dj= 20.0 mm and
H=25.0mm. --- 35 Fig. 4.4 Side view flow photos taken at the cross plane θ=0∘& 180∘for various
jet Reynolds numbers at Ra=5870 (△T=4°C) for Dj= 20.0 mm and
H=25.0mm. --- 36 Fig. 4.5 Side view flow photos taken at the cross plane θ=0∘& 180∘for various
jet Reynolds numbers at Ra=7340 (△T=5°C) for Dj= 20.0 mm and
H=25.0mm. --- 37 Fig. 4.6 Top view flow photos taken at midheight of the chamber with Ra=2940
(ΔT=2) & Dj=20.0 mm at H=25 mm for Rej= (a)101, (b) 135, (c) 203, (d)
270, (e) 338, (f)406. --- 38 Fig.4.7 Top view flow photos taken at midheight of the chamber with Ra=4400
(ΔT=3 )℃ & Dj=20.0 mm at H=25 mm for Rej= (a)101, (b) 135, (c) 203,
(d) 270, (e) 338, (f)406. --- 39 Fig.4.8 Top view flow photos taken at midheight of the chamber with Ra=5870
(ΔT=4 )℃ & Dj=20.0 mm at H=25 mm for Rej= (a)101, (b) 135, (c) 203,
(d) 270, (e) 338, (f)406. --- 40 Fig.4.9 Top view flow photos taken at midheight of the chamber with Ra=7340
(ΔT=5 )℃ & Dj=20.0 mm at H=25 mm for Rej= (a)101, (b) 135, (c) 203,
(d) 270, (e) 338, (f)406. --- 41
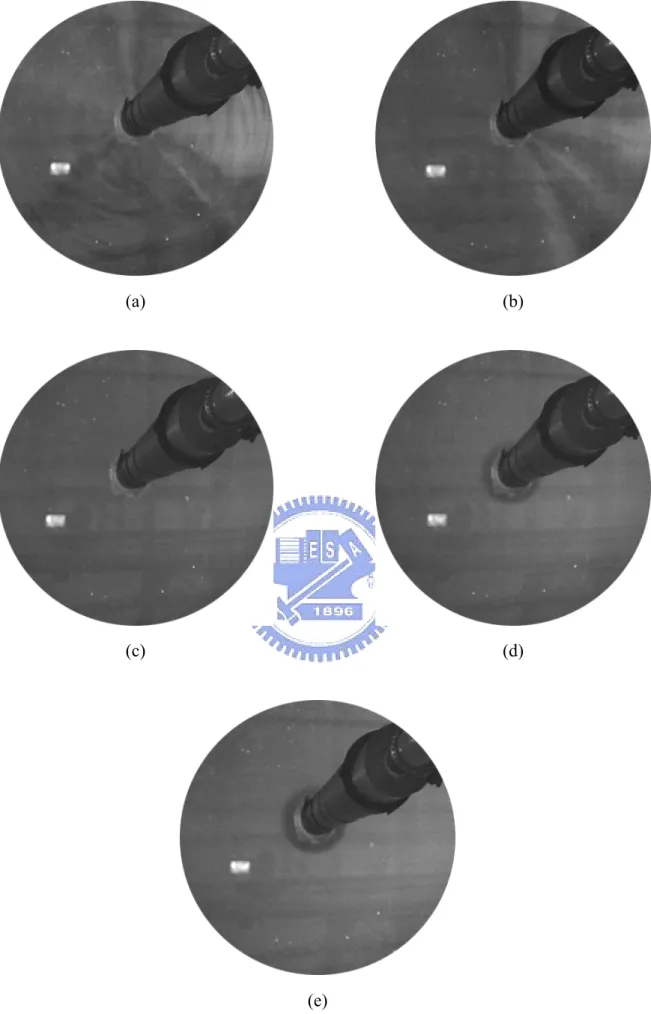
Fig.4.10 Side view flow photos taken at the cross plane θ=0∘& 180∘for various different temperature between jet and disk at jet Reynolds numbers Rej =101( Qj = 1.5 slpm ) for Dj= 20.0 mm and H=25.0mm. --- 42
Fig.4.11 Side view flow photos taken at the cross plane θ=0∘& 180∘for various different temperature between jet and disk at jet Reynolds numbers Rej =135( Qj = 2 slpm ) for Dj= 20.0 mm and H=25.0mm. --- 43
Fig.4.12 Side view flow photos taken at the cross plane θ=0∘& 180∘for various different temperature between jet and disk at jet Reynolds numbers Rej =203 ( Qj = 3 slpm ) for Dj= 20.0 mm and H=25.0mm. --- 44
Fig.4.13 Side view flow photos taken at the cross plane θ=0∘& 180∘for various different temperature between jet and disk at jet Reynolds numbers Rej =270 ( Qj = 4 slpm ) for Dj= 20.0 mm and H=25.0mm. --- 45
Fig.4.14 Side view flow photos taken at the cross plane θ=0∘& 180∘for various different temperature between jet and disk at jet Reynolds numbers Rej =338 ( Qj = 5 slpm ) for Dj= 20.0 mm and H=25.0mm. --- 46
Fig.4.15 Side view flow photos taken at the cross plane θ=0∘& 180∘for various different temperature between jet and disk at jet Reynolds numbers Rej =406 ( Qj = 6 slpm ) for Dj= 20.0 mm and H=25.0mm. --- 47
Fig.4.16 Vortex flow evolution for H=25.0mm at Rej=101 (Qj=1.5 slpm) and Ra=2940 (△T=2°C) illustrated by side view flow photos taken at the cross plane θ=0∘& 180∘ --- 48
Fig.4.16 Continued--- 49
Fig.4.16 Continued--- 50
Fig.4.16 Continued--- 51
Fig.4.17 Vortex flow evolution for H=25.0mm at Rej=101 (Qj=1.5 slpm) and Ra=4400 (△T=3°C) illustrated by side view flow photos taken at the cross plane θ=0∘& 180∘ --- 52
Fig.4.17 Continued --- 53
Fig.4.17 Continued --- 54
Fig.4.17 Continued --- 55
Fig.4.17 Continued --- 56
Fig.4.17 Continued --- 57
Fig.4.18 Vortex flow evolution for H=25.0mm at Rej=101 (Qj=1.5 slpm) and Ra=5870 (△T=4°C) illustrated by side view flow photos taken at the cross plane θ=0∘& 180∘ --- 58
Fig.4.18 Continued--- 60 Fig.4.18 Continued--- 61 Fig.4.18 Continued--- 62 Fig.4.18 Continued--- 63 Fig.4.18 Continued--- 64 Fig.4.18 Continued--- 65 Fig.4.18 Continued--- 66
Fig.4.19 Vortex flow evolution for H=25.0mm at Rej=101 (Qj=1.5 slpm) and Ra=7340 (△T=5°C) illustrated by side view flow photos taken at the cross plane θ=0∘& 180∘ --- 67
Fig.4.19 Continued --- 68
Fig.4.19 Continued--- 69
Fig.4.20 The time records of non-dimensional air temperature for Ra=2940 (ΔT=2 )℃ & Dj=20.0 mm at H=25 mm measured at selected locations on the vertical plane θ = 0˚ at Z = 0.5 and R = r/Rc = 0.95 for various Rej= (a)101, (b) 135, (c) 203, (d) 270, (e) 338, (f)406 --- 70
Fig.4.21 The time records of non-dimensional air temperature for Ra=4400 (ΔT=3 )℃ & Dj=20.0 mm at H=25 mm measured at selected locations on the vertical plane θ = 0˚ at Z = 0.5 and R = r/Rc = 0.95 for various Rej= (a)101, (b) 135, (c) 203, (d) 270, (e) 338, (f)406 --- 71
Fig.4.22 The time records of non-dimensional air temperature for Ra=5870 (ΔT=4 )℃ & Dj=20.0 mm at H=25 mm measured at selected locations on the vertical plane θ = 0˚ at Z = 0.5 and R = r/Rc = 0.95 for various Rej= (a)101, (b) 135, (c) 203, (d) 270, (e) 338, (f)406 --- 72
Fig.4.23 The time records of non-dimensional air temperature for Ra=7300 (ΔT=5 )℃ & Dj=20.0 mm at H=25 mm measured at selected locations on the vertical plane θ = 0˚ at Z = 0.5 and R = r/Rc = 0.95 for various Rej= (a)101, (b) 135, (c) 203, (d) 270, (e) 338, (f)406 --- 73
Fig.4.24 The time records of non-dimensional air temperature for Ra=2940 (ΔT=2 )℃ & Dj=20.0 mm at H=25 mm measured at selected locations on the vertical plane θ = 0˚ at Z = 0.5 and R = r/Rc = 0.75 for various Rej= (a)101, (b) 135, (c) 203, (d) 270, (e) 338, (f)406 --- 74
Fig.4.25 The time records of non-dimensional air temperature for Ra=4400 (ΔT=3 )℃ & Dj=20.0 mm at H=25 mm measured at selected locations on the vertical plane θ = 0˚ at Z = 0.5 and R = r/Rc = 0.75 for various Rej= (a)101, (b) 135, (c) 203, (d) 270, (e) 338, (f)406 --- 75 Fig.4.26 The time records of non-dimensional air temperature for Ra=5870
the vertical plane θ = 0˚ at Z = 0.5 and R = r/Rc = 0.75 for various Rej=
(a)101, (b) 135, (c) 203, (d) 270, (e) 338, (f)406 --- 76
Fig.4.27 The time records of non-dimensional air temperature for Ra=7340 (ΔT=5 )℃ & Dj=20.0 mm at H=25 mm measured at selected locations on the vertical plane θ = 0˚ at Z = 0.5 and R = r/Rc = 0.75 for various Rej= (a)101, (b) 135, (c) 203, (d) 270, (e) 338, (f)406 --- 77
Fig.4.28 Flow regime map delineating the irregular and regular buoyancy-driven rolls for H = 25 mm--- 78
Fig.4.29 Top view flow photos taken at midheight of the chamber with Ra=1470(ΔT=8 )℃ & Dj=20.0 mm at H=12.5 mm for Rej= (a)101, (b) 135, (c) 203, (d) 270, (e) 338, (f)406, (g) 473, (h)541, (i) 609,(j)676--- 79
Fig.4.29 continued --- 80
Fig.4.30 Top view flow photos taken at midheight of the chamber with Ra=1470 (ΔT=8 )℃ & Dj=20.0 mm at H=12.5 mm for Rej= (a)27, (b) 34, (c) 41, (d) 47, (e) 54, (f) 61, (g) 68, (h) 74, (i) 81, (j) 88, (k) 95, (l) 101, (m) 108, (n) 115, (o) 122, (p) 128,(q) 135, (r) 142, (s) 149. --- 81
Fig.4.30 continued --- 82
Fig.4.30 continued --- 83
Fig.4.30 continued --- 84
Fig.4.31 Top view flow photos taken at midheight of the chamber with Ra=1650(ΔT=9 )℃ & Dj=20.0 mm at H=12.5 mm for Rej= (a)101, (b) 135, (c) 203, (d) 270, (e) 338, (f) 406, (g) 473, (h) 541, (i) 609,(j) 676.--- 85
Fig.4.31 continued --- 86
Fig.4.32 Top view flow photos taken at midheight of the chamber with Ra=1650 (ΔT=9 )℃ & Dj=20.0 mm at H=12.5 mm for Rej= (a)27, (b) 34, (c) 41, (d) 47, (e) 54, (f) 61, (g) 68, (h) 74, (i) 81, (j) 88, (k) 95, (l) 101, (m) 108, (n) 115, (o) 122, (p) 128,(q) 135, (r) 142. --- 87
Fig.4.32 continued --- 88
Fig.4.32 continued --- 89
Fig.4.33 Top view flow photos taken at midheight of the chamber with Ra=1830(ΔT=10 )℃ & Dj=20.0 mm at H=12.5 mm for Rej= (a)101, (b) 135, (c) 203, (d) 270, (e) 338, (f) 406, (g) 473, (h) 541, (i) 609,(j) 676.--- 90
Fig.4.33 continued --- 91
Fig4.34 Top view flow photos taken at midheight of the chamber with Ra=1830 (ΔT=10 )℃ & Dj=20.0 mm at H=12.5 mm for Rej= (a)27, (b) 34, (c) 41, (d) 47, (e) 54, (f) 61, (g) 68, (h) 74, (i) 81, (j) 88, (k) 95, (l) 101, (m) 108, (n) 115, (o) 122, (p) 128,(q) 135, (r) 142, (s) 149. --- 92
Fig.4.34 continued --- 94
Fig.4.35 Top view flow photos taken at midheight of the chamber with Ra=2020(ΔT=11 )℃ & Dj=20.0 mm at H=12.5 mm for Rej= (a)101, (b) 135, (c) 203, (d) 270, (e) 338, (f) 406, (g) 473, (h) 541, (i) 609,(j)676.--- 95
Fig.4.35 continued --- 96
Fig.4.36 Top view flow photos taken at midheight of the chamber with Ra=2020 (ΔT=11 )℃ & Dj=20.0 mm at H=12.5 mm for Rej=(a)27, (b) 34, (c) 41, (d) 47, (e) 54, (f) 61, (g) 68, (h) 74, (i) 81, (j) 88, (k) 95, (l) 101, (m) 108, (n) 115, (o) 122, (p) 128,(q) 135, (r) 142, (s) 149. --- 97
Fig.4.36 continued --- 98
Fig.4.36 continued --- 99
Fig.4.36 continued --- 100
Fig.4.37 Top view flow photos taken at midheight of the chamber with Ra=2200(ΔT=12 )℃ & Dj=20.0 mm at H=12.5 mm for Rej= (a)101, (b) 135, (c) 203, (d) 270, (e) 338, (f) 406, (g) 473, (h) 541, (i) 609,(j). --- 101
Fig.4.37 continued --- 102
Fig.4.38 Top view flow photos taken at midheight of the chamber with Ra=2200 (ΔT=12 )℃ & Dj=20.0 mm at H=12.5 mm for Rej= (a)27, (b) 34, (c) 41, (d) 47, (e) 54, (f) 61, (g) 68, (h) 74, (i) 81, (j) 88, (k) 95, (l) 101, (m) 108, (n) 115, (o) 122, (p) 128,(q) 135, (r) 142, (s) 149. --- 103
Fig.4.38 continued --- 104
Fig.4.38 continued --- 105
Fig.4.38 continued --- 106
Fig.4.39 Top view flow photos taken at midheight of the chamber with Ra=2390(ΔT=13 )℃ & Dj=20.0 mm at H=12.5 mm for Rej= (a)101, (b) 135, (c) 203, (d) 270, (e) 338, (f) 406, (g) 473, (h) 541, (i) 609,(j) 676. --- 107
Fig.4.39 continued --- 108
Fig.4.40 Top view flow photos taken at midheight of the chamber with Ra=2390 (ΔT=13 )℃ & Dj=20.0 mm at H=12.5 mm for Rej= (a) 27, (b) 34, (c) 41, (d) 47, (e) 54, (f) 61, (g) 68, (h) 74, (i) 81, (j) 88, (k) 95, (l) 101, (m) 108, (n) 115, (o) 122,(p) 128, (q) 135, (r) 142. --- 109
Fig.4.40 continued --- 110
Fig.4.40 continued --- 111
Fig.4.41 Top view flow photos taken at midheight of the chamber with Ra=2570(ΔT=14℃) & Dj=20.0 mm at H=12.5 mm for Rej= (a)101, (b) 135, (c) 203, (d) 270, (e) 338, (f) 406, (g) 473, (h) 541, (i) 609,(j) 676.--- 112
Fig.4.41 continued --- 113 Fig.4.42 Top view flow photos taken at midheight of the chamber with Ra=2670
(ΔT=14 )℃ & Dj=20.0 mm at H=12.5 mm for Rej= (a) 27, (b) 34, (c) 41, (d)
47, (e) 54, (f) 61, (g) 68, (h) 74, (i) 81, (j) 88, (k) 95, (l) 101, (m) 108, (n)
115, (o) 122,(p) 128, (q) 135, (r) 142. --- 114 Fig.4.42 continued --- 115 Fig.4.42 continued --- 116 Fig.4.43 The time records of non-dimensional air temperature for Ra=1,470
(ΔT=8 )℃ & H=12.5 mm measured at selected locations on the vertical plane θ = 0˚ at Z = 0.5 and R = r/Rc = 0.9 for Rej= (a) 34, (b) 47, (c) 68, (d)
81, (e) 101, (f) 115, (g) 135, (h) 149. --- 117 Fig.4.44 The time records of non-dimensional air temperature for Ra=1,650
(ΔT=9 )℃ & H=12.5 mm measured at selected locations on the vertical plane θ = 0˚ at Z = 0.5 and R = r/Rc = 0.9 for Rej= (a) 34, (b) 47, (c) 68, (d)
81, (e) 101, (f) 115, (g) 135, (h) 149. --- 118 Fig.4.45 The time records of non-dimensional air temperature for Ra=1,840
(ΔT=10 )℃ & H=12.5 mm measured at selected locations on the vertical plane θ = 0˚ at Z = 0.5 and R = r/Rc = 0.9 for Rej= (a) 34, (b) 47, (c) 68, (d)
81, (e) 101, (f) 115, (g) 135,and (h) 149.--- 119 Fig.4.46 The time records of non-dimensional air temperature for Ra=2,020
(ΔT=11 )℃ & H=12.5 mm measured at selected locations on the vertical plane θ = 0˚ at Z = 0.5 and R = r/Rc = 0.9 for Rej= (a) 34, (b) 47, (c) 68, (d)
81, (e) 101, (f) 115, (g) 135, (h) 149. --- 120 Fig.4.47 The time records of non-dimensional air temperature for Ra=2,200
(ΔT=12 )℃ & H=12.5 mm measured at selected locations on the vertical plane θ = 0˚ at Z = 0.5 and R = r/Rc = 0.9 for Rej= (a) 34, (b) 47, (c) 68, (d)
81, (e) 101, (f) 115, (g) 135, (h) 149. --- 121 Fig.4.48 The time records of non-dimensional air temperature for Ra=2,390
(ΔT=13 )℃ & H=12.5 mm measured at selected locations on the vertical plane θ = 0˚ at Z = 0.5 and R = r/Rc = 0.9 for Rej= (a) 34, (b) 47, (c) 68, (d)
81, (e) 101, (f) 115, (g) 135, (h) 149. --- 122 Fig.4.49 The time records of non-dimensional air temperature for Ra=2,570
(ΔT=14 )℃ & H=12.5 mm measured at selected locations on the vertical plane θ = 0˚ at Z = 0.5 and R = r/Rc = 0.9 for Rej= (a) 34, (b) 47, (c) 68, (d)
81, (e) 101, (f) 115, (g) 135, (h) 149. --- 123 Fig.4.50 Flow regime map delineating primary inertia-driven roll, buoyancy-driven
rolls, transversal waves, and radial rolls for H = 12.5 mm.--- 124 Fig.4.51 Flow regime map delineating primary inertia-driven roll, secondary
inertia-driven roll, buoyancy-driven rolls, transversal waves, and radial
NONMENCLATURE
Dj Diameter of jet at the injection pipe exit (mm)Dw Diameter of disk (mm)
Gr Grashof number, gβΔTH3 ν2
g Gravitational acceleration (m/s2) H Jet-to-disk separation distance (mm)
HDj Ratio of the jet-disk separation distance to the jet diameter, H/ Dj
Qj Jet flow rate (Standard Liter per Minute, slpm)
ZBR The location of the buoyancy-driven roll near the center of jet
NBR The number of the buoyancy-driven rolls
SBR2 The size of the second buoyancy-driven roll
SBR3 The size of the third buoyancy-driven roll
SBR4 The size of the fourth buoyancy-driven roll
SBR5 The size of the fifth buoyancy-driven roll
z , ,
rθ Dimensional coordinates in cylindrical coordinate system Z
, ,
R Θ Dimensionless coordinates r R/ c, /360 , /θ ° z H
Ra Rayleigh number, gβΔTH αν 3
Rej Jet Reynolds number,
j j
V D ν Ta Ambient Temperature ( )℃
Tf Temperature of the heated disk ( )℃
Tj Temperature of jet at the injection pipe exit ( )℃
t Time (sec)
j
V Average velocity of the air jet at the injection pipe exit (m/s)
Greek symbols
β Thermal expansion coefficient (1/K)
ΔT Temperature difference between the heated disk and the air injected into the chamber (℃)
ν Kinematic viscosity (m2/s) Φ Non-dimensional temperature,
(
) (
)
j f j / T T T T− − ρ Density (kg/m3) μ Dynamic viscosity (kg/ms) k Thermal conductivity (W/m℃
)Chapter 1
INTRODUCTION
1.1 Motivation of the study
It has been known for some time that the complex vortex flow and thermal characteristics driven by the buoyancy and inertia in a laminar gas jet impinging vertically downwards onto a heated horizontal disk confined a cylindrical chamber are relevant to the growth of crystal thin films from the metal-organic chemical vapor deposition (MOCVD) processes. In order to reduce the fabrication cost, we need to increase the wafer size and the gas flow over the large wafer will be affected by the buoyancy to a stronger degree. Thus the detailed understanding of the buoyancy driven flow and heat transfer in MOCVD processes is necessary in various microelectronic applications. It is also well known that the confined impinging jet flow depends on the jet Reynolds number, buoyancy-to-inertia ratio and nondimensional jet-disk separation distance. In the air jet impinging onto a large heated disk considered here the possible appearance of other vortex flow patterns, aside from the circular rolls, such as the radial rolls, bifurcation rolls, incomplete rolls, cells, etc needs to be investigated. This is still poorly understood. Specifically under what conditions these new vortex rolls appear needs to be explored. In the present study, we investigate the possible presence of new vortex flow structures and the associated flow and thermal characteristics in an impinging jet over a large confined heated circular plate. Effects of the jet Reynolds number, Rayleigh number and nondimensional jet-disk separation distance on the predicted flow and thermal structures will be examined in detail.
1.2 literature review
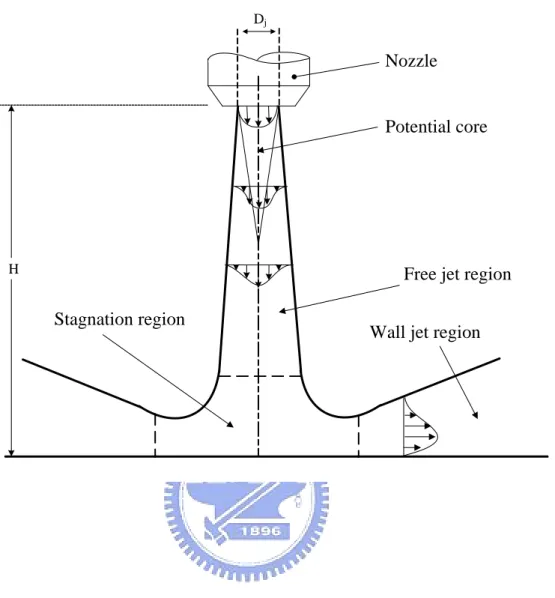
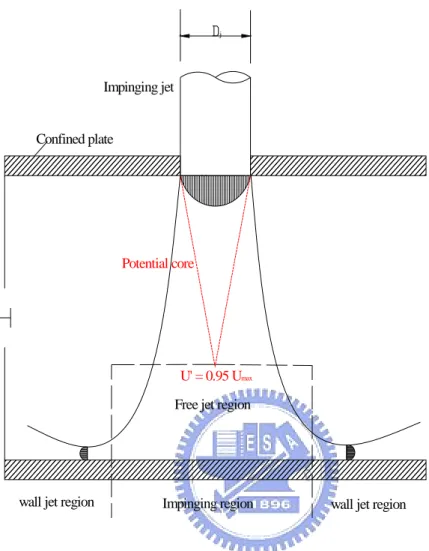
In a jet impingement flow over a large horizontal plate, we can identify three characteristic regions for an unconfined impinging jet and for a confined impinging jet, as schematically shown in Fig. 1.1[1] and Fig. 1.2[2], respectively. A potential core is formed which is called “the developing or free jet region” near the jet axis. Near the impinging plate, the jet impinges the plate and then is deflected away. We have the deflection zone of “the impingement flow region”. Away from the stagnation point, the flow moves radially outwards and is called “the wall jet region”. The literature relevant to the vortex flow and heat transfer in the jet impinging onto a heated plate is reviewed briefly in the following.
Considerable research has been carried out in the past to study the fluid flow and heat transfer in the round or slot jet impinging vertically downwards onto a large horizontal plate without confinement. Most of the studies focus on quantifying the highly efficient heat transfer associated with the high speed impinging jets. For example, heat or mass transfer in an unconfined air impinging jet was investigated by Hrycak[3] for Dp/Dj = 16 , here Dp is the plate diameter and Dj is the nozzle diameter.
Jambunathan et al.[4] and San and Shiao[5] studied an air jet impinging onto a rectangular plate for L/Dj = 5.5~166.7 and W/Dj = 4.17~41.7, here L is the plate
length and W is plate width. They found that there existed a maximum Nusselt number and they focused on effects of the jet size and flow in the stagnation region. Similar investigations on the cooling efficiency of air impinging jets were carried out by Chou and Hung [6] for L/W = 20 and by Chung and Luo [7] for L/W = 4~10. Chou and Hung [6] proposed correlations for Nusselt number and found that if the velocity distribution is parabolic, there is a maximum Nusselt number in the stagnation region.
impinging air jet respectively with L/W = 20 for a slot jet and L/Dj = 14.4~28.8 for a
round jet. The numerical modeling of slot air jet impingement cooling of a constant heat flux surface confined by a parallel wall conducted by Sahoo and sharif [8] found that when the jet Reynolds number increased, the centers of the primary and secondary inertia-driven rolls moved outward and when the buoyancy-inertia ratio increased, the strength and length of the secondary vortex decreases. While the investigation of the effects of the upper plate confinement on the heat transfer to round impinging jets exiting a long pipe examined by Gao and Ewing [9] found that the heat transfer resulting from the confined jet is smaller than that from the unconfined jet and when the jet Reynolds number increased , the location of the secondary maximum heat transfer on the impinging plate moved outward.
The flow field in a confined round jet impinging onto a rectangular target plate was investigated by Fitzgerald and Garimella [10] for L/Dj = 110~55 and W/Dj =
15~55. Besides, a study of the flow field of a confined and submerged round impinging jet of FC-77 was conducted by Morris and Garimella[11] for Dp/Dj = 15,
here Dp is the diameter of the plate and Dj is the diameter of jet. Morris et al. [12]
moved further to predict the flow-field in submerged and confined jet impingement by using the Reynolds stress model. They found that for an increase in the jet Reynolds number, the location of the center of the primary inertia-driven roll moved outward. Santen et al. [13, 14] studied mixed convection in radial flow between two horizontal plates in a confined air impinging jet with DP/Dj =25. They found that the value of the
Rayleigh number affects the existence of non-axisymmetric flows and at high jet Reynolds number and low Rayleigh number, the non-axisymmetric flows can be suppressed and the three-dimensional flow changes to an axisymmetric flow. Chiriac and Ortega [15] carried out a numerical study of the unsteady flow and heat transfer in a transitional confined slot jet of air impinging onto a rectangular isothermal
surface. They found that at the jet Reynolds number between 585 and 610, the flow becomes unsteady. Effects of the jet Reynolds number are investigated by Hsieh et al. [16-19] for a round impinging air jet confined in a vertical cylinder Dp/Dj=9.8~21.6.
They reported that the jet Reynolds number can significantly influence the onset of the primary and secondary inertia-driven circular vortex rolls and if the jet Reynolds number is large enough, the tertiary inertia-driven roll can appear. Besides, the buoyancy-to-inertia ratio affects the onset of the buoyancy-driven roll and an increase of the ratio can induce a time-periodic flow and new roll but sometime can suppress the unsteady vortex flow. They also found that if the chamber top is tilted downward in the radial direction, the buoyancy-driven roll can be suppressed. Moreover, at a certain jet-disk separation distance the buoyancy-driven roll and inertia-driven roll are both large and can push and squeeze each other for certain ranges of Rej and Ra.
Santen et al.[20] examined a confined impinging jet of air with Dp/Dj = 25 and
noted that the onset of thermal instability was a function of Ra , Rej and Pr. A
numerical study from Liu et al.[21] for a round confined impinging air jet observed that at high jet Reynolds number and Rayleigh number short radial rolls can be induced and many buoyancy driven rolls appear in the flow.
1.3 objective of present study
The above literature review clearly reveals that in a gas jet impinging onto a large heated disk the inertia and buoyancy driven vortex rolls aside from the circular rolls may be induced. But the patterns of these new vortex flows and the associated thermal characteristics remain largely unexplored. Experiment will be conducted in the present study to examine the possible presence of the inertia and buoyancy driven new vortex rolls in an air jet impinging onto a large heated disk with an upper parallel plate confinement. Attention will be focused on delineating the conditions leading to
Fig. 1.1 Flow structure associated with a circular unconfined jet impinging onto a flat plate.
Potential core
Free jet region Wall jet region Stagnation region
Nozzle
H
Confined plate
Impinging jet
Potential core
Free jet region
wall jet region wall jet region Impinging region
j
U' = 0.95 Umax
Fig. 1.2 Flow structure associated with a circular confined jet impinging onto a flat plate.
Chapter 2
Experimental Apparatus and Procedures
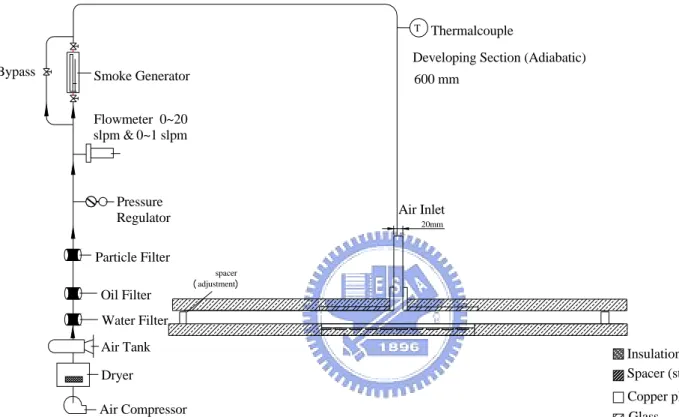
In order to conduct the experiment at reasonably low cost, we use air as the working fluid to replace the inert gases normally employed in real CVD and RTP processes. In view of the similar thermodynamic and thermophysical properties for various gases, the results obtained here are still applicable to the CVD and RTP systems. The experimental system established in the present study to unravel the possible presence of new vortex flow structures and the associated thermal characteristics in a confined impinging air jet over a large horizontal heated disk and the test section are respectively shown in Figs. 2.1 and 2.2 schematically. The system consists of five major parts – the test section, temperature measurement unit, visualization unit, heating unit, and gas injection unit. The gas is first brought into the test section through an injector and then injected directly onto a circular heated disk. The major parts are briefly described in the following.
2.1 Experimental apparatus
(1) Test section:
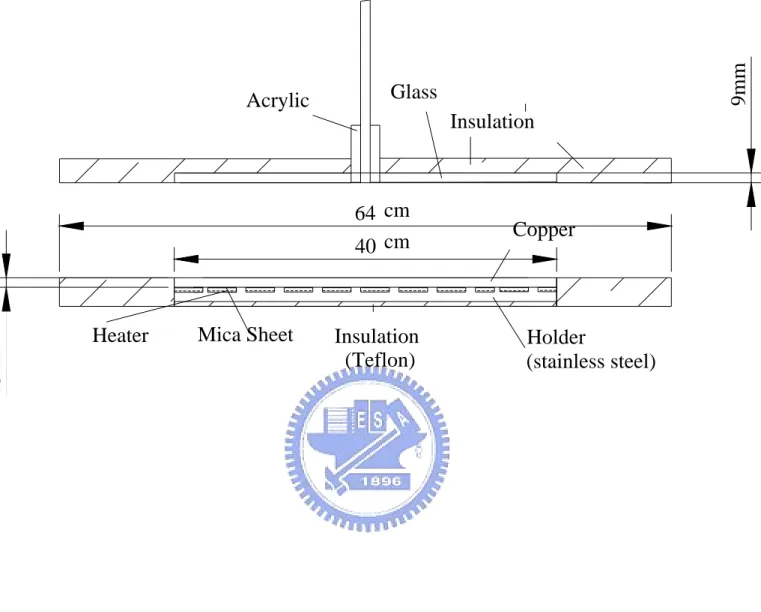
The test section consists of an upper horizontal circular disk and a lower parallel circular heated disk. The upper circular disk is made of 9-mm thick circular glass plate to allow for the observation of the vortex pattern and is supported by several stainless steel bars to keep it at a required jet-disk separation distance. The stainless steel bars have skews so that we can adjust the vertical distance between the exits of the injection pipes and the heated disk. The structure of the lower circular heated disk will be described in the next subsection. Besides, the experimental system is very sensitive to disturbances from the surroundings. Therefore, the system isconfined in a small room formed by three wood planes and one black sheet of lint to reduce the effects of the disturbances from discharging the flow to the ambient surrounding.
(2) Heating unit:
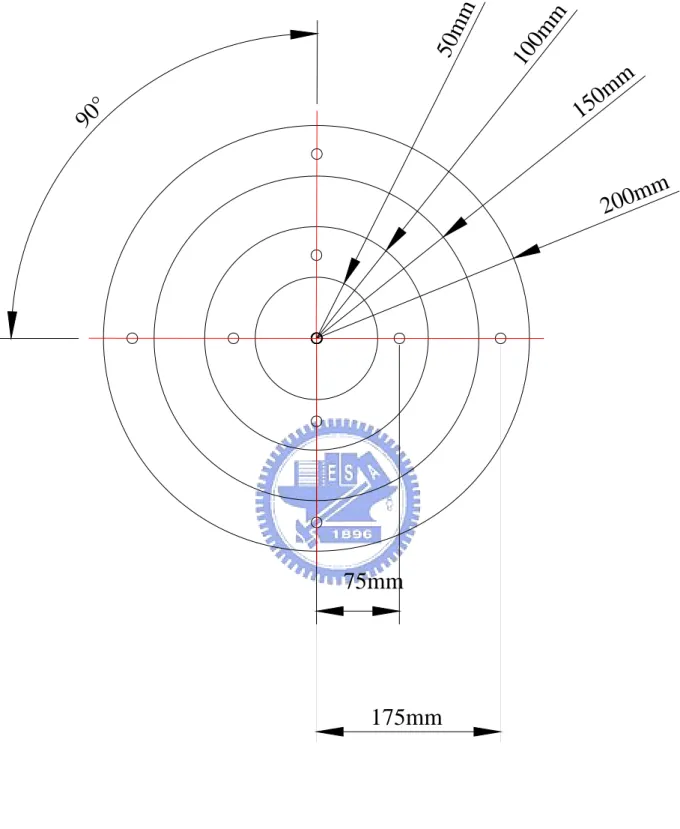
The heating unit is designed to maintain the lower circular disk at the preset uniform temperature during the experiment. It mainly includes a 15-mm thick high purity copper plate of 16-inch in diameter, acting as the impinging disk, which is directly placed on the heating elements. The edge of the heated disk is connected with a concentric insulated portion with an outer diameter of 25 inches. Besides, care is taken to insure that the upper surfaces of the heated disk and the insulated portion are kept at the same horizontal level so that the wall jet dose not experience a step change as it crosses the edge of the heated disk. After the jet impinges the heated disk, it moves in the radial direction over the heated plate and the insulated portion. Then the air is discharged into the ambient. More specifically, the heating unit consists of a resistance heating element, a holder and an insulator. The holder which is made of stainless steel can support the resistance heating element and the heated copper disk. The heater attached onto the back side of the copper plate is divided into 4 concentric zones (Fig. 2.3). Each zone is independently heated by a power supply with the D.C. current passing through the nickel coil placed on the stainless steel holder and its resistance is about 166 ohm. The entire heating unit is then placed on a Teflon plate. Additionally, to reduce the heat loss from the sidewall of the copper plate and Teflon plate, the lateral surface of the entire heating unit is wrapped with a 20.0-mm thick thermal insulation layer of superlon. A proper control of the voltage from each power supply allows us to maintain the copper plate at a nearly uniform temperature. Moreover, the copper plate temperature is measured by several corrected and calibrated T-type thermocouples at selected detection points located at 1-mm below the upper surface of the copper plate, which are fixed at thedetection points through the small holes drilled from the backside of the plate (Fig. 2.4).
(3) Gas injection unit:
The gas injection unit consists of a 2HP air compressor, a flow meter, a smoke generator, filters, pressure regulator, connection pipes and injector. In the experiment, air is drawn from the ambient by the compressor and sent into a 300-liter and 100-psi high-pressure air tank and is filtered to remove moisture and tiny particles. The installation of the high-pressure air tank intends to suppress the fluctuation of the air flow and extends the life of the compressor. Then, the air is mixed with smoke tracers in the smoke generator, regulated by the pressure regulator and later injected into the test section through a straight coaxial circular injection pipe. The downward vertical air jet issuing from the pipe outlet impinges directly onto the heated plate. In the present study, an injection pipe with a diameter of 20.0 mm is chosen and the straight portion of the pipe is 600-mm long. The length of the injection pipe is selected to ensure that they are long enough to allow us to have a fully developed air flow at the exit of the injection pipe. The distance between the exit of the injection pipe and the heated disk can be varied from 12.5 to 25.0 mm. The air temperature at 600-mm upstream of the exit of the injection pipe is measured by a corrected and calibrated T-type thermocouple. The measured value is considered as the temperature of the air injected into the test section since the whole injection pipe is thermally well insulated by a superlon insulation layer of 16-mm thick.(4)
Visualization unit:
A smoke-tracer flow visualization technique is employed to observe the flow patterns resulting from the jet impinging onto the heated disk in the test section. The air flow pattern in the test section is illuminated by vertical and horizontal plane light sheets produced by passing parallel lights from an overhead projector through two adjustable knife edges. The experimental system is located in a darkroom to improve the contrast of the flow photos. The time variations of the flowpattern during the entire transient stage from the top and side views are recorded by the Sony digital video camera DCR-PC330. The recorded images are later examined carefully in a personal computer.
(5) Temperature measurement:
To understand thermal characteristics of the steady and unsteady vortex flows, the temperature of the air flow in the test section is measured by inserting a thermocouple probe laterally into the test section from the outside of the insulated portion. In the experiment, the thermocouple tip is positioned at selected vertical distances from the upper surface of the heated disk. More specifically, the thermocouple probe is an OMEGA (model HYPO) mini hypodermic extremely small T-type thermocouple implanted in a 1-inch long stainless steel hypodermic needle. The transient air temperature at selected locations in the test section is recorded by a recorder (YOKOGAWA MV200) after the vortex flow reaches a statistical state in which the initial transients in the flow have died out. The sampling rate of the recorder is 8 Hz for each data channel.2.3 Experimental procedures
For each case the experiment starts with the air at the room temperature Ta
compressed first into the high pressure tank and the smoke generator through the connection pipe, and then injected into the test section. The air moves first over the heated disk and finally leaves the test section. In the meantime the temperature of the heated disk and the air flow rate are controlled at the preset levels. As the air flow in the test section reaches steady or statistically stable state, we begin to visualize and record the vortex flow pattern in the space between the horizontal disks. Meanwhile, the air temperature is measured.
Fig. 2.1 Schematic diagram of the experimental system. Bypass Air Tank Air Compressor Dryer Oil Filter Particle Filter Pressure Regulator Smoke Generator Flowmeter 0~20 slpm & 0~1 slpm Thermalcouple T
Developing Section (Adiabatic) 600 mm
Water Filter
Insulation layer (Teflon) Spacer (staniless steel) Copper plate
Glass
Electrical resistance heating coils spacer
adjustment
Air Inlet 20mm
Fig. 2.2 Schematic of the test section from side view showing the design of the heated disk.
Copper
(Teflon)
Mica Sheet
Heater
Insulation
Glass
Insulation
Acrylic
40
64
cm
cm
15mm
9mm
Holder
(stainless steel)
100mm 10mm 37.5mm 10mm 30mm 285mm 400mm
Electrical resistance heating coils Holder
Insulator
Electrical resistance heating coils
Holder (Stainless steel)
Insulator (Teflon)
640 mm
Fig. 2.3 The heater consists of three parts: resistance heating element, holder and insulator.
175mm
50
m
m
10
0m
m
15
0m
m
200
mm
75mm
90
°
Chapter 3
DIMENSIONLESS GROUPS AND UNCERTAINTY
ANALYSIS
The dimensionless groups relevant to the present problem and the analysis of the uncertainties of the variables in this experiment are briefly examined in this chapter.
3.1 Dimensionless Groups
The non-dimensional parameters associated with the flow considered here are the jet Reynolds number Rej, based on the average velocity of the air jet V at the j
injection pipe exit and the diameter of the injection pipe Dj, and the Rayleigh number
Ra, based on the temperature difference between the heated disk and inlet gas ΔT and the jet-disk separation distance H. They are respectively defined as
j j j D Q 4 D V Re j j ν π = ν = , (3.1) (3.2)
where α is the thermal diffusivity, g is the gravitational acceleration, β is the thermal expansion coefficient, and ν is the kinematic viscosity. Besides, we have the nondimensional jet-disk separation distance HDj defined as
j j H HD = D (3.3)
3.2 Uncertainty Analysis
An uncertainty analysis is carried out here to estimate the uncertainty levels in
αν Δ β = αν − β = 3 3 j f T)H g TH T ( g Ra and
the experiment. Kline and McClintock [22] proposed a formula for evaluating the uncertainty in the result F as a function of independent variables,
n 2
1,X , ,X
X LLLL ,
F=F
(
X1,X2,X3,LL,Xn)
(3.4) The absolute uncertainty of F is expressed as2 1 2 n n 2 3 3 2 2 2 2 1 1 X X F X X F X X F X X F F ⎪⎭ ⎪ ⎬ ⎫ ⎪⎩ ⎪ ⎨ ⎧ ⎥ ⎦ ⎤ ⎢ ⎣ ⎡ δ ⎟⎟ ⎠ ⎞ ⎜⎜ ⎝ ⎛ ∂ ∂ + + ⎥ ⎦ ⎤ ⎢ ⎣ ⎡ δ ⎟⎟ ⎠ ⎞ ⎜⎜ ⎝ ⎛ ∂ ∂ + ⎥ ⎦ ⎤ ⎢ ⎣ ⎡ δ ⎟⎟ ⎠ ⎞ ⎜⎜ ⎝ ⎛ ∂ ∂ + ⎥ ⎦ ⎤ ⎢ ⎣ ⎡ δ ⎟⎟ ⎠ ⎞ ⎜⎜ ⎝ ⎛ ∂ ∂ = δ L (3.5)
and the relative uncertainty of F is
2 1 2 n n n 2 2 2 2 2 1 1 1 X X X ln F ln X X X ln F ln X X X ln F ln F F ⎪⎭ ⎪ ⎬ ⎫ ⎪⎩ ⎪ ⎨ ⎧ ⎥ ⎦ ⎤ ⎢ ⎣ ⎡ ⎟⎟ ⎠ ⎞ ⎜⎜ ⎝ ⎛ δ ⎟⎟ ⎠ ⎞ ⎜⎜ ⎝ ⎛ ∂ ∂ + + ⎥ ⎦ ⎤ ⎢ ⎣ ⎡ ⎟⎟ ⎠ ⎞ ⎜⎜ ⎝ ⎛ δ ⎟⎟ ⎠ ⎞ ⎜⎜ ⎝ ⎛ ∂ ∂ + ⎥ ⎦ ⎤ ⎢ ⎣ ⎡ ⎟⎟ ⎠ ⎞ ⎜⎜ ⎝ ⎛ δ ⎟⎟ ⎠ ⎞ ⎜⎜ ⎝ ⎛ ∂ ∂ = δ L (3.6) If c 3 b 2 a 1X X X
F= ... , then the relative uncertainty is
2 1 2 3 3 2 2 2 2 1 1 X X c X X b X X a F F ⎥ ⎥ ⎦ ⎤ ⎢ ⎢ ⎣ ⎡ + ⎟⎟ ⎠ ⎞ ⎜⎜ ⎝ ⎛ δ + ⎟⎟ ⎠ ⎞ ⎜⎜ ⎝ ⎛ δ + ⎟⎟ ⎠ ⎞ ⎜⎜ ⎝ ⎛ δ = δ L L (3.7)
where (∂F/∂Xi) and δXi are, respectively, the sensitivity coefficient and uncertainty level associated with the variable Xi. The values of the uncertainty intervals δXi are obtained by a root-mean-square combination of the precision uncertainty of the instruments and the unsteadiness uncertainty, as recommended by Moffat [23]. The choice of the variable Xi to be included in the calculation of the total uncertainty level of the result F depends on the purpose of the analysis. The uncertainties for the chosen parameters are calculated as follows:
(1) Uncertainty of the measured temperature difference, ΔT=Tf −Tj
(T T) [( T ) ( T)2]12 j 2 f j f − = δ + δ δ (3.8)
is ) 118 /( 10 448 . 1 × 6 1.5 + = − T T μ (3.9) ) 118 /( 10 195 . 1 k= × −6 1.6 + T T ρ μ = ν /
The uncertainties of the properties are
T T T T T T T T T T T k k T k k δ ∂ ∂μ μ = μ δμ δ ∂ ∂ρ ρ = ρ δρ δ ∂ ∂ = δ (3.10)
(3) Uncertainty of the Rayleigh number, Ra,
(3.11)
⎥⎦
⎤
⎢⎣
⎡
⎟ ⎠ ⎞ ⎜ ⎝ ⎛ ν δν + ⎟ ⎠ ⎞ ⎜ ⎝ ⎛ α δα + ⎟ ⎠ ⎞ ⎜ ⎝ ⎛ Δ Δ δ + ⎟ ⎠ ⎞ ⎜ ⎝ ⎛ δ + ⎟⎟ ⎠ ⎞ ⎜⎜ ⎝ ⎛ β β δ = δ 2 2 2 2 2 1/2 T T H H 3 g g Ra Ra (3.12)(4) Uncertainty of the jet Reynolds number, Rej,
j j j D Q 4 D V Re j j ν π = ν = (3.13) 1 / 2 2 2 2 Re Re j j j j j j Q D Q D δ δν δ δ ν ⎛ ⎞ ⎛ ⎞ ⎛ ⎞ = ⎜ ⎟ +⎜ ⎟ +⎜ ⎟ ⎝ ⎠ ⎝ ⎠ ⎝ ⎠
⎡
⎤
⎢
⎥
⎣
⎦
(3.14)(5) Uncertainty of the nondimensional jet-disk separation distance HDj ,
j j H HD = D (3.15) 1/2 2 2 j j j j δHD δH δD = + HD H D ⎡⎛ ⎞ ⎛ ⎞ ⎤ ⎢⎜ ⎟ ⎜ ⎟ ⎥ ⎜ ⎟ ⎢⎝ ⎠ ⎝ ⎠ ⎥ ⎣ ⎦ (3.16)
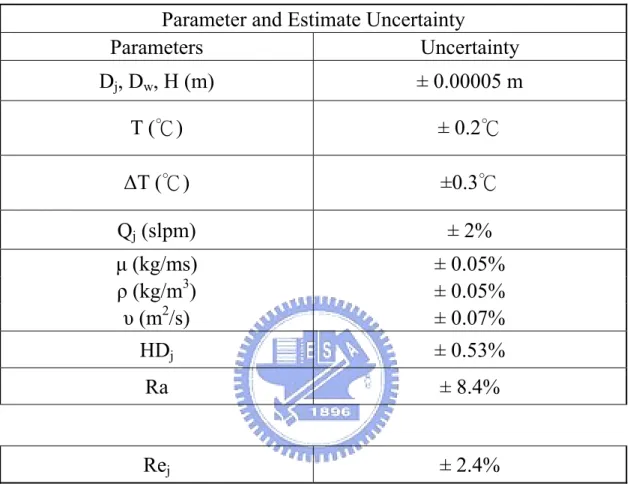
The results from this uncertainty analysis are summarized in Table 3.1.
αν Δ β = αν − β = 3 3 j f T)H g TH T ( g Ra
Table 3.1 Summary of uncertainty analysis
Parameter and Estimate Uncertainty
Parameters Uncertainty
D
j, D
w, H (m)
± 0.00005 m
T (℃) ±
0.2℃
ΔT (℃) ±0.3℃
Q
j(slpm)
± 2%
μ (kg/ms)
± 0.05%
ρ (kg/m
3) ±
0.05%
υ (m
2/s) ±
0.07%
HD
j±
0.53%
Ra ±
8.4%
Re
j±
2.4%
Chapter 4
Results and Discussion
It is noted that the flow characteristics associated with the confined air jet impinging onto the large heated disk under investigation are affected by the jet inertia, buoyancy force due to the heated disk, and the geometry of the injection pipe diameter and jet-disk separation distance. In the present experiment the injection pipe diameter is fixed at 20.0 mm and the jet-disk separation distance is chosen to be at 12.5 and 25.0 mm. The jet flow rate ranges from 0.4 to 10.0 slpm (standard liter per minute) and the temperature difference between the heated disk and the injected air is varied from 0 to 14.0°C. As noted in Chapter 3, the dimensionless groups governing the flow are the jet Reynolds number, Rayleigh number, and nondimensional jet-disk separation distance. They are respectively defined as
j j j V D 4 Re = j j Q D ν =π ν (4.1) αν Δ β =g TH3 Ra (4.2) j j H HD = D (4.3)
The Grashof number is defined as Pr / 2 3 Ra TH g Gr = Δ = ν β (4.4)
Thus in the present study the jet Reynolds number Rej ranges from 27 to 676, the
Rayleigh number Ra from 0 to 7,340, the Grashof number Gr from 0 to 10,500 for HDj = 0.625 and 1.25. In what follows selected flow photos taken from side views and
examined closely to delineate how the gas flow and thermal characteristics are affected by the governing dimensionless groups. It should be mentioned that the vortex flow patterns in the confined impinging jet flow are found to be relatively different for H=25.0 mm and 12.5 mm. Hence the results for the two different jet-disk separation distances will be present separately.
4.1 Vortex flow characteristics for H=25.0 mm
At first the vortex flow pattern observed for the limiting case of the unheated lower copper disk with ΔT= 0°C( Ra= 0) for the jet flow rate Qj varied from 1.5 to 6
slpm ( Rej= 101 to 406 ) at long time when the flow already reaches steady state is
illustrated in Fig. 4.1 for HDj = 1.25. The results indicate that there exist two circular
rolls in the test section. The mechanisms through which these two rolls are formed are examined closely. Specifically, upon impinging the heated plate the jet is deflected to move radially outward along the disk and slows down significantly due to the radial spread of the wall-jet flow. The wall-jet flow travels a certain distance from the stagnation point and then moves obliquely upwards as a result of the jet momentum is unable to overcome the wall friction and the retarding effects of the entrained flow by the upper confinement plate. Then, the oblique flow is divided into two streams as it encounters the upper plate. One stream moves radial inward toward the low pressure region created by the viscous shearing of the surrounding fluid associated with the jet injection, forming the inner roll which is therefore considered as the primary inertia-driven roll. Another stream moves outward along the upper plate for certain distance until it is unable to overcome the wall friction of upper plate. Then it descends gradually and flows outward. The phenomenon is often seen at low flow rate. But at a high flow rate, a smaller second roll is induced near the primary inertia-driven roll which is found to be driven by the viscous shearing effects
produced by the stronger and larger primary inertia-driven roll, which is termed as the secondary inertia-driven roll and has the opposite rotating direction with the primary inertia-driven roll. Besides, at decreasing flow rate both the primary and secondary inertia-driven rolls become weaker and smaller.
Next, the long time vortex flow patterns in the test section for the cases with the lower plate heated are shown in Figs. 4.2-4.5 for ΔT= 2°C ~ 5°C and HDj = 1.25 at
various jet flow rates by presenting the side flow photos at the statistical state. The results indicate that in addition to the primary and/or secondary inertia-driven rolls induced near the jet axis, several buoyancy-driven rolls appear in the outer region of the test section right above the edge of the heated plate even at the low temperature difference of 2°C (Fig. 4.2). More specifically, at the high Qj of 6 slpm two buoyancy
rolls have been induced near the exit of the test section. These two rolls are respectively designated as the “first and second buoyancy rolls.“ As Qj is lowered to 5
slpm, the third buoyancy roll appears above the heated plate adjacent to the first and second buoyancy rolls. This process of new buoyancy roll generation continues at reducing jet flow rate. Note that at Qj = 4 and 3 slpm the fourth buoyancy roll appears
and the fifth buoyancy emerges at Qj = 2 slpm. There are five buoyancy rolls in the
test section for Qj = 1.5 slpm. Besides, the adjacent buoyancy rolls rotate in opposite
directions. Similar vortex flow patterns ate noted at higher ΔT, as evident from the flow photos shown in Figs. 4.3-4.5.
It is important to note that the resulting vortex flows presented above do not reach steady state at long time even at the small ΔT of 2°C. This can be attributed to the fact that the buoyancy rolls push each other and sometime merge of the buoyancy rolls occurs. The temporal evolution of the vortex flow pattern will be examined later. It is also noted that the vertical extent of the inertia-driven rolls reduces to a certain degree as the buoyancy-driven rolls appear. Besides, the buoyancy-driven rolls do not
possess axisymmetry for all cases in Figs. 4.2-4.5. In fact, the vortex flow is somewhat irregular even at low buoyancy-to-inertia ratio. This is clearly seen from the long time top view flow photos shown in Figs. 4.6-4.9. The deformation of the buoyancy rolls is larger at a higher Ra or a lower Rej. Specifically, at a very low
buoyancy-to-inertia ratio Gr/ Rej2 the vortex flow is dominated by the inertia-driven
roll (Figs. 4.6(f), and 4.7(f) ). The buoyancy rolls are very weak. At slightly higher Gr/ Rej2 deformed buoyancy-driven circular rolls along with regular inertia-driven roll
prevail such as that given in Figs. 4.6 (d) & (e), 4.7 (d) & (e). For a further increase in Gr/ Rej2 the buoyancy rolls become highly deformed especially these near
the exit of the test section (Figs. 4.6 (c), and 4.7(c) ). For an even higher Gr/ Rej2 the
buoyancy-driven vortex flow consists of irregular circular rolls, as is clear in Figs. 4.6(b) and 4.7(b). Some of these rolls in fact can be regarded as incomplete rolls. The inertia-driven roll also deforms to some degree. At a still higher Gr/ Rej2 the vortex
rolls become highly irregular (Figs. 4.6(a), 4.7(a), 4.8(a) & (b), and 4.9(a) & (b)). Some of these rolls can be also regarded as incomplete rolls.
4.1.1 Effects of jet Reynolds number
The effects of the jet Reynolds number on the vortex flow patterns prevailed in the test section with H=25.0 mm can also be revealed from the results in Figs. 4.1-4.9. For a given ΔT the strength and number of the buoyancy-driven rolls increases significantly at decreasing jet Reynolds number, obviously due to the increase in the buoyancy-to-inertia ratio. However, the inertia-driven rolls weaken at decreasing Rej,
apparently owing to the reducing jet inertia. At the lowest Rej of 101 tested here the
most inner buoyancy roll may contact with the primary inertia-driven roll for a high ΔT (Figs. 4.4 & 4.5). Thus the interaction between the inertia- and buoyancy-driven vortex flows is stronger. Besides, at lower Rej the most outer buoyancy roll near the
edge of the heated plate is much larger and stronger than the other buoyancy rolls.
4.1.2 Effects of Rayleigh number
How the long time vortex flow pattern for H=25.0 mm is affected by the Rayleigh number is illustrated in Figs. 4.10-4.15 by showing the side view flow photos at increasing ΔT for various Qj at the statistical state. The results indicate that
an increase in the Rayleigh number for a given jet Reynolds number causes stronger and more buoyancy rolls to be induced in the test section. Besides, the sizes of the buoyancy rolls in the test section vary substantially even at the same Ra and Rej. The
size of the most outer buoyancy-driven roll varies substantially for a change in Ra. It is of interest to note that in the presence of the buoyancy effect for ΔT > 0°C the primary inertia-driven roll becomes elongated in the radial direction when compared with that for ΔT = 0°C. This roll elongation is more prominent at a higher Ra.
4.1.3 Vortex flow evolution
Attention is then turned to examining the time evolution of the vortex flow induced in the test section at H=25.0 mm for selected cases at the statistical state. Figure 4.16 shows the side view flow photos at the selected time instants in the statistical state for the case with Rej =101 and Ra = 2,940 (ΔT = 2°C). The symbol “t
= 0“ denotes a certain time instant in the statistical state. Note that there are five buoyancy-driven rolls and one inertia-driven rolls in the test section. In the right half of the test section the variations of the roll size and strength with time are rather slight initially. But in the right half of the test section merge and split of the buoyancy rolls occur nonperiodically with time, causing significant changes in the roll size and pattern. In addition to the buoyancy roll, the downstream tip of the primary inertia-driven roll in the left half of the test section splits to form a new roll at t = 12s.
Later, the buoyancy rolls in the right half of the test section experience similar changes. The resulting vortex flow pattern is highly asymmetrical. Moreover, cyclic radial expansion and contraction of the buoyancy rolls are seen. At higher Ra for ΔT = 3°C the evolution of the vortex flow pattern is slightly quicker, as evident by comparing the results in Fig. 4.16 with Fig. 4.17. Besides, the radial extent of the primary inertia-driven roll varies noticeably with time. And the degree of the roll asymmetry is more severe. This trend continues for a further increase of ΔT to 4°C and 5°C, as evident from the results shown in Figs. 4.18 and 4.19.
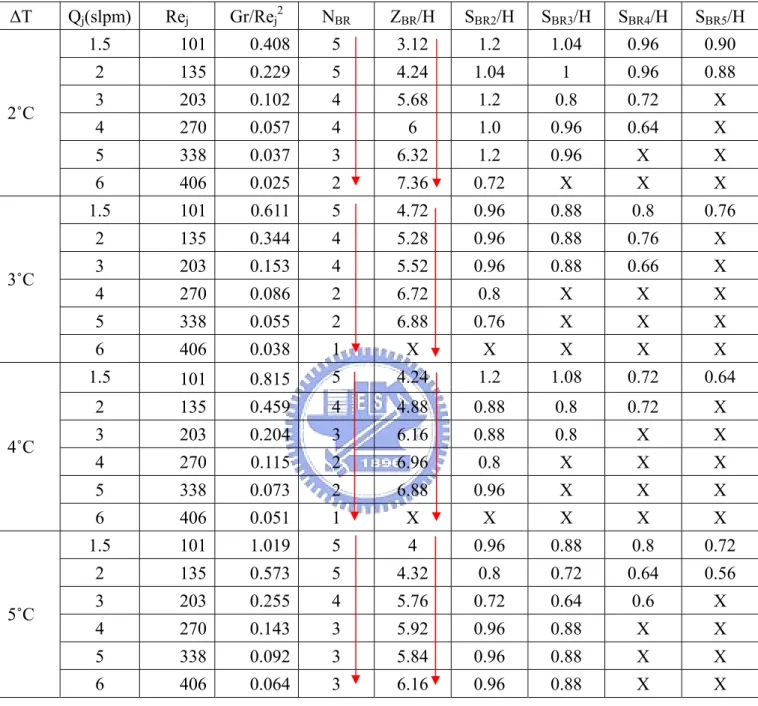
4.1.4 Quantitative characteristics of buoyancy-driven rolls
In the impinging jet flow over a large heated disk investigated in the present study, the observed buoyancy-driven vortex flow presented above for H=25.0 mm is rather complicate. Here we summarize some important quantitative characteristics of the long time buoyancy-driven vortex flow in Table 4.1, which are deduced from the flow photos. These include the total number of the buoyancy rolls induced NBR and
the radial position of the center of the most inner buoyancy roll ZBR. Besides, SBR2
denotes the maximum radial extent of the second buoyancy roll. Similar symbols are used for the other buoyancy rolls.
The data given in Table 4.1 are correlated empirically as follows. For the most inner buoyancy roll the radial location of the roll center can be correlated as
ZBR/H=
-23.5+7.37*(Gr/Rej2)-63.1*(Gr/Rej2)2+174*(Gr/Rej2)3-188*(Gr/Rej2)4
+69.2*(Gr/Rej2)5+275/(NBR)-932/(NBR)21330/(NBR)3-648/(NBR)4
for 101≤ Rej ≥ 406 and 1470≤ Ra ≥ 7,340 (4.5)
The maximum radial extents of the second to fifth buoyancy-driven rolls counting from the most outer buoyancy roll can be correlated respectively as
SBR2/H =(Gr/Rej2) (ZBR/H) 20.4-48.4*(Gr/Rej2)-17.5*ln(ZBR/H)+56.1*(Gr/Rej2)2+3.8*(ln(ZBR/H))2 +23.9*(Gr/Rej2)*ln(ZBR/H)-13.52*(Gr/Rej2)3+0.0056*(LN(ZBR/H))3 +0.032*(LN(ZBR/H))2* (Gr/Rej2)-21.53*(Gr/Rej2)2*ln(ZBR/H) for 101≤ Rej ≥ 406 and 1470≤ Ra ≥ 7,340, (4.6) SBR3/H
=574-2.77(Gr/Rej2)+15.8*(Gr/Rej2)2-55.4*(Gr/Rej2)3
+77.7*(Gr/Rej2)4-35.4*(Gr/Rej2)5-605*(ZBR/H)2
+250*(ZBR/H)2-51*(ZBR/H)3 +5.1*(Gr/Rej2)4-0.2*(Gr/Rej2)5
for 101≤ Rej ≥ 406 and 1470≤ Ra ≥ 7,340, (4.7)
SBR4/H
= -0.84-0.165*ln(Gr/Rej2)-0.04*(ln(Gr/Rej2))2.5+0.028*(ln(Gr/Rej2))3
+0.0045*(Gr/Rej2)4.5+3.26*(ZBR/H)-1.65*(ZBR/H)2.5+0.52*(ZBR/H)3
-0.076*(ZBR/H)4.5+0.085*(ZBR/H)5
for 101≤ Rej ≥ 406 and 1470≤ Ra ≥ 7,340, (4.8)
and SBR5/H
= 568-0.163*(Gr/Rej2)+5.50*(Gr/Rej2)2.5-4.89*(Gr/Rej2)3-151*(ZBR/H)
+276*(ZBR/H)0.5*ln(ZBR/H)-0.618*(ln(ZBR/H))2-426*ln(ZBR/H)
-185/ln(ZBR/H)
for 101≤ Rej ≥ 406 and 1470≤ Ra ≥ 7,340 (4.9)
When compared with the present measured data, the standard deviations of the above five correlations are 3.4%, 8.4%, 13.2%, 15.5%, and 1.2%, individually.
4.1.5 Thermal characteristics
(Tf –Tj) at selected locations are presented in Figs.4.20-4.27 for various Rej and Ra at
H=25.0 mm. The results indicate that for the air jet impinging onto the large heated plate the air temperature is in unstable oscillation since the resulting vortex flow is unable even at low buoyancy-to-inertia ratio. In fact, nonperidic flow oscillation prevails for all cases with a high frequency oscillation component superimposed on a low frequency oscillation.
4.1.6 Flow regime map
Based on the results obtained in the present study, a flow regime map in terms of Ra vs. Rej for the cases with H = 25 mm is given in Fig. 4.28 to delineate the
parameter domains for the identified three different buoyancy-driven vortex flow patterns induced in the confined impinging jet. These include the nearly regular circular roll pattern, incomplete vortex roll pattern, and irregular roll pattern. The results in this plot manifest that at low buoyancy-to-inertia ratio Gr/Rej2 the nearly
regular vortex flow prevails and at high Gr/Rej2 the irregular vortex flow eliminates.
Besides, the incomplete circular rolls predominate at the intermediate Gr/Rej2. The
boundaries separating the different vortex flow patterns are correlated empirically. First, the boundary separating the irregular and incomplete vortex rolls can be correlated as
Ra = 885+0.089* Rej2 (4.10)
for 101<Rej<406 and 1470<Ra<7,340
and the standard deviations is 9.5%.
Then, the boundary between the incomplete and regular vortex rolls can be correlated as
Ra = 4010+0.551* Rej1.5 (4.11)
and the standard deviations is 1.6%.
4.2 New vortex flow patterns at H=12.5 mm
It is of interest to note in the flow visualization that two new vortex flow patterns appear when the jet-disk separation distance is reduced to 12.5 mm. More specifically, we observed radial rolls and moving circular waves in certain ranges of the jet Reynolds number and Rayleigh number. The top view flow photos taken at the midheight of the test section are presented in Figs. 4.29-4.42 for various Rej and Ra to
illustrate these new vortex flow patterns. The results given in Fig. 4.29 for Ra=1,470 (ΔT=8°C) at Rej increased from 101 to 676 show that a few moving circular waves
appear in the outer zone of the test section at the small Rej of 101. These waves are
slightly deformed and do not possess axisymmetry. Besides, they move in the radial direction and their wave fronts are normal to the direction of the wall jet flow. Hence they are essentially the transverse waves. For an increase of Rej to 135 several radial
rolls are induced, in addition to the weaker moving waves (Fig. 4.29(b)). Note that the radial rolls originate in the stagnation region of the impinging jet near the jet axis and grow in size in the radial direction. But the size of the induced radial rolls in the test section for the given Rej and Ra varies noticeably in the circumferential direction.
Some radial rolls are large than the other. As the jet Reynolds number is raised to 203 and high level, no moving waves and radial rolls are seen. Instead, the flow in the test section is dominated by the primary and secondary inertia-driven circular rolls (Figs. 4.29(c)-(j)).
To ascertain the conditions leading to the appearance of the new vortex flow structures, we repeat the above experiment for a smaller interval of the jet Reynolds number. The obtained top view flow photos are shown in Fig. 4.30 for Rej ranging
from 27 to 149. The results indicate that the deformed moving waves prevail for Rej
the test section (Fig. 4.30(j)).
Next, the results presented in Figs. 4.31-4.34 for slightly higher ΔT of 9°C and 10°C show that the moving waves and radial rolls appear in nearly the same range as that for ΔT=8°C. For a further raise of ΔT to 11°C the moving waves exist in a slightly smaller range of Rej (27 to 68). But the pattern characterized by the
simultaneous presence of the radial rolls and moving waves, which is designated as “the mixed roll-wave pattern”, prevails in a slightly wider range of Rej (101 to 135),
as evident from Fig. 4.36. At the even higher ΔT of 12°C the range of Rej for the
appearance of the moving waves is even smaller (27 to 61) and the mixed roll-wave pattern dominates in a wider Rej range (68 to 115). Note that for Rej ranging from 122
to 149 only the radial rolls appear and no moving waves are seen (Figs. 4.37 and 4.38). For Rej larger than 149 the flow is dominated by the primary inertia-driven and
buoyancy-driven rolls. For a still higher ΔT of 13°C the results in Figs. 4.39 and 4.40 indicate that the moving waves dominate for Rej ranging from 27 to 54 and the mixed
pattern appears in a wider Rej range of 61 to 108. Besides, the radial rolls are
prevalent for a wider range of Rej (115 to 149). As ΔT is raised to 14 °C Figs. 4.41 and
4.42 show that buoyancy roll prevails at low Rej and the moving waves only appear at
Rej =27 to 41. For 47≦Rej ≦88 the mixed pattern dominates. And the radial rolls fill
the test section for 95≦Rej ≦149.
Selected data for the measured time records of the non-dimensional air temperature are presented in Figs. 4.43-4.49 for various Rej and Ra at H=12.5 mm.
The results indicate that the air temperature also oscillates irregularly with time when the new vortex flow patterns dominate in the test section.
The result presented above clearly indicate that three new vortex flow patterns have been identified in the present study. These patterns include the vortex flow dominates by the pure moving circular waves, the pure radial rolls, and the
coexistence of the moving waves and radial rolls. The range of Rej and Ra for the
appearance of these new vortex flow patterns are presented in flow regime maps given in Figs. 4.50 and 4.51 for H=12.5 mm.
The boundary separating the transversal waves and mixed roll-wave pattern can be correlated as
Ra= 3470-2.55*Rej1.5 (4.12)
for 20<Rej<676 and 1,470<Ra<2,670
and the standard deviations is 8.4%.
Besides, the boundary between the mixed roll-wave pattern and radial rolls can be correlated as
Ra= 3770-1.14*Rej1.5 (4.13)
for 20<Rej<676 and 1,470<Ra<2,670
and the standard deviations is 2.3%.
Then, the boundary separating the radial roll pattern and the pattern consisting of the primary inertia-driven roll and buoyancy-driven rolls can be correlated as
Ra= 4502-1.05*Rej1.5 (4.14)
for 20<Rej<676 and 1,470<Ra<2,670
and the standard deviations is 2.5%.
Finally, the boundary separating the pattern including the primary inertia-driven roll and buoyancy-driven rolls and the pattern consisting of the primary inertia-driven roll, secondary inertia-driven roll, and buoyancy-driven rolls can be correlated as
Ra=-125+0.291*Rej1.5 (4.15)
for 20<Rej<676 and 1,470<Ra<2,670
Table 4.1 The characteristics of buoyancy-driven rolls ΔT Qj(slpm) Rej Gr/Rej2 NBR ZBR/H SBR2/H SBR3/H SBR4/H SBR5/H 1.5 101 0.408 5 3.12 1.2 1.04 0.96 0.90 2 135 0.229 5 4.24 1.04 1 0.96 0.88 3 203 0.102 4 5.68 1.2 0.8 0.72 X 4 270 0.057 4 6 1.0 0.96 0.64 X 5 338 0.037 3 6.32 1.2 0.96 X X 2˚C 6 406 0.025 2 7.36 0.72 X X X 1.5 101 0.611 5 4.72 0.96 0.88 0.8 0.76 2 135 0.344 4 5.28 0.96 0.88 0.76 X 3 203 0.153 4 5.52 0.96 0.88 0.66 X 4 270 0.086 2 6.72 0.8 X X X 5 338 0.055 2 6.88 0.76 X X X 3˚C 6 406 0.038 1 X X X X X 1.5 101 0.815 5 4.24 1.2 1.08 0.72 0.64 2 135 0.459 4 4.88 0.88 0.8 0.72 X 3 203 0.204 3 6.16 0.88 0.8 X X 4 270 0.115 2 6.96 0.8 X X X 5 338 0.073 2 6.88 0.96 X X X 4˚C 6 406 0.051 1 X X X X X 1.5 101 1.019 5 4 0.96 0.88 0.8 0.72 2 135 0.573 5 4.32 0.8 0.72 0.64 0.56 3 203 0.255 4 5.76 0.72 0.64 0.6 X 4 270 0.143 3 5.92 0.96 0.88 X X 5 338 0.092 3 5.84 0.96 0.88 X X 5˚C 6 406 0.064 3 6.16 0.96 0.88 X X
(a)
(b)
(c)
(d)
(e)
Fig.4.1 Steady side view flow photos taken at the cross plane θ=0∘& 180∘for various jet Reynolds numbers at Ra=0 (△T=0°C) for H=25.0mm. Rej=372 (Qj=5.5slpm) Rej=406 (Qj=6slpm) Jet θ=0° Heating plate θ=180° Rej=338 (Qj=5slpm) Rej=304 (Qj=4.5slpm) Rej=270 (Qj=4slpm) 32
(f) (g) (h) (i) (j) Fig.4.1 continued Rej=203 (Qj=3slpm) Rej=237 (Qj=3.5slpm) Jet θ=0° Heating plate θ=180° Rej=169 (Qj=2.5slpm) Rej=135 (Qj=2.0slpm) Rej=101 (Qj=1.5slpm) 33
Fig.4.2 Side view flow photos taken at the cross plane θ=0∘& 180∘at statistical state for various jet Reynolds numbers at Ra=2940 (△T=2°C) for H=25.0mm. Rej=406 (Qj=6slpm) Jet θ=0° Heating plate θ=180° Rej=338 (Qj=5slpm) Rej=270 (Qj=4slpm) Rej=203 (Qj=3slpm) Rej=135 (Qj=2.0slpm) Rej=101 (Qj=1.5slpm) Buoyancy-driven rolls Buoyancy-driven rolls
Secondary inertia-driven roll
Buoyancy-driven rolls
Buoyancy-driven rolls
Buoyancy-driven rolls Buoyancy-driven rolls
Secondary inertia-driven roll
Fig.4.3 Side view flow photos taken at the cross plane θ=0∘& 180∘at statistical state for various jet Reynolds numbers at Ra=4400 (△T=3°C) for H=25.0mm. Rej=406 (Qj=6slpm) Jet θ=0° Heating plate θ=180° Rej=338 (Qj=5slpm) Rej=270 (Qj=4slpm) Rej=203 (Qj=3slpm) Rej=135 (Qj=2.0slpm) Rej=101 (Qj=1.5slpm) Buoyancy-driven roll Buoyancy-driven rolls
Secondary inertia-driven roll
Buoyancy-driven rolls
Buoyancy-driven roll Buoyancy-driven rolls
Secondary inertia-driven roll Buoyancy-driven rolls
Fig.4.4 Side view flow photos taken at the cross plane θ=0∘& 180∘at statistical state for various jet Reynolds numbers at Ra=5870 (△T=4°C) for H=25.0mm. Rej=406 (Qj=6slpm) Jet θ=0° Heating plate θ=180° Rej=338 (Qj=5slpm) Rej=270 (Qj=4slpm) Rej=203 (Qj=3slpm) Rej=135 (Qj=2.0slpm) Rej=101 (Qj=1.5slpm) Buoyancy-driven roll Buoyancy-driven rolls
Secondary inertia-driven roll
Buoyancy-driven rolls
Buoyancy-driven rolls Buoyancy-driven rolls
Buoyancy-driven rolls
Fig.4.5 Side view flow photos taken at the cross plane θ=0∘& 180∘at statistical state for various jet Reynolds numbers at Ra=7340 (△T=5°C) for H=25.0mm. Rej=406 (Qj=6slpm) Jet θ=0° Heating plate θ=180° Rej=338 (Qj=5slpm) Rej=270 (Qj=4slpm) Rej=203 (Qj=3slpm) Rej=135 (Qj=2.0slpm) Rej=101 (Qj=1.5slpm) Buoyancy-driven roll Buoyancy-driven roll
Secondary inertia-driven roll
Buoyancy-driven roll
Buoyancy-driven roll
Buoyancy-driven roll
Buoyancy-driven
(a) (b)
(c) (d)
(e) (f) Fig.4.6 Top view flow photos taken at midheight of the test section with Ra=2,940 (ΔT=2 )℃ &
(a) (b)
(c) (d)
(e) (f)
Fig.4.7 Top view flow photos taken at midheight of the test section with Ra=4,400 (ΔT=3 )℃ & H=25.0 mm for Rej= (a)101, (b) 135, (c) 203, (d) 270, (e) 338, and (f)406.
40
(a) (b)
(c) (d)
(e) (f)
Fig.4.8 Top view flow photos taken at midheight of the test section with Ra=5,870 (ΔT=4 )℃ & H=25.0mm for Rej= (a)101, (b) 135, (c) 203, (d) 270, (e) 338, and (f)406.