Hydraulic model studies for sediment
sluicing and flood diversion engineering of
Shihmen reservoir
Po-Han Wu, Ching-Hsien Wu, Chun-Shen Chen, and Chun-Hung Chen
Abstract
Shihmen Reservoir is a multi-objective reservoir, but it was original designed without any silt-sluicing facility in 1963. Through years of operation the reservoir has experienced severe siltation. In order to maintain the capability and stability of water supply, it has become imperative issue that how to reduce sediments and extend the life of the reservoir.
A flood diversion and desilting tunnel could reduce above problems and four possible tunnel routes were considered. Route A and B are located in the upstream of reservoir, Route C and D were located in the submerged area that sediment transportation is complex and need further observation and study.
In order to find out the best project, the proposed engineering project A2, C with extending pipe, C1 and D2 are chosen as feasible candidates of this physical model study.
The physical model study is based on the preliminary study of Shihmen Reservoir flood diversion and desilting engineering project. The main tasks of this study including model setup, model calibration and verification, evaluation of the proposed Project, and establishment the rating curve of flow discharge and sediment concentration hydrograph at inlet for the Shihmen Reservoir flood diversion and desilting operation.
Keywords: Shihmen Reservoir, flood diversion and desilting tunnel, physical model study.
1 Introduction
Shihmen Reservoir is located at northern part of Taiwan (Fig.1). It provides irrigation in Taoyuan, flood control for the Taipei Basin, and hydroelectricity and domestic water supply for more than three million people in northern Taiwan. Through years of operation the reservoir has experienced severe siltation. The capacity decreases from 3.09×10⁸m3 to 2.02×10⁸m3. This has affected water supply capability of the reservoir.
The frequency of heavy rain has increased by extreme hydrological events of climate change. Therefore, it has become imperative to develop measures to enhance silt-sluicing and flood-discharge capabilities of the reservoir. Water Resources Planning Institute, Water Resources Agency, Ministry of Economic Affairs (WRPI) has proposed
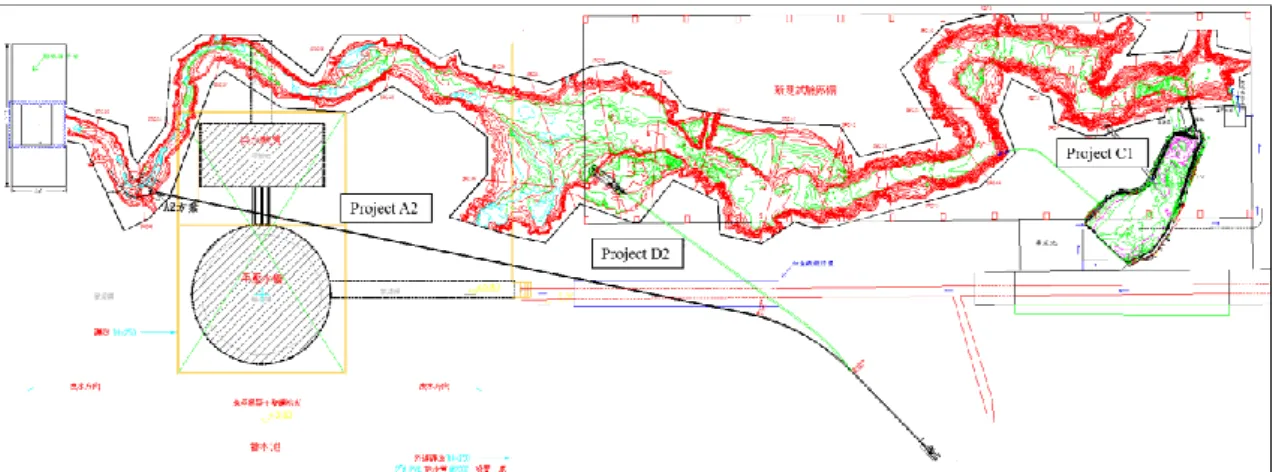
the " Preliminary study for sediment sluicing and flood diversion engineering of Shihman Reservoir-Preliminary report " to develop flood diversion and desiltation strategies in Shihmen Reservoir, includes reduction of silt in the upstream, sluicing in the reservoir, and dredging in the downstream. Seven sediment bypass tunnel plans namely, A1, A2, B, C1, C2, D1 and D2 (Fig.2) were proposed to reduce sediment deposition in shihmen reservoir.
After the preliminary project planning was reviewed and evaluated by experts and academics, the following feasible schemes were proposed: (1) Xikoutai sediment bypass tunnel (Project A1 and Project A2): from the suspension bridge near the water inlet installation through 8.1 km and 8.6 km tunnels respectively to No. 10 sedimentation tank after energy dissipation, then proceeding to Dahan Creek, and a planned discharge of 1,600 m3/s. (2) Amuping sediment bypass tunnel (Project D2 ): water inlet installation 4.2 kilometer-tunnel discharge to No. 10 sedimentation tank after energy dissipation into Dahan Creek and a planned discharge of 1,600 m3/s. (3) Dawaping sediment bypass tunnel (Project C1): inlet installation at the Great Bay Ping, discharging to a rear pool through a 1 km tunnel, and a planned discharge of 1,200 m3/s. It was aimed at developing a preliminary flood diversion, desilting system and engineering planning for desilting in the midstream of the reservoir, as well as feasible strategies after evaluation for Project A2, Project C1 and Project D2. Based on the analysis of factors such as tunnel entrance, along the route, topography, geomorphology, geology, length and influence of downstream water intake, hydraulic model test were carried out according to the three above mentioned schemes.
Fig.1: Watershed area of Shihmen reservoir in Taiwan
Source : Frederick N.-F. Chou, Chia-Wen Wu (2015). Stage wise optimizing operating rules for flood control in a multi-purpose reservoir.
Fig.2: Road map for preliminary planning of sediment sluicing and flood diversion engineering of Shihmen reservoir
2 Physical model study
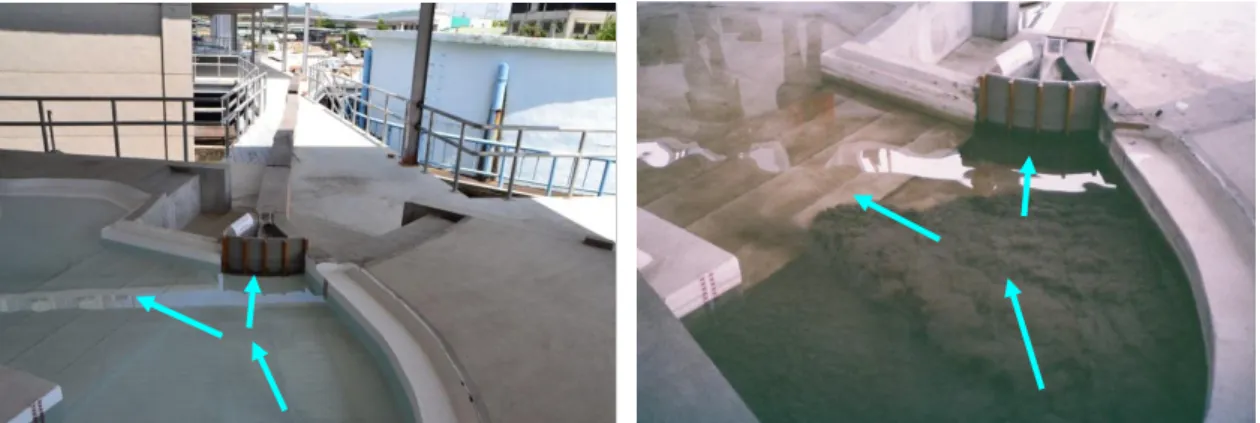
Influencing factors such as purpose of test plan, field research scope, upstream and downstream boundary conditions, hydraulic structure, test site limitation, water supply capacity, model sand, planning funds, etc. are considered in the model design. The physical model study of Shihmen reservoir was conducted by using a 1/100 undistorted scale model (Fig.3). It covered 15.5 km longitudinal length of the reservoir with its upstream boundary located between reservoir cross section 30 and 31. The model needed a lab space of 120 m by 20 m. The construction site of this hydraulic model is located at Water Resources Planning Institute, Water Resources Agency, Ministry of Economic Affair. The physical model topography was based on the field bathymetrical
survey data. The model was built to study the turbidity current movement from 2007 using hydrological condition of Typhoon Aere in August, 2004. The Froude number similarity was adopted for the model scale ratio, 1/100, of the physical model.
Fig. 3: Plan Layout of Shihmen Reservoir Macrocosm Model(1/100)
The sediment used in the physical model study was taken from those deposited near the powerhouse intake in Shihmen Reservoir. The preparation works were carried out before testing, which included cutting, removing impurities, heating, grinding, crushing and pulverizing, weighing, bagging, handling and numbering. According to the sample size analysis of the power plant’s pressure steel pipe, the medium diameter d50 of the
deposited sediment was 5 μm. Its size distribution is close to those plotted in Fig. 4. This sediment size chosen was based on several primarily tests. From experimental results, the turbidity current moving speed and sediment vertical concentration distribution could be reproduced in the physical model if the sediment concentration is above 35 kilograms per cubic meters (i.e. the concentration limit for flocculation). The sediment concentration during Typhoon Aere was estimated to be 43.8 kilograms per cubic meters on average which is above the flocculation limit.
3 Analysis of Test Results
There are a number of scenarios tested in the physical model with the flow conditions in Typhoon Aere: (a) modified existing facilities, (b) three sediment bypass tunnel scenarios named sediment bypass tunnel Project A2, Project C1, Project C with extending pipe and Project D2. A description of each scenario is described below.
3.1 Modified existing facilities in the reservoir
The modified existing condition scenario corresponded to modifications of several outlets to increase the sediment sluicing capacity during typhoon events. The powerhouse penstock modification was a major project work to improve the sluicing capacity. The simulation test of Typhoon Aere helped improve the simulation reservoir facilities’ desiltation function, with 695 million cubic meters of accumulated inflow water volume, 697 million cubic meters of outflow water volume and total inflow sediment amount was 29.63 million tons. From the start of the test to the power plant gate closed, accumulated outflow water volume of 93 million cubic meters passed through the power plant, flood discharge ratio (outflow water volume / accumulated inflow water volume x100%) of 13.4%, sediment sluicing amount of 8.58 million tons, power plant sediment sluicing ratio of 28.9%, average sediment concentration of 92.3 kg/m3, and peak sediment concentration is up to 166.8 kg/ m3. With more than 13.33 million tons of accumulated sediment amount passed through each outlet, total sediment sluicing ratio was 45%. By means of drying method, total sluicing sediment amount in the reservoir was 11.95 million tons and the total sediment sluicing ratio of the reservoir was 39.2%.
3.2 Xikoutai sediment bypass tunnel (Project A2)
The simulation test of Typhoon Aere in Project A2 (Fig.5) had an accumulated inflow water volume of 699 million cubic meters, 714 million cubic meters of outflow water volume and total inflow sediment amount was 29.20 million tons. From start of the test to the power plant gate closed, accumulated outflow water volume of 96 million cubic meters, as well as flood discharge ratio of 13.7%, sediment sluicing amount of 6.67 million tons, power plant sediment sluicing ratio of 22.8%, average sediment concentration of 69.5 kg/m3, and peak sediment concentration up to 130.0 kg/m3. From start of the test to the A2 sediment bypass tunnel gate closed, accumulated outflow water volume of 262 million cubic meters, flood discharge ratio of 37.5%, sediment sluicing amount of 9.18 million tons, sediment sluicing ratio of 31.4%, average sediment concentration of 35.0 kg/m3, and peak sediment concentration up to 45.5 kg/m3. With 20.28 million tons of accumulated sediment amount passed through each outlet of the reservoir, total sediment sluicing ratio was 69.5%. By means of drying method, total sluicing sediment amount in the reservoir was 18.18 million tons and the total sediment sluicing ratio of the reservoir was 62.3%.
Fig. 5: The model of Project A2 and simulation test of Typhoon Aere in Project A2
3.3 Dawanping sediment bypass tunnel (Project C1)
The simulation test of Typhoon Aere in Project C1 had an accumulated inflow water volume of 709 million cubic meters, 749 million cubic meters of outflow water volume and total inflow sediment amount was 29.01 million tons. From start of the test to the power plant gate closed, accumulated outflow water volume of 104 million cubic meters, as well as flood discharge ratio of 14.7%, sediment sluicing amount of 7.67 million tons, and power plant sediment sluicing ratio of 26.4%, The average sediment concentration was 73.8 kg/m3 and reached 140.0 kg/ m3. From start of the test to the C1 sediment bypass tunnel gate closed, accumulated outflow water volume of 341 million cubic meters, flood discharge ratio of 48.1%, sediment sluicing amount of 2.38 million tons, sediment sluicing ratio of 8.2%. The average sediment concentration was 7.0 kg/m3, and peak sediment concentration up to 23.6 kg/m3. With 16.48 million tons of accumulated sediment amount passed through each outlet of the reservoir, total sediment sluicing ratio was 56.8%. By means of drying method, total sluicing sediment amount in the reservoir was 15.98 million tons and the total sediment sluicing ratio of the reservoir was 55.1%.
3.4 Dawanping sediment bypass tunnel (Project C with extending pipe)
The simulation test of Typhoon Aere in Project C (Fig.6) with extending pipe had an accumulated inflow water volume of 684 million cubic meters, 688 million cubic meters of outflow water volume and total inflow sediment amount was 29.01 million tons. From start of the test to the power plant gate closed, accumulated outflow water volume of 7.9 million cubic meters, as well as flood discharge ratio of 11.5%, sediment sluicing amount of 5.45 million tons, and power plant sediment sluicing ratio of 18.8%, The average sediment concentration was 69.0 kg/m3 and reached 106.0 kg/ m3. From start of the test to the C with extending pipe sediment bypass tunnel gate closed, accumulated outflow water volume of 278 million cubic meters, flood discharge ratio of 40.6%, sediment sluicing amount of 9.20 million tons, sediment sluicing ratio of 31.7%, average sediment concentration of 33.1 kg/m3, and peak sediment concentration up to
each outlet of the reservoir, total sediment sluicing ratio was 67.0%. By means of drying method, total sluicing sediment amount in the reservoir was 18.42 million tons and the total sediment sluicing ratio of the reservoir was 63.5%.
Fig. 6: The model of Project C with extending pipe model and simulation test of Typhoon Aere in Project C with extending pipe
3.5 Amping sediment bypass tunnel (Project D2)
The simulation test of Typhoon Aere in Project D2 (Fig.7) had an accumulated inflow water volume of 709 million cubic meters, 716 million cubic meters of outflow water volume and total inflow sediment amount was 29.30 million tons. From start of the test to the power plant gate closed, accumulated outflow water volume of 101 million cubic meters, as well as flood discharge ratio of 14.2%, sediment sluicing amount of 8.43 million tons, and power plant sediment sluicing ratio of 28.8%, The average sediment concentration was 83.5 kg/m3 and reached 140.0 kg/ m3. From start of the test to the D2 sediment bypass tunnel gate closed, accumulated outflow water volume of 275 million cubic meters, flood discharge ratio of 38.8%, sediment sluicing amount of 2.27 million tons, sediment sluicing ratio of 7.7%, average sediment concentration of 8.3 kg/m3, and peak sediment concentration up to 26.9 kg/m3. With 17.36 million tons of accumulated sediment amount passed through each outlet of the reservoir, total sediment sluicing ratio was 59.2%. By means of drying method, total sluicing sediment amount in the reservoir was 16.17 million tons and the total sediment sluicing ratio of the reservoir was 55.2%.
3.6 Comprehensive comparison of flood diversion and desiltation schemes
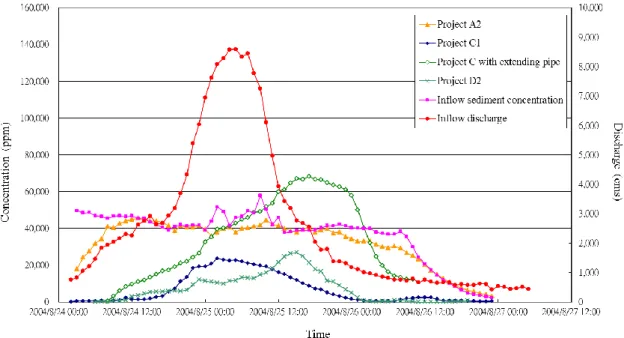
In this experiment, a sediment simulation test of the typhoon Aere was conducted, which included the planning and design of desiltation projects (A, C and D), in order to select a more feasible sediment testing scheme for typhoon Aere. Project C with extending pipe layout testing was also added, with test results shown in Tab. 1 and relationship of sediment concentration vs. time among flood diversion and desiltation schemes shown in Fig. 8. We made a comparison of average sediment concentration in each scheme are as follows: Project A2 (35.0 kg/ m3) > Project C with extending pipe (33.1 kg/ m3) > Project D2 (8.3%) > Project C1 case (7.0 kg/ m3),total sediment sluicing ratio: Project C with extending pipe (63.5 %) > Project A2 (62.3%) > Project D2 (55.2%) > Project C1 (55.1%), based on the sequence and size of the reservoir’s total sediment flush (million tons): Project C with extending pipe (1,842) > Project A2 (1, 818) > Project D2 (1,617) > Project C1 (1,598).
Tab. 1: Test results of the preliminary flood diversion and desiltation schemes for typhoon Aere
Project A2 Project C1 Project C with
extend pipe Project D
Total Discharge ( 108 m3 ) 2.62 3.41 2.78 2.75
Discharge Ratio 37.5% 48.1% 40.6% 38.8% Sediment Sluicing amount (104 Ton) 918 238 920 227
Sediment Sluicing Ratio 31.4% 8.2% 31.7% 7.7% Average Sediment Concentration
(kg/m3)
35.0 7.0 33.1 8.3
Peak Sediment Concentration (kg/m3)
45.5 23.6 68.2 26.9 Total Sediment Sluicing amount
(104 Ton)
1,818 1,598 1,842 1,617
Total Sediment Sluicing Ratio 62.3% 55.1% 63.5% 55.2%
4 Conclusions
To deal with serious sedimentation in Shihmen reservoir, a flood diversion and desilting tunnel were considered and seven sediment bypass tunnel projects namely, A1, A2, B, C1, C2, D1 and D2 (Fig.2) were proposed to reduce sediment deposition in shihmen reservoir. Based on the analysis of factors such as tunnel entrance, along the route, topography, geomorphology, geology, length and influence of downstream water intake, hydraulic model test were carried out according to Project A2, Project C1, Project C with extending pipe and Project D2.
In the case of the test simulation of Typhoon Aere, the sediment sluicing ratio of modified existing facilities was 39.2%, Project A2 was 62.3%, Project C with extending pipe was 63.5%, Project D2 was 55.2% and Project C1 was 55.1%. Above test results, Project C with extending pipe and Project A2 were better. But its construction were costly with the tunnel lengths of 8.1 km in Project A2. Therefore, Project C with extending pipe and Project D2 have been considered as two effective strategies for sediment releasing in Shihmen reservoir.
The physical model results were being used to assist the planning and design of the sediment bypass tunnels. In design stage, Project C with extending pipe mainly releases venting turbidity current, and Project D2 maintained the original D plan route, adjusted the intake type and tunnel section, and set up erosion pool at outlet which called the adjusted D plan of Amuping tunnel . It was constructed in 2018 and estimated to completed in 2021.
References
Frederick N.-F. Chou, Chia-Wen Wu (2015). Stage wise optimizing operating rules for flood control in a multi-purpose reservoir. Journal of Hydrology, 521, 245-260
Jihn-Sung Lai, Fong-Zuo Lee, Ching-Hsien Wu, Yih-Chi Tan, Tetsuya Sumi (2015). Sediment bypass tunnels of the Shihmen Reservoir in Taiwan, First International Workshop on Sediment Bypass Tunnels. , April 27-29, 2015, ETH Zurich, Switzerland.
Jihn-Sung Lai (2017). Sediment bypass tunnels of the Shihmen Reservoir in Taiwan, 2nd International Workshop on Sediment Bypass Tunnels. , May 9-12, 2017, Kyoto, Japan.
Yong G Lai, Kuo-wei Wu (2018). A numerical modeling study of sediment bypass tunnels at shihmen reservoir, Taiwan. International Journal of Hydrology, 2018;2(1):72‒81
Water Resources Planning Institute, WRA, MOEA (2010). Preliminary study for sediment sluicing and flood diversion engineering of Shihman Reservoir-Preliminary report.
Water Resources Planning Institute, WRA, MOEA (2011). Feasibility Study of Dawanping Desilting Tunnel Project in Shihmen Reservoir Summary Report.
Water Resources Planning Institute, WRA, MOEA (2012). Hydraulic model studies for sediment sluicing and flood diversion engineering of Shihman reservoir
Authors (Text style: Authors Address)
Po-Han Wu (corresponding Author) Ching-Hsien Wu
Chun-Shen Chen Chun-Hung Chen
Water Resources Planning Institute, Water Resources Agency, Ministry of Economic Affairs.
Email: joke1125@wrap.gov.tw