doi:10.1111/jfb.12605, available online at wileyonlinelibrary.com
Vertical habitat shift of viviparous and oviparous deep-sea
cusk eels revealed by otolith microstructure and
stable-isotope composition
N. N. Chang*, E. Y. Liu*, Y. C. Liao† and J. C. Shiao*‡ *Institute of Oceanography, National Taiwan University, 1, Sec. 4, Roosevelt Rd, Taipei, Taiwan, Republic of China and †National Museum of Marine Science and Technology, No.
367, Pei-Ning Rd., Zhongzheng Dist., Keelung City, Taiwan, Republic of China
(Received 22 July 2014, Accepted 12 November 2014)
Otolith stable-oxygen-isotope composition and microstructure were analysed in order to investigate the vertical habitat shift of deep-sea cusk eels (Ophidiiformes). Otolith𝛿18O profiles suggested that both
viviparous blind cusk eels and oviparous cusk eels experienced a pelagic larval stage and then settled to the deep-sea floor over a vertical distance that ranged among individuals from 200 to>1000 m. This result shows that the larvae of viviparous Barathronus maculatus undertake an ontogenetic vertical migration after a period of larval drift that may facilitate their wide distribution on the sea floor.
© 2015 The Fisheries Society of the British Isles
Key words: Barathronus maculatus; ontogenetic vertical migration; Ophidiidae; oxygen isotope; vertical distribution.
Distributions of benthic deep-sea fishes on the sea floor are dependent on their repro-ductive strategies and ontogenetic vertical migration during their early life stages. Ophidiiformes (cusk eels) are common in deep-sea environments and have different reproductive strategies (e.g. oviparous and viviparous) among families. Most ophidiids are oviparous and the larval fishes are hatched in the pelagic zone (Fahay, 1992), yet fishes belonging to the Aphyonidae (blind cusk eels) and Bythitidae give birth to young fishes directly (Nielsen et al., 1999). Larval and juvenile viviparous cusk eels are believed to inhabit adult living depths and undertake little vertical migration throughout their life (Nielsen et al., 1999). A juvenile Barathronus pacificus Nielsen & Eagle 1974 of 41⋅8 mm total length, LT, was collected from waters shallower than 260 m in the Tasman Sea (Okiyama & Kato, 1997). The adults, however, generally inhabit depths from 3334 to 3860 m. This finding implies a possible pelagic larval stage for aphyonids, particularly those of the genus Barathronus, but the data were still insufficient to verify the migratory life history of deep-sea cusk eels.
The otolith stable-oxygen-isotope composition coupled with microstructure analysis can reconstruct the historical residence depths of fishes. The microstructures of otoliths
‡Author to whom correspondence should be addressed. Tel.: +886 2 33663227; email: jcshiao@ntu.edu.tw
Family; species Code Depth
(m) Date Station Location
M (g) LT (cm) Ophidiidae (oviparous) Dicrolene tristis DT1 673 November 2012 SWT1 22∘ 23′N; 120∘ 70′E 22 16⋅7 DT2 673 November 2012 SWT1 16 15⋅4 Monomito-pus pallidus MP1 850 November 2012 SWT2 22∘ 14′N; 120∘ 16′E 60 21⋅9 MP2 850 November 2012 SWT2 75 22⋅1 MP3 673 November 2012 SWT1 22∘ 23′N; 120∘ 70′E 39 18⋅9 M. kumae MK1 850 November 2012 SWT2 22∘ 14′N; 120∘ 16′E 62 21⋅7 MK2 850 November 2012 SWT2 32 19⋅2 MK3 850 November 2012 SWT2 6 11⋅2 Aphyonidae (viviparous) Barathronus maculatus BM1 1228 June 2005 NET1 24∘ 24′N; 122∘ 13′E 95 21⋅3 BM2 1224 June 2005 NET1 24∘ 23′N; 122∘ 14′E 57 20⋅1 BM3 1440 March 2008 P1 13∘ 34′N; 120∘ 48′E – –
LT, total length; M, mass.
can reveal important life-history events, such as hatching, settlement and metamorpho-sis (Hislop et al., 2001; Plaza et al., 2001; Hirakawa et al., 2007). Moreover, otolith chemical composition such as otolith 𝛿18O (𝛿18O
oto), which is in equilibrium with
ambient water and affected by salinity, temperature and water𝛿18O (𝛿18O
w) values
(Kalish, 1991; Campana, 1999) records a time series of environmental signals. Previ-ous studies demonstrated linearly negative correlations between𝛿18O
otoand ambient
water temperature (Grossman & Ku, 1986; Høie et al., 2004). Thus, they can be used to track fish movement along a temperature gradient, e.g. depth (Shephard et al., 2007). The goal of this study was to uncover the residence depths of both oviparous and viviparous cusk eels and reconstruct their habitat use throughout their life history. For investigating residence depths of cusk eels with different reproductive strate-gies, three species belonging to the oviparous Ophidiidae: Dicrolene tristis Smith & Radcliffe 1913 (n = 2), Monomitopus pallidus Smith & Radcliffe 1913 (n = 3) and
Monomitopus kumae Jordan & Hubbs 1925 (n = 3), and one species of viviparous
Aphyonidae: Barathronus maculatus Shcherbachev 1976 (n = 3) were collected from deep-sea areas around Taiwan and the Philippines (Table I and Fig. 1). Most fish samples were collected on the R.V. Ocean Researcher I with a bottom beam trawl but three alcohol-preserved B. maculatus (BM1, BM2 and BM3) were provided by the Biodiversity Research Museum, Academia Sinica, Taiwan.
The sagittal otoliths of these fishes were extracted and ground along the sagittal plane until the primordium was exposed. Sub-samples (c. 40 μg) of otolith pow-ders were collected sequentially from the edge to the core with intervals of c. 55–160 μm using a micromill (ESI; http://www.esi.com/) [see Lin et al. (2012) for the sampling details]. The tip of the drill was c. 200 μm in diameter (H23RS, Comet; www.kometdental.de) and the drilling depth was set at 50 μm. The milled powders
24°
SWT1
NET1
SWT2
SWT3
NET2
21°
18°
15°
116°
118°
P1
120°
122°
124°
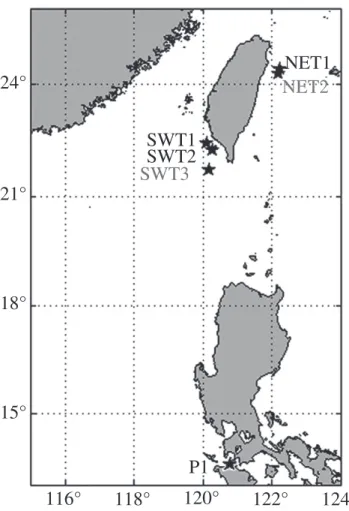
Fig. 1. The cusk eels (Ophidiiformes) were collected around Taiwan (NET1, SWT1-2) and the Philippines (P1). Hydrographical data were measured at NET2 and SWT3.
were allowed to react with pure orthophosphoric acid at 70∘ C in an automated online system (Kiel Carbonate IV; www.thermoscientific.com) to evolve CO2 gas that was further analysed by a mass spectrometer (Finnigan MAT 253; Thermo Electron Cor-poration; www.thermoscientific.com) for oxygen isotopic composition. The long-term reproducibility of the Finnigan MAT 253 is better than ±0⋅08‰ for 𝛿18O (one s.d.)
based on replicate measurements of NBS19 (c. 40 μg) during the experimental period.
𝛿18O
oto values (‰) were reported in standard notation as the following, compared to
Vienna Pee Dee Belemnite (VPDB) standards through calibration against the NBS19 standard:𝛿 = [(Rsample/Rstandard−1)] × 1000 (‰), where R is the ratio of18O:16O for the sample and the standard.
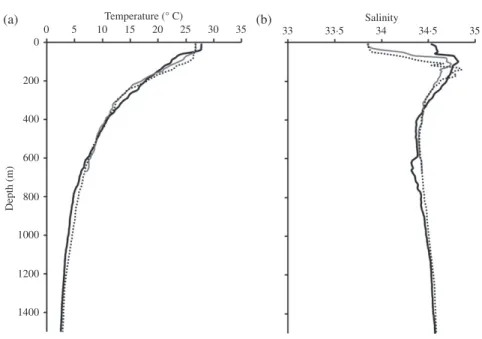
Water temperature [Fig. 2(a)] and 𝛿18Ow [Fig. 3(a)] values were used to predict
𝛿18O
oto[Fig. 3(b)] based on the modified equation from Kim & O’Neil (1997) which
is enriched by 0⋅6‰ in aragonite relative to calcite at 25∘ C (Grossman & Ku, 1986):
𝛿18O
oto−𝛿18Ow= 3⋅71 − 0⋅206T, where 𝛿18Ooto and 𝛿18Ow are the otolith 𝛿18O
200 400 Depth ( m ) 600 800 1000 1200 1400
Fig. 2. Hydrological data (a) temperature and (b) salinity measured in situ [ NET2 ( ), SWT2 ( ) and SWT3 ( ); see Fig. 1] with a SeaBird conductivity–temperature–depth recorder (www.seabird.com). Measure-ments at NET2 and SWT3 were used to calculate the𝛿18Ow and𝛿18Ootoat the sites NET1 and SWT1,
respectively.
ocean water), respectively, and T is the water temperature (∘ C). The𝛿18O
w values
(VSMOW) were derived from the measured salinity (S) [Fig. 2(b)] via the following equation built with data from the Luzon Strait (Lin, 2000):𝛿18O
w= − 13⋅2 + 0⋅39S.
The 𝛿18O
w values of CO2 (VSMOW scale) were converted to the VPDB scale.
According to Friedman & O’Neil (1977), the fractionation of this conversion equalled 1⋅00022 and the 𝛿18O value of CO
2 produced by acid reaction with VPDB calcite is
innately higher than the CO2 equilibrated with VSMOW water by 0⋅22‰. Thus, the conversion equation can be shown as:𝛿18O
wVSMOW= 1⋅00022𝛿18OwVPDB+ 0⋅22, i.e.
𝛿18O
wVPDB= 0⋅99978𝛿18OwVSMOW− 0⋅22. Accordingly, the residence depth of the
fish can be estimated from the measured𝛿18O
oto value based on the profile of depth
(inferred from temperature) and predicted 𝛿18O
oto [Fig. 3(b)]. The precision of the
estimated temperature by𝛿18O
otowas c. ±1∘ C for single otolith analysis.
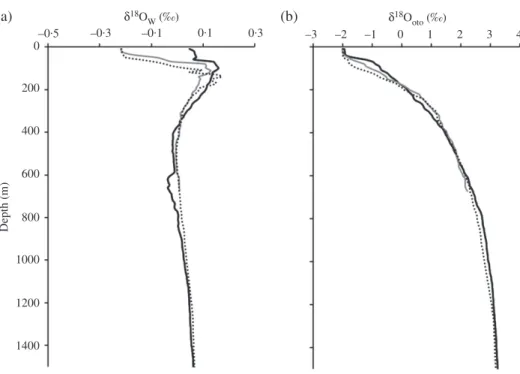
From the sea surface to 200 m depth, water temperatures decreased by 8⋅4–16⋅2∘ C [Fig. 2(a)],𝛿18Owvalues increased from −0⋅4 to −0⋅2‰ to 0⋅05 to 0⋅11‰ [Fig. 3(a)] and the predicted 𝛿18Ooto values increased by 2⋅13 to 3⋅62‰ [Fig. 3(b)] among sampling sites. At depths between 200 and 1500 m, 𝛿18Ow values changed within a very narrow range [Fig. 3(a)], but temperature decreased by c. 15∘ C [Fig. 2(a)], resulting in a predicted𝛿18Ootoincrease of c. 3⋅1‰ [Fig. 3(b)]. 𝛿18Ootovalues mainly reflected the variations in water temperature. A 1‰ raise in𝛿18Ootovalues generally represents about a 4⋅8∘ C decrease in water temperature.
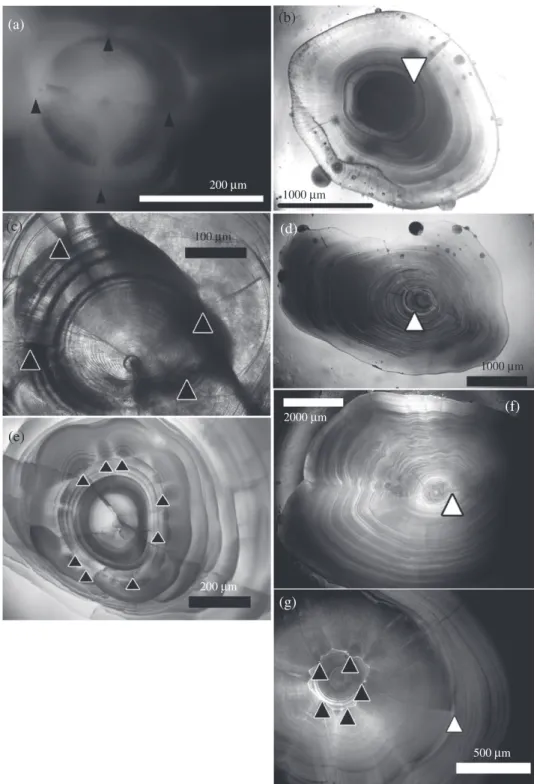
Accessory growth centres (AGC), which are reported to be related to habitat changes (Morioka et al., 2001) or larval metamorphosis, existed in all examined cusk eels (Fig. 4). The mean ± s.d. distance from the AGC to otolith core was smaller for
200 0 –0·5 –3 –2 –1 0 1 2 3 4 δ18O oto (‰) δ18O W (‰) –0·3 –0·1 0·1 0·3 400 Depth ( m ) 600 800 1000 1200 1400 (a) (b)
Fig. 3. Vertical profile of (a) sea water oxygen isotope ratios (𝛿18O
w) estimated from (b) salinity and otolith
oxygen isotope ratios (𝛿18O
oto) predicted from water temperature and𝛿18Ow[NET2 ( ), SWT2 ( )
and SWT3 ( ); see Fig. 1]. Both𝛿18O
wand𝛿18Ootoare in the Vienna Pee Dee Belemnite (VPDB) scale.
B. maculatus (88⋅1 ± 18⋅4 μm) than for M. pallidus (168⋅8 ± 7⋅9 μm), M. kumae
(164⋅0 ± 23⋅7 μm) and D. tristis (149⋅7 ± 12⋅7 μm), yet there was no significant dif-ference among these three species (P> 0⋅05, 𝜒2= 6⋅98; Kruskal–Wallis test). This
may imply an earlier habitat change for the viviparous B. maculatus. The mean ± s.d. number of increments between core and the AGC was highest for D. tristis (21⋅0 ± 2⋅6) and lower for B. maculatus (19⋅3 ± 1⋅5) and M. pallidus (17⋅6 ± 2⋅3). The width of growth increments sharply decreased from the AGCs to the first translucent zone (TZ; Fig. 4). The distance between first TZ and core varied in the range of 237–986 μm and it was significantly smaller for D. tristis than for other species (P< 0⋅01, 𝜒2= 5⋅94;
Kruskal–Wallis test). The first TZ commonly occurs in the otolith of fishes with a pelagic larval stage (Wilson & McCormick, 1999) and may be deposited during bottom settlement, such as for the greater fork-beard Phycis blennoides (Brünnich 1768) (Casas & Piñeiro, 2000), greeneye Chlorophthalmus albatrossis Jordan & Starks 1904 (Hirakawa et al., 2007) and some grenadiers (Macrouronidae) (Lin et al., 2012).
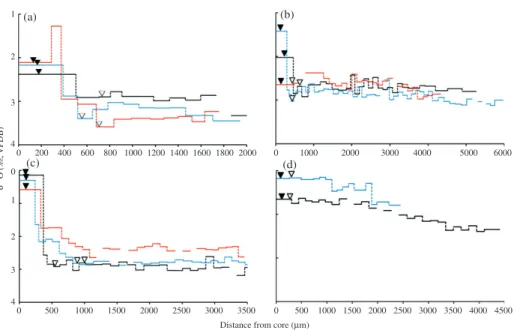
The𝛿18O
otovalues rapidly increased from the core to the first TZ and then remained
steady (variation <0⋅5‰) beyond the first TZ in B. maculatus, M. pallidus and M.
kumae.𝛿18O
otovalues for B. maculatus generally increased from 2⋅11 to 2⋅38‰ at the
core region to 2⋅99 to 3⋅59‰ near the first TZ [Fig. 5(a)], corresponding to a depth shift from 560 to 690 m to 1050 to 1500 m. Only the individual BM3 exhibited a great drop in 𝛿18Ootovalues to 1⋅28‰ at around 300–400 μm prior to the subsequent increase. This may reflect a rapid shift in habitat from the adult living depth to shallower water
(a) (d) (f) (g) (c) (e) 200 μm 2000 μm 200 μm 500 μm 1000 μm 1000 μm 100 μm
Fig. 4. Otolith microstructure of accessory growth centres ( ) and the first translucent zone ( ). (a, b)
1 (a) (b) (c) (d) 2 3 4 0 1 2 3 4 0 0 500 1000 1500 2000 2500 3000 500 1000 1500 2000 2500 Distance from core (μm)
3000 3500 3500 4000 4500 0 0 1000 2000 3000 4000 5000 6000 200 400 600 800 1000 1200 1400 1600 1800 2000 δ 1 8O ( ‰ , VP DB) Fig. 5. The𝛿18O
oto Vienna Pee Dee Belemnite (VPDB) profiles of the cusk eels: (a) Barathronus maculatus
[three fish: BM1 ( ), BM2 ( ) and BM3 ( )], (b) Monomitopus pallidus[three fish: MP1 ( ), MP2 ( ) and MP3 ( )], (c) Monomitopus kumae [three fish: MK1 ( ), MK2 ( ) and MK3 ( )] and (d) Dicrolene tristis[two fish: DT1 ( ) and DT2 ( )]. The positions of accessory growth centres ( ) and the first translucent zone ( ) are indicated
column during the early life stage. For M. pallidus,𝛿18O
otovalues increased from 1⋅30
to 2⋅48‰ at the core to 2⋅45 to 2⋅85‰ at the first TZ [Fig. 5(b)], representing a depth shift from c. 360 to 550 m in the larval stage to near 1100 m during the benthic stage.
𝛿18O
otovalues of M. kumae dramatically increased from 0⋅14 to 0⋅58‰ to a plateau of
2⋅21–2⋅86‰ [Fig. 5(c)], indicating a depth shift from 210 to 240 m to 850 to 1030 m. The𝛿18O
oto values of D. tristis, however, showed little change between the core and
the adjoining first TZ. Instead, 𝛿18O
oto values of D. tristis gradually increased from
1300 μm to the otolith edge [Fig. 5(d)] and the estimated depths only changed slightly from c. 260 to 320 m in the larval stage to 480 to 690 m at the benthic stage. The major peak of𝛿18O
otovalues at the first TZ confirmed that the first TZ was deposited at the
settlement of the cusk eels, except for D. tristis.
The otolith is a three-dimensional structure with fast growth along the anterior-posterior axis and slow accretion along the distal-proximal direction (Shiao et al., 2005). Each sub-sample collected by the micromill contained CaCO3across many lay-ers of the otolith, representing different accreting periods. Thus, the shift in𝛿18O
oto
val-ues (and in depth) might be obscured and the highest and lowest signals might be diluted by the integrated powders (Hanson et al., 2010). Compared with the conventional drilling method, secondary ion mass spectrometry (SIMS) can provide higher temporal and spatial resolution due to the small ion-beam size. Shiao et al. (2014) analysed the
𝛿18O
otoprofile for one B. maculatus by SIMS and found a dramatic increase in𝛿18Ooto
between 642 and 830 μm from the core, indicating a rapid habitat shift from the pelagic to the benthic environment. This transient change was too brief to be detected by the
values shown in Fig. 3(b). In contrast, the measured𝛿18O
otopeaks (2⋅99–3⋅59‰) for
B. maculatus by IRMS in this study were consistent with the predicted values.
In conclusion, these results suggest that both oviparous ophidiids and viviparous B.
maculatus undertook a habitat shift from a shallower habitat to the deep-sea floor with
the migratory distance differing among ontogenetic stages. A pelagic early life stage might facilitate the wide dispersal of pelagic larvae via current drift and consequently of adults on the deep-sea floor.
We thank Wang Pei-Ling and Taiwan MOST Geochemical Services Platform for assisting in isotope analysis, and B. Jessop for useful suggestions to this manuscript. This research was funded by the Ministry of Science and Technology of Taiwan (MOST 103-2611-M-002-001).
References
Campana, S. E. (1999). Chemistry and composition of fish otoliths: pathways, mechanisms and applications. Marine Ecology Progress Series 188, 263–297.
Casas, J. M. & Piñeiro, C. (2000). Growth and age estimation of greater fork-beard (Phycis blennoides Brünnich 1768) in the north and northwest of the Iberian Peninsula (ICES Division VIIIc and IXa). Fisheries Research 47, 19–25.
Fahay, M. P. (1992). Development and distribution of cusk eel eggs and larvae in the mid-dle Atlantic Bight with a description of Ophidion robinsi n. sp. (Teleostei: Ophidiidae). Copeia 1992, 799–819.
Friedman, I. & O’Neil, J. R. (1977). Compilation of stable isotope fractionation factors of geo-chemical interest. In Data of Geochemistry, 6th edn (Fleischer, M. & Chap, K. K, eds), pp. 1–12. Geological Survey Professional Paper (United States) 440.
Grossman, E. L. & Ku, T. L. (1986). Oxygen and carbon isotope fractionation in biogenic arag-onite: temperature effects. Chemical Geology 59, 59–74.
Hanson, N. N., Wurster, C. M., EIMF & Todd, C. D. (2010). Comparison of secondary ion mass spectrometry and micromilling/continuous flow isotope ratio mass spectrometry tech-niques used to acquire intra-otolith𝛿18O values of wild Atlantic salmon (Salmo salar).
Rapid Communications in Mass Spectrometry 24, 2491–2498.
Hirakawa, N., Suzuki, N., Narimatsu, Y., Saruwatari, T. & Ohno, A. (2007). The spawning and settlement season of Chlorophthalmus albatrossis along the Pacific coast of Japan. Raffles Bulletin of Zoology Supplement 14, 151–154.
Hislop, J. R., Gallego, A., Heath, M. R., Kennedy, F. M., Reeves, S. A. & Wright, P. J. (2001). A synthesis of the early life history of the anglerfish, Lophius piscatorius (Linnaeus 1758) in northern British water. ICES Journal of Marine Science 58, 70–86.
Høie, H., Andersson, C., Folkvord, A. & Karlsen, O. (2004). Precision and accuracy of sta-ble isotope signals in otoliths of pre-reared cod (Gadus morhua) when sampled with a high-resolution micromill. Marine Biology 144, 1039–1049.
Kalish, J. M. (1991).13C and18O isotopic disequilibria in fish otoliths: metabolic and kinetic effects. Marine Ecology Progress Series 75, 191–203.
Kim, S. T. & O’Neil, J. R. (1997). Equilibrium and nonequilibrium oxygen isotope effects in synthetic carbonates. Geochimica et Cosmochimica Acta 61, 3461–3475.
Lin, C. F. (2000). Oxygen isotope compositions of seawaters from the South China Sea and Luzon Strait. MS Thesis, National Sun Yat-sen University, China. Available at http://ndltd.ncl.edu.tw/cgi-bin/gs32/gsweb.cgi?o=dnclcdr&s=id=%22088NSYS527100 5%22.&searchmode=basic/
Lin, H. Y., Shiao, J. C., Chen, Y. G. & Iizuka, Y. (2012). Ontogenetic vertical migration of grenadiers revealed by otolith microstructures and stable isotopic composition. Deep-Sea Research I 61, 123–130.
Morioka, S., Machinandiarena, L. & Villarino, M. F. (2001). Preliminary information on internal structures of otoliths and growth of ling, Genypterus blacodes (Ophidiidae), larvae and
juveniles collected off Argentine. Bulletin of the Japanese Society of Fisheries Oceanog-raphy 65, 59–66.
Nielsen, J. G., Cohen, D. M., Markle, D. F. & Robins, C. R. (1999). FAO Species Catalog, Vol. 18. Ophidiiform fishes of the world (Order Ophidiiformes). An annotated and illus-trated catalogue of pearlfishes, cusk-eels, brotulas and other ophidiiform fishes known to date. FAO Fisheries Synopsis 125.
Okiyama, M. & Kato, H. (1997). A pelagic juvenile of Barathronus pacificus (Ophidiiformes: Aphyonidae) from the Southwest Pacific, with notes on its metamorphosis. Ichthyological Research 44, 222–226.
Plaza, G., Katayama, S. & Omori, M. (2001). Otolith microstructure of the black rockfish Sebastes inermis. Marine Biology 139, 797–805.
Shephard, S., Trueman, C., Rickaby, R. & Rogan, E. (2007). Juvenile life history of NE Atlantic orange roughy from otolith stable isotopes. Deep-Sea Research I 54, 1221–1230. Shiao, J. C., Lin, L. Y., Horng, J. L., Hwang, P. P. & Kaneko, T. (2005). How can teleostean
inner ear hair cells maintain the proper association with the accreting otolith? Journal of Comparative Neurology 488, 331–341.
Shiao, J. C., Itoh, S., Yurimoto, H., Iizuka, Y. & Liao, Y. C. (2014). Oxygen isotopic distribution along the otolith growth axis by secondary ion mass spectrometry: applications for study-ing ontogenetic change in the depth inhabited by deep-sea fishes. Deep-Sea Research I
84,50–58.
Wilson, D. T. & McCormick, M. I. (1999). Microstructure of settlement-marks in the otoliths of tropical reef fishes. Marine Biology 134, 29–41.