Evidence of complete band gap and resonances in a plate with periodic
stubbed surface
Tsung-Tsong Wu,a兲 Zi-Gui Huang, Tzu-Chin Tsai, and Tzung-Chen Wu Institute of Applied Mechanics, National Taiwan University, Taipei 106, Taiwan
共Received 28 May 2008; accepted 26 July 2008; published online 16 September 2008兲
In this paper, we numerically and experimentally demonstrate the existence of complete band gaps and resonances in a plate with a periodic stubbed surface. Numerical results show that a complete band gap forms as the stub height reaches about three times the plate thickness. In the experiment, we used a pulsed laser to generate broadband elastic waves and used optical devices as well as point piezoelectric transducers to detect wave signals. The results show that the numerical predictions are in very good agreement with those measured experimentally. Remarkable resonances on the top surface of the stubs are found and discussed. © 2008 American Institute of Physics. 关DOI:10.1063/1.2970992兴
Formation of phononic crystal band gaps in a system with periodic arrangement of different elastic properties has been investigated extensively for both bulk1,2and surface3–5 waves over the last decade. Increasing attention has been paid to the Lamb6waves due to the coupling of the longitu-dinal and transversal vibrations, which makes the elastic wave propagation in a thin plate more complicated.
Considering phononic crystal structure in plates, Vasseur
et al.7 analyzed the band structure of solid/solid two-dimensional共2D兲 phononic crystal plates using the finite el-ement共FE兲 method. Hsiao et al.8studied experimentally the band structure of steel/epoxy 2D phononic crystal plates and was found to be in good agreement with numerical predic-tions. However, waves propagating in epoxy plates exhibited strong attenuation and were observed by Vasseur et al.9 Re-cently, plates with 2D phononic film on the surface10,11have received much attention. These structures may generate mini-stop-bands, but not enough for forming a complete band gap.
Different from the previous studies, we analyze the dis-persion relation of Lamb waves in a thin plate with stubbed surface both numerically and experimentally using the FE method 共COMSOL MULTIPHYSICS12兲 and the laser ultrasonic technique, respectively. On one side of a thin aluminum13 plate 共thickness h1= 1 mm兲 specimen, periodically stubbed cylinders are arranged in a square lattice with lattice constant
a = 10 mm. The diameter of the cylindrical stubs, which are
also made of aluminum, is 7 mm共i.e., f =0.385, h1/a=0.1兲.
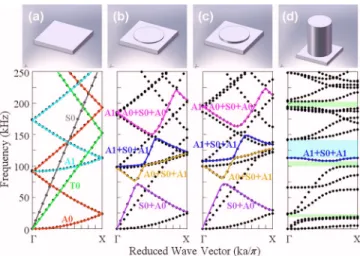
To understand the influence of the stubs’ height共h2兲 on the dispersion, we have conducted a series of numerical cal-culations. Figure1shows the dispersion relations of the thin plate with stubs of different heights for waves propagating along the⌫X direction. Upon comparison with the dispersion relation of a homogeneous thin plate关Fig.1共a兲兴, formation of the special coupling modes can be identified. For example, in Fig. 1共b兲, when the stub height h2= 0.25h1, the purple line
marked with S0 + A0 means the mode is transformed from the S0mode and A0modes shown in Fig.1共a兲. Similarly, the
yellow line marked with A0 + S0 + A1 in Fig.1共b兲denotes the mode is transformed from the A0, S0, and A1 modes. The
evolution of the coupling modes as well as formation of level repulsions14can be identified by comparing Figs.1共a兲–1共c兲. In the numerical study, we increase the height of the stubs from one quarter of the plate thickness 共with plate thickness denoted as h1兲 gradually up to 10h1. As the height
of stubs increase, some resonances are formed, which result in slower wave velocity and flatter modes15near the edge of the Brillouin zone. We find that as the stub height approaches about triple the plate thickness, i.e., 3h1, a narrow complete
band gap ranging from 167.5 to 171 kHz forms. Moreover, when the stub height equals 9h1, the complete band gap is the largest, with a range from 119 to 157.5 kHz and a relative band gap width equal to 0.278. When the stub height is ten times the thickness of the plate, i.e., 10h1, a secondary large
complete band gap appeared, ranging from 119 to 143 kHz 共blue region兲, and three partial band gaps 共green region兲 also appeared, as shown in Fig.1共d兲and Fig.2.
On the experimental side, we have conducted a series of laser ultrasonic experiments to demonstrate the complete band gap and resonances of the phononic thin plate. The experimental schematic diagram is shown in Fig. 3. The phononic plate with a periodic stubbed surface consisted of
a兲Author to whom correspondence should be addressed. Electronic mail:
FIG. 1. 共Color online兲 Dispersion relations of the phononic thin plate with stubs of differing height along ⌫X direction: 共a兲 flat thin plate, 共b兲 stub height h2= 0.25h1,共c兲 stub height h2= 0.5h1, and共d兲 stub height h2= 10h1.
Lattice constant a = 10 mm, plate thickness h1= 1 mm, and diameter of the
cylindrical stub is 7 mm.
APPLIED PHYSICS LETTERS 93, 111902共2008兲
0003-6951/2008/93共11兲/111902/3/$23.00 93, 111902-1 © 2008 American Institute of Physics Downloaded 22 Dec 2008 to 140.112.113.225. Redistribution subject to AIP license or copyright; see http://apl.aip.org/apl/copyright.jsp
16⫻10 stubs on one side of the plate. In the experiments, we utilized an Nd:YAG共yttrium aluminum garnet兲 pulsed laser to generate broadband elastic waves16 and an optical inter-ferometer共with He–Ne laser兲 to measure the normal compo-nent of the displacements four rows apart from the laser source. Both the ⌫X direction and the ⌫M direction were considered. In the measurements, the digitalized rate of the interferometer was 50 MHz.
Shown on the left-hand side of Figs. 4共a兲 and4共b兲 are the measured reference spectra. The reference spectrum is defined as the ratio of the spectrum measured on the phononic thin plate to that measured on a thin flat plate with the same thickness共1 mm兲. The right-hand side of Figs.4共a兲 and 4共b兲 show the computed dispersion relations for waves propagating along the⌫X and ⌫M directions, respectively. In Fig.4共a兲, the blue region shows the location of the complete band gap, from 114 to 145 kHz, which agrees well with the numerical result. The green regions are the partial band gaps along the⌫X direction, indicating conformity to the locations and widths of the band gaps. We note that there are some peaks in the reference spectrum around the band edges. For example, the peak around 109 kHz has a value of 1.46, which means the normal displacement is about one and a half times larger than that of a flat thin plate.
For wave propagating along the ⌫M direction 关Fig. 4共b兲兴, the location and width of the complete band gap also exhibit very good agreement between the numerical and measured results. Figures4共a兲and4共b兲thus confirm experi-mentally the existence of the complete band gap located be-tween 114 and 145 kHz.
To measure both the normal and transverse displacement components, we used point piezoelectric transducers 共the contact point is about 1.5 mm in diameter兲 with different polarizations.17In the measurements along the⌫X direction, the measured point is located at the center of the cylindrical stub and is six rows apart from the pulsed laser source. The
FIG. 3.共Color online兲 Schematic diagrams of the experimental setup. Mea-surements are along the⌫X and ⌫M directions. Source and receiver are four rows apart along the⌫X direction.
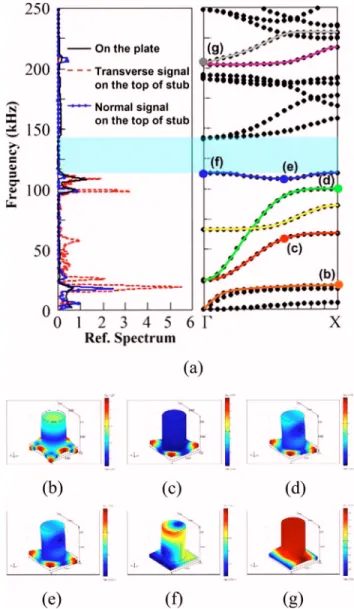
FIG. 5.共Color online兲 共a兲 Reference spectra measured on the top of the stub 共both normal and transverse displacements by using point piezoelectric transducers兲. 共b兲 Eigenmode analysis by FE method, with kxa/= 1, f = 19 kHz, 共c兲 kxa/= 0.6, f = 60 kHz, 共d兲 kxa/= 1, f = 100 kHz, 共e兲 kxa/= 0.6, f = 109 kHz, 共f兲 kxa/= 0, f = 114 kHz, and共g兲 kxa/= 0, f = 205 kHz.
FIG. 2. 共Color online兲 Dispersion relations of the thin plate with a periodic stubbed surface in a square array made of aluminum 6061 with a = 10 mm, h1= 1 mm, h2= 10h1, and d = 7 mm. Complete band gap and partial band
gap along the⌫X direction are shown as the blue region and green region, respectively.
FIG. 4. 共Color online兲 Measured reference spectra 共normal displacement兲 for waves propagating along the共a兲 ⌫X and 共b兲 ⌫M directions, respectively.
111902-2 Wu et al. Appl. Phys. Lett. 93, 111902共2008兲
polarization of the transverse displacement measured is par-allel to the wave propagation.
Figure5共a兲shows the measured reference spectra using both the normally and transversely polarized piezoelectric transducers. The measured results show that the complete band gap is coincident with that in Fig.4共a兲, i.e., from 114 to 145 kHz 共blue region兲. For the transverse displacement 共red dashed line兲, several peaks with values larger than one are found. Figures 5共b兲–5共g兲 show the corresponding eigen-modes of the peak frequencies shown in Fig. 5共a兲. In each figure, the total displacement is normalized by its own maxi-mum value.
The lowest outstanding peak is around 19 kHz, which demonstrates a notably enhanced transverse and normal vi-bration. Figure 5共b兲 shows its corresponding eigenmode, which is derived from the coupling of the S0and A0 modes. For this nearly flat mode at a large wave number, resonance forms by concentrating energy in the stubs and results in a very small group velocity. The second peak, at 25 kHz, cor-responds to the cutoff frequency of the modes marked with red line and green line. The third peak, appearing at 60 kHz 关point 共c兲 in Fig. 5共a兲兴, is governed mainly by the antisym-metric mode 共A1兲, and its eigenmode is shown in Fig.5共c兲.
The fourth peak, appearing around 100 kHz, is related to point共d兲 on the mode marked with a green line in Fig.5共a兲. The corresponding eigenmode, governed mainly by the S0
and A1modes, is shown in Fig.5共d兲. From Fig.5共a兲, we find that the right-hand side of the mode 共green line兲 is nearly flat, which results in a strong vibration in the transverse di-rection.
Adjacent to the peak at 100 kHz, the peak at 109 kHz also results from the mode governed by the S0and A1modes.
As shown in Fig. 5共e兲, a powerful vibration of the plate trembles obviously with the high stubs in the transverse di-rection. We note that the mode around the cutoff frequency on the left-hand side 共blue line兲 is governed by A1 mode
only. As shown in Fig. 5共f兲, this mode generates vanishing transverse displacement on the top surface of the stub.
In the frequency between 143 and 193 kHz, the refer-ence spectrum has a value about 0.15, which means that elastic waves may propagate within this frequency range, but with perceptible attenuation. One may note that there are two nearly flat modes around 190 kHz; nevertheless, they are mainly governed by the T0mode共polarization perpendicular
to the sagittal plane兲 and result in no peak in the measured spectrum.
For frequencies close to 205 kHz, the band structure exhibits two different modes. The mode marked with a purple line is mainly governed by the T0mode and may not
be effectively generated by the laser source. Therefore, the relatively small peak appearing around 205 kHz for normal vibration关Figs.4共a兲and5共a兲兴 is caused by the mode marked with a gray line. The mode is evolved from the A1mode and its eigenmode is shown in Fig. 5共g兲.
In summary, we have demonstrated the existence of the complete band gap and resonances in a plate with a periodic stubbed surface. When the height of the stubs is triple the plate thickness, a complete band gap is formed. Results of the laser ultrasonic experiments clearly show that the com-plete band gap and the resonances of the stubs are in very good agreement with numerical predictions.
The authors gratefully acknowledge the financial support from the National Science Council of Taiwan, Grant No. NSC 96-2221-E-002-206-MY3.
1M. S. Kushwaha, P. Halevi, L. Dobrzynski, and B. Djafari-Rouhani,Phys.
Rev. Lett. 71, 2022共1993兲.
2R. Sainidou, B. Djafari-Rouhani, and J. O. Vasseur, Phys. Rev. B 77,
094304共2008兲.
3Y. Tanaka and S.-I. Tamura,Phys. Rev. B 58, 7958共1998兲.
4F. Meseguer, M. Holgado, D. Caballero, N. Benaches, J. Sánchez-Dehesa,
C. López, and J. Llinares,Phys. Rev. B 59, 12169共1999兲.
5T.-T. Wu, Z.-G. Huang, and S. Lin,Phys. Rev. B 69, 094301共2004兲. 6J.-C. Hsu and T.-T. Wu,Phys. Rev. B 74, 144303共2006兲.
7J. O. Vasseur, P. A. Deymier, B. Djafari-Rouhani, Y. Pennec, and A.-C.
Hladky-Hennion,Phys. Rev. B 77, 085415共2008兲.
8F. Hsiao, A. Khelif, H. Moubchir, A. Choujaa, C. Chen, and V. Laude,
Phys. Rev. E 76, 056601共2007兲.
9J. O. Vasseur, P. A. Deymier, B. Chenni, B. Djafari-Rouhani, L.
Dobrzyn-ski, and D. Prevost,Phys. Rev. Lett. 86, 3012共2001兲.
10B. Bonello, C. Charles, and F. Ganot, Appl. Phys. Lett. 90, 021909
共2007兲.
11B. Morvan, A. Hladky-Hennion, D. Leduc, and J. Izbicli,J. Appl. Phys.
101, 114906共2007兲.
12
COMSOLMultiphysics, Structural Mechanics, Manual, Comsol, AB, Stock-holm, Sweden.
13We use the elastic constants C
11= 11.1, C12= 6.1, C44= 2.5共in units of GPa兲
and= 2695 kg/m3for aluminium 6061.
14T.-T. Wu and Z.-G. Huang,Phys. Rev. B 70, 214304共2004兲.
15G. Wang, X. Wen, J. Wen, L. Shao, and Y. Liu, Phys. Rev. Lett. 93,
154302共2004兲.
16T.-T. Wu and Y.-H. Liu,Ultrasonics 37, 23共1999兲.
17T.-T. Wu and J.-S. Fang,J. Acoust. Soc. Am. 101, 330共1997兲.
111902-3 Wu et al. Appl. Phys. Lett. 93, 111902共2008兲
![TraditionalMLCalgorithmsmainlytacklethebatchMLCproblem,wheretheinputdataarepresentedinabatch[24,28].Nevertheless,inmanyMLCapplicationssuchase-mailcategorization[22],multi-labelexamplesarriveasastream.Onlineanalysisistherefore dimensionreducermotivatedbyma](data:image/gif;base64,R0lGODlhAQABAIAAAP///wAAACH5BAEAAAAALAAAAAABAAEAAAICRAEAOw==)