590 OPTICS LETTERS / Vol. 20, No. 6 / March 15, 1995
Effect of carrier depletion on optical phase conjugation
in a semiconductor laser amplifier
Senfar Wen
Department of Electrical Engineering, Chung-Hua Polytechnic Institute, 30 Tung Shiang, Hsinchu, Taiwan, China
Sien Chi
Institute of Electro-Optical Engineering, National Chiao Tung University, 1001 Ta Hsueh Road, Hsinchu, Taiwan, China
Received October 18, 1994
The temporal effect of optical phase conjugation in a semiconductor laser amplifier is studied numerically. The conjugate pulse has distortion and frequency chirping owing to the carrier depletion induced by the signal pulse. Both the pulse-shape distortion and frequency chirping are enhanced as the signal power and the injection current increase. We can reduce these two effects by increasing the pump power to reduce the carrier-density depletion induced by the signal pulse.
Recent experiments show that chromatic dispersion can be compensated for by optical phase conjugation (OPC).1,2
In Ref. 1 OPC was obtained by nondegen-erate four-wave mixing (NDFWM) in a dispersion-shifted fiber. In Ref. 2 OPC was obtained by NDFWM owing to the nonlinear gain in a semi-conductor laser amplifier (SLA). It has been shown that, by use of dispersion-shifted fiber as a conjuga-tor, there is frequency chirping in the conjugate pulse that is due to the cross-phase modulation between the signal and conjugate pulses.3 This effect limits the
input signal power and hence the output conjugate power. Using a SLA, we will study the distortion and frequency chirping in the conjugate pulse that are due to carrier-density depletion induced by the signal pulse.
An optical wave propagating in the SLA satisfies the equations4 – 6 ≠f ≠z s1y2dGasN 2 N0df1 2 ib 2 s1 2 ibdejfj 2gf 2s1y2daintf , (1) ≠N ≠t I qV 2 N tc 2 a Amhn sN 2 N0ds1 2 ejfj2djfj2. (2) In these equations f is the electric-field envelope (which is normalized so that the optical power P jfj2), N is the carrier density, N
0 is the transparent
carrier density, G is the confinement factor, a is the gain coefficient, b is the linewidth-broadening factor, b relates to the refractive-index change that is due to the nonlinear gain, e is the gain saturation coef-ficient, aint is the internal loss coefficient, I is the
injection current, q is the charge of a carrier, V is the active volume, tc is the carrier lifetime, Am is
the mode cross section, and hn is the photon energy. Two sources of NDFWM are included in Eqs. (1) and (2). One is the carrier-density modulation and is ef-fective for beat frequencies as high as,1ytc.
Typi-cally tc 0.2–0.3 ns for the SLA. The other source
originates from the intraband relaxation process oc-curring on a much shorter time scale, i.e., ti> 0.3 ps.
A complete treatment of this process should use the density matrix approach.5 For simplicity, in Eqs. (1)
and (2) we include the first-order effect of the nonlin-ear compression of the optical gain by a factor ejfj2,
which is responsible for spectral hole burning and highly NDFWM.4 – 6 This model is valid when the
beat frequency is much less than 1yti and the pulse
width is much larger than ti. To show the
phase-conjugate wave generated from the carrier-density and the nonlinear gain effects, we may decompose the field envelope and the carrier density as
f fp1 fs expsiVtd 1 fc exps2iVtd , (3a)
N N 1 DN expsiVtd 1 DNp exps2iVtd , (3b)
where fp is the pump wave with frequency v0, fs
and fc are the signal wave and the conjugate wave
with frequencies v0 2 V and v0 1 V, respectively, N is the slowly varying carrier density, and DN is the fast-varying carrier density, which responds to the angular beat frequency V. Substituting Eqs. (3) into Eqs. (1) and (2) and neglecting the higher-order terms, we have the following equation for the conju-gate wave: ≠fc ≠z 1 2 Gas1 2 ibdsN 2 N0dfc2 1 2 aintfc 2 1 2 Gas1 2 ibdsN 2 N0dg 3 jfpj 2f c1 fp2fps 1 1 gsjfpj21 jfsj21 jfcj2d 2 iVtc 2 1 2 Gas1 2 ibdsN 2 N0d 3 efsjfcj 2 1 2jfsj 2 1 2jfpj 2df c1 fp 2 fpsg , (4)
where g atcyAmhn. On the right-hand side of
Eq. (4) the first term shows the gain from the
March 15, 1995 / Vol. 20, No. 6 / OPTICS LETTERS 591
carrier density, the third and fourth terms show the effects from the carrier-density modulation and nonlinear gain effect, respectively, and the terms with fp2fps are the sources of the OPC. From
Eq. (4) we see that, when the beat frequency is high, the OPC from the carrier-density modula-tion is reduced and the nonlinear gain effect is
the dominant source for OPC. We take the
fol-lowing typical numerical parameters for the SLA: G 0.4, a 2.5 3 10216 cm2
, N0 1 3 1018cm23,
aint 40 cm21, b 6, tc 0.25 ns, amplifier length L 250 mm, region width w 2 mm,
active-region depth d 0.2 mm, V Lwd, and Am wdyG.
For this amplifier structure, e 5.82 W21,5 and
be-cause jbj ,, 1,6 we take b 0.
The signal pulse launched into the SLA is as-sumed to be a Gaussian pulse that has propagated in an 80-km-long standard fiber with a 0.22-dB loss and a 16-psy(km nm) dispersion. The pulse also ex-periences self-phase modulation from the Kerr ef-fect in the fiber, in which the Kerr coefficient is 3.2 3 10220m2yW and the effective fiber cross section
is 50 mm2. The carrier wavelength l
s 1551 nm,
and the pulse’s initial field envelope is assumed to be f1
p
P1 expf2stys1d2g, where P1 and s1 are its
initial peak power and rms pulse width, respectively. We take P1 3 mW and a short pulse width s1
50 psto enhance the pulse broadening. At the end of the fiber the pulse broadens, and its rms pulse width becomes 78 ps. The pulse is then launched into the SLA with peak power P2. The pump wave is a
con-tinuous wave with wavelength lp 1550 nm, and
the pump power in the SLA is Pp. The input field
envelope of the SLA is taken as
f
q
Pp1 f2exps2iVtd , (5)
where f2is the input signal pulse. Before the pump
wave and active medium interact with the signal pulse st 2`d, the carrier density is saturated by the pump wave. We take Eq. (5) and the satura-tion carrier density that can be obtained by setting ≠Ny≠t 0 in Eq. (2) as initial conditions to solve Eqs. (1) and (2).
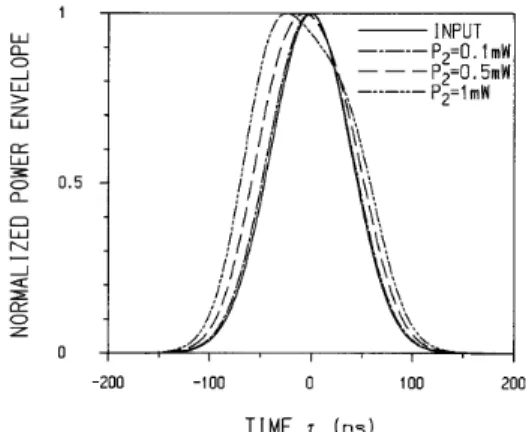
Figure 1 shows the power envelopes of the conju-gate pulses of wavelength lc 1549 nm at the
out-put of the SLA with I 250 mA and Pp 1 mW for P2 0.1, 0.5, and 1 mW. In the figure the power
envelopes are normalized with respect to their peak powers Pcp, and the input signal pulse into the SLA
is also shown for comparison. Pcp 0.0849, 0.261,
and 0.313 mW for P2 0.1, 0.5, and 1 mW,
respec-tively. One can see that, although Pcpincreases with P2, the pulse broadens and distorts asymmetrically as P2 increases. The rms pulse widths of the
out-put conjugate pulses are sc 79.7, 85.8, and 93.0 ps
for P2 0.1, 0.5, and 1 mW, respectively. From
Eq. (4) we can see that, because the gain is pro-portional to sN 2 N0d, the depletion of the slowly
varying carrier density N by the signal pulse is re-sponsible for the pulse-shape distortion. Figure 2 shows the carrier density N in the SLA for the case of P2 1 mW shown in Fig. 1, in which the
fast-varying carrier density DN responds to the beat
frequency Vy2p 125 GHz. One can see that
the carrier density in the leading edge of the conjugate pulse is larger than the carrier density in the trailing edge. Therefore the leading edge of the conjugate pulse experiences more gain than the trailing edge, leading to asymmetrical distortion. Furthermore, the central part of the conjugate pulse experiences less gain than the other parts of the conjugate pulse, leading to pulse broadening. Be-cause the depletion of N increases with the signal
Fig. 1. Normalized power envelopes of the conjugate pulses at the output of the SLA for signal powers P2 0.1, 0.5, and 1 mW. The input power envelope of the signal pulse into the SLA is also shown for comparison.
Fig. 2. Carrier density N in the SLA for the case of signal power P2 1 mW shown in Fig. 1. The corresponding distance z is indicated for each curve.
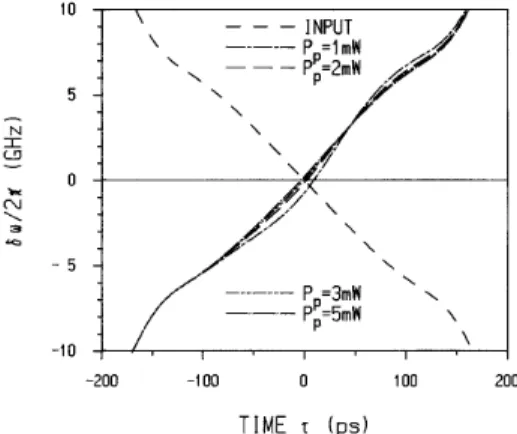
Fig. 3. Corresponding instantaneous frequencies dv of the output conjugate pulses and the input signal pulse shown in Fig. 1.
592 OPTICS LETTERS / Vol. 20, No. 6 / March 15, 1995
Fig. 4. Normalized power envelopes of the conjugate pulses at the output of the SLA for pump powers Pp 1, 2, 3, and 5 mW. The signal power P2 1 mW. The input power envelope of the signal pulse into the SLA is also shown.
Fig. 5. Corresponding instantaneous frequencies dv of the output conjugate pulses and the input signal pulse shown in Fig. 4.
power, the distortion of the conjugate pulse increases with the signal power. Note that the contribution of NDFWM from the carrier-density modulation is
small in these cases. If we assume that e 0,
the output conjugate powers are reduced by ap-proximately a factor of 10. As to the phase of the conjugate pulse, Fig. 3 shows the instantaneous fre-quencies dv for the conjugate pulses shown in Fig. 1,
in which dv 2≠cy≠t, where c is the phase of
the conjugate pulse. For comparison Fig. 3 also shows the dv of the input signal pulse, which is due to chromatic dispersion and self-phase modu-lation in the standard fiber. One can see that the dv of the conjugate pulse is composed of in-verted chirping of the input signal pulse plus some additional frequency chirping. The additional fre-quency chirping comes from the phase modulation by the slowly varying carrier density N . Using the first term on the right-hand side of Eq. (4),
we can write the additional frequency chirping as dvasL, td s1y2dbGa s
L
0 ≠Nsz, tdy≠tdz. Since
the pulse-shape distortion and additional frequency chirping come from the depletion of the carrier density, a higher injection current provides higher gain, but these two effects also increase.
To reduce the pulse-shape distortion and additional frequency chirping of the conjugate pulse, we may use higher pump powers to reduce the carrier-density de-pletion induced by the signal pulse. Figures 4 and 5 show the power envelopes and dv’s of the out-put conjugate pulses, respectively, for P2 1 mW
and several pump powers Pp. One can see that both
the pulse-shape distortion and additional frequency chirping decrease as Pp increases. The rms pulse
widths are sc 86.7, 84.2, and 81.9 ps for Pp 2, 3,
and 5 mW, respectively. However, the output con-jugate power does not necessarily increase with Pp.
At higher pump powers, although more conjugate power may be generated through NDFWM, the gain from the carrier density is compressed by the pump power. Thus there exists an optimal pump power for the maximum output conjugate power. For the case when I 250 mA the optimal pump powers are 0.6, 1.8, and 3.0 mW for P2 0.1, 0.5, and 1 mW,
respectively. The corresponding maximum powers
Pcp 0.0877, 0.280, and 0.422 mW for P2 0.1, 0.5,
and 1 mW, respectively.
In conclusion, the pulse-shape distortion and fre-quency chirping of a conjugate pulse that are due to the carrier-density depletion induced by the sig-nal pulse in a SLA have been demonstrated. Both effects are enhanced as the signal power and the in-jection current increase. It is found that we can re-duce these effects by increasing the pump power to reduce the carrier-density depletion induced by the signal pulse. As the pump power compresses the gain from the carrier density, there exists an opti-mal pump power for the maximum output conjugate power.
This study was supported by the National Science Council of the Republic of China under contract NSC 83-0417-E009-013.
References
1. S. Watanabe, T. Naito, and T. Chikama, IEEE Photon. Technol. Lett. 5, 92 (1993).
2. M. C. Tatham, G. Sherlock, and L. D. Westbrook, Elec-tron. Lett. 29, 1851 (1993).
3. S. Wen, S. Chi, and T.-Z. Chang, Opt. Lett. 19, 939 (1994).
4. T. L. Koch and R. A. Linke, Appl. Phys. Lett. 48, 613 (1986).
5. G. P. Agrawal, J. Opt. Soc. Am. B 5, 147 (1988). 6. K. Kikuchi, M. Kakui, C.-E. Zah, and T.-P. Lee, IEEE