The association of alcohol consumption with metabolic syndrome and its
individual components: the Taichung Community Health Study
Ching-Chu Chen1,2, Wen-Yuan Lin3,4,Chia-Ing Li5, Chiu-Shong Liu3,4, Tsai-Chung Li6,7, Ying-Tzu Chen5,Chuan-Wei Yang5, Man-Ping Chang8,Cheng-Chieh Lin3,4,9,10* 1Division of Endocrinology and Metabolism, Department of Medicine, China Medical
University Hospital, 2Department of Endocrinology and Metabolism, School of Chinese Medicine, College of Chinese Medicine, China Medical University,
3Department of Family Medicine, China Medical University Hospital, 4Department of
Family Medicine, College of Medicine, China Medical University, 5Department of Medical Research,China Medical University Hospital, 6Graduate Institute of
Biostatistics, College of Chinese Medicine, China Medical University, 7Institute of Health Care Administration, College of Health Science, Asia University, 8Department of Nursing, National Taichung Nursing College, 9School and Graduate Institute of Health Care Administration, College of Public Health, China Medical University, 10Institute of Health Care Administration, College of Health Science, Asia University;
Taichung, Taiwan. *
Corresponding author. Department of Family Medicine, China Medical University Hospital, Taichung, Taiwan. No 2, Yuh-Der Road, Taichung 40447, Taiwan. TEL: 886-4-22062121 ext. 7629. Fax 886-4-22335695. E-mail: [email protected]
Abbreviations: HDL-C, high density lipoprotein cholesterol; OR, odds ratios; CI,
Abstract 1
Alcohol has both adverse and protective effects on the individual components of 2
metabolic syndrome (MS). We hypothesize that alcohol consumption increases the 3
risk of developing MS and that the consumption of different types of alcoholic 4
beverages has different effects on the development of MS and its individual 5
components. We enrolled 2358 men for this cross-sectional study. The data were 6
collected from self-reported nutrition and lifestyle questionnaires. Individuals who 7
drank at least once per week for 6 consecutive months were classified as current 8
drinkers. Current drinkers were at a higher risk of developing MS, abdominal obesity, 9
and high triglyceride levels, but they were at a lower risk of developing low HDL-C 10
levels. The increased risk of developing MS, high triglyceride, and high fasting 11
glucose levels, was dose dependent, whereas low HDL-C levels demonstrated a 12
reverse relationship. The dose needed to reduce the risk of having low HDL-C levels 13
was ≧50 g per day. This dose, however, resulted in an increased risk of developing 14
high fasting glucose and high triglyceride levels. Consuming mixed types of alcohol 15
increased the risk of developing MS and abdominal obesity. Meanwhile, those who 16
drank liquor or wine had a greater risk of developing high triglyceride or high fasting 17
glucose levels, respectively.In conclusion, alcohol consumption dose-dependently 18
increased the risk of developing MS and some of its individual components while 19
dose-dependently decreasing the risk of developing low HDL-C levels. The type of 20
alcoholic beverage had different effects on the development of the individual 21
components of MS. 22
Keywords: metabolic syndrome, alcohol, ethanol, triglyceride, obesity, glucose
1. Introduction
24Metabolic syndrome is a cluster of diseases characterized by abdominal obesity, 25
hypertriglyceridemia, low HDL-C levels, elevated blood glucose levels, and high 26
blood pressure. Previous reports have shown that metabolic syndrome is associated 27
with increased all-cause mortality [1] and the development of type 2 diabetes mellitus 28
[2]. It is believed that having a sedentary lifestyle is a key determinant in the 29
occurrence of metabolic syndrome. Other modifiable risk factors such as diet and 30
cigarette smoking [3] also play an important role in the development of metabolic 31
syndrome in individuals with a genetic predisposition for this group of diseases. 32
Alcohol has both adverse and protective effects on the individual components of 33
metabolic syndrome. Previous reports have shown that alcohol consumption is 34
positively associated with having abdominal obesity [4-6], high triglyceride levels 35
[7,8], and high blood pressure [8-10]. However, quite a few studies have 36
demonstrated that alcohol consumption has a protective effect on the development of 37
metabolic syndrome by increasing HDL-C levels [7,8,11,12]. Although the results 38
from some studies have shown a U-shaped association between alcohol consumption 39
and plasma glucose levels, that relationship was based on a small number of studies 40
which had different study designs and definitions [13,14]. Taking the inconsistent 41
results of previous studies into consideration, it is unclear whether alcohol 42
consumption contributes to the development of metabolic syndrome. To make a 43
cogent recommendation about alcohol consumption to patients with cardio-metabolic 44
diseases, it is necessary to clarify the association of alcohol consumption with 45
metabolic syndrome and its individual components. Because alcohol increases some 46
risk factors for metabolic syndrome, we hypothesize that alcohol consumption 47
increases the risk of developing metabolic syndrome and that different types of 48
alcoholic beverages have different effects on the development of metabolic syndrome 49
and its individual components. The aim of this study was to investigate the 50
relationship among alcohol consumption, metabolic syndrome, and its individual 51
components. 52
2. Methods and materials
532.1. Participants 54
The study subjects composed two different populations. The first population 55
was from our previous community-based, cross-sectional study, conducted from 56
October 2004 to September 2005, which estimated the prevalence of metabolic 57
syndrome in Taichung city [15]. In that study, based on individuals’ records from the 58
Bureau of Households in Taichung city, we used a 2-stage sampling design to choose 59
residents and ensured that the sampling rate was proportional to the number of 60
residents within each stage. Among the 3530 eligible subjects, 2359 subjects (1147 61
men and 1212 women) agreed to participate, giving us a response rate of 66.83%. 62
Using the same questionnaire, we recruited the second population (1256 men and 63
1231 women) during routine physical examinations at the Department of Family 64
Medicine at China Medical University Hospital from January 2006 to December 2006. 65
In this study, we restricted our analyses to men because the proportion of Taiwanese 66
women who drank alcohol was too small. The final analysis was conducted with 2358 67
men after excluding 45 subjects with incomplete data for any of the following 68
variables: alcohol drinking status, smoking status, physical activity, daily energy 69
intake or the parameters for the diagnosis of metabolic syndrome. Informed consent 70
was obtained from each participant, and the study was approved by the Human 71
Research Committee of the China Medical University Hospital. 72
2.2. Questionnaire 73
The data were collected from self-reported nutrition and lifestyle questionnaires. 74
Items in the questionnaire explored basic demographic data, previous and current 75
disease status, family history of disease, smoking habits, alcohol consumption, betel 76
nut chewing, and physical activity status. The nutrition survey employed a 77
food-intake frequency method to assess daily energy and nutrition intakes. Alcohol 78
consumption was assessed by the type of beverages consumed, the age at onset of 79
drinking, or age when the subject began to abstain, drinking frequency, and the 80
average amount of alcohol per drink. Individuals who drank at least once per week for 81
6 consecutive months were classified as current drinkers. Physical activity was 82
measured by the frequency, duration, and intensity of walking, jogging, running, 83
bicycle riding, swimming, aerobics, aerobic dancing, and other types of dancing, as 84
well as the frequency and duration of time the individual spent playing tennis, table 85
tennis, golf, basketball, or badminton. 86
2.3. Anthropometric measurements and laboratory analyses 87
All participating subjects reported to the outpatient clinic of the Department of 88
Family Medicine after an overnight fast. They were weighed in light clothing, and 89
their heights were measured. Waist circumference was measured in a horizontal plane 90
midway between the inferior margin of the last rib and the crest of the ileum. The 91
circumference was measured to the nearest 1 mm. Blood pressure was recorded from 92
the right arm after the participant sat at rest for a period of 20 minutes. The mean of 93
two blood pressure recordings was used for statistical analyses. Fasting blood samples 94
were drawn between 08:00 and 10:00. 95
The plasma glucose level was determined using a glucose oxidase method 96
(Astra-8, Beckman, CA, USA). Plasma lipids were determined using an enzymatic 97
colorimetric method (Beckman Coulter Synchron LX-20, Brea, CA, USA). 98
2.4. Diagnosis of metabolic syndrome 99
Metabolic syndrome was diagnosed using the American Heart 100
Association/National Heart, Lung, and Blood Institute’s criteria with minor 101
modifications [16]: serum triglyceride level ≧1.69 mmol/l (150 mg/dl) or currently 102
taking hypolipidemic agents; serum HDL-C level<1.03 mmol/l (40 mg/dl); blood 103
pressure ≧130/85 mmHg or currently taking antihypertensive medication; fasting 104
plasma glucose ≧5.6 mmol/l (100 mg/dl) or currently taking oral antidiabetic 105
medication; and waist circumference ≧90 cm. 106
2.5. Statistical analyses 107
All data are presented as the means ± standard deviation except alcohol 108
drinking status, which was separated by the median (lower quantile-upper quantile). 109
Using drinking status as a factor, continuous variables were analyzed with Student’s 110
t-test, and nominal variables were analyzed with the chi-square test to determine 111
whether there were significant differences between the groups. A multiple logistic 112
regression analysis was used to calculate the odds ratios, and the linear trend was 113
evaluated using the trend test. Subjects without data for their education level (n =164) 114
or household income (n= 361) were included in the multiple logistic regression 115
analysis and the trend test. A P-value of less than 0.05 represented a statistically 116
significant difference between the compared data sets. All analyses were performed 117
with the statistical package SAS for Windows (Version 8.1, SAS Institute, Cary, N.C., 118
USA). 119
3. Results
120The characteristics of the study subjects are given in Table 1. Among the 2358 121
men, 1430 subjects (61%) had never drunk alcohol, and 928 subjects (39%) were 122
current drinkers. The current drinkers were younger than the never drinkers. The 123
percentage of subjects with an education level > 12th grade was higher among the 124
never drinkers than among the current drinkers, although the household income was 125
similar between the two groups. The average daily amount of alcohol drinking in the 126
current drinkers was 35.71 g. The drinking amount was the highest among liquor 127
drinkers. The percentage of subjects who currently smoke was higher among the 128
current drinkers. These subjects also had higher levels of physical activity and fat 129
intake than the never drinkers. Fiber intake, however, was lower among the current 130
drinkers. There were significant differences between the two groups in body mass 131
index and waist circumference. The current drinkers had a higher proportion of 132
subjects with high triglyceride levels than the never drinkers, but the percentage of 133
subjects with low HDL-C levels was similar between the two groups. The proportion 134
of subjects with high blood pressure and high fasting plasma glucose was also similar 135
between the never drinkers and the current drinkers. Metabolic syndrome was more 136
prevalent in the current drinkers than in the never drinkers. 137
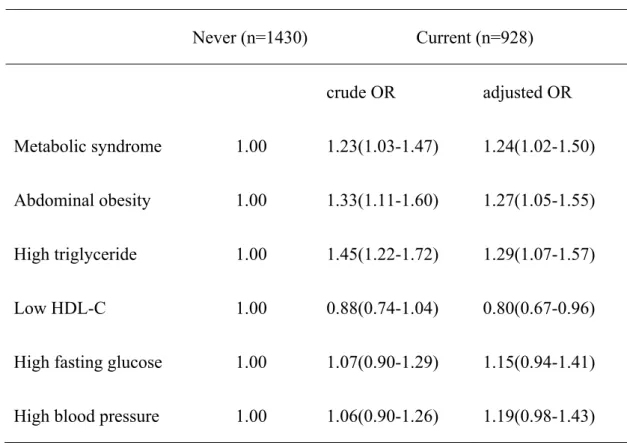
After controlling for other covariates, the current drinkers were at a 138
significantly higher risk of developing metabolic syndrome (P = 0.0307), abdominal 139
obesity (P = 0.0154), and high triglyceride levels (P = 0.0090), but they were at a 140
lower risk of developing low HDL-C levels (P = 0.0175) than the never drinkers. The 141
risk of developing high fasting glucose levels and high blood pressure was similar 142
between the two groups (Table 2). 143
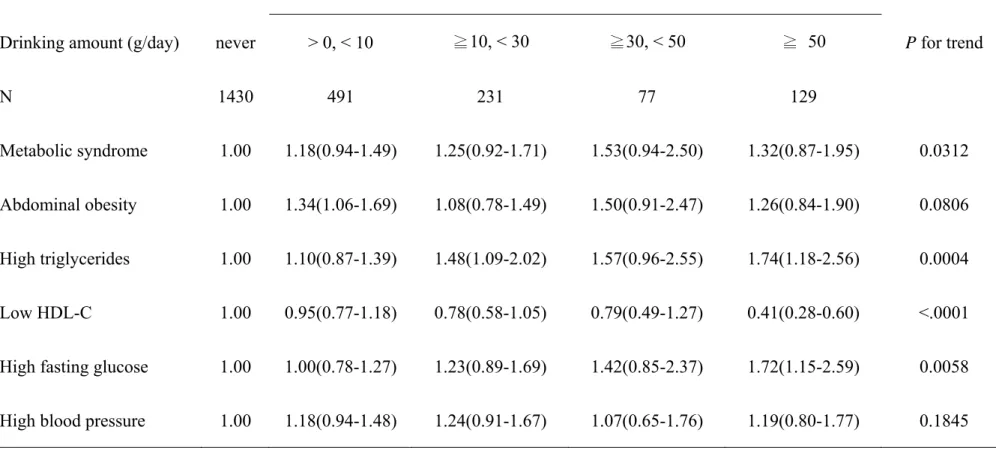
There was a significant, dose-dependent relationship among the amount of 144
alcohol consumed, the development of metabolic syndrome (P = 0.0312 for trend), 145
high triglyceride levels (P = 0.0004 for trend), and high fasting glucose levels (p = 146
0.0058 for trend). The dose-dependent relationship between the amount of alcohol 147
consumed and low HDL-C levels was reversed (P < 0.0001 for trend) (Table 3). The 148
dose associated with the development of low HDL-C levels was ≧50 g per day (P < 149
0.0001); however, that dose of alcohol increased the risk of developing high fasting 150
glucose levels (P = 0.0090) and high triglyceride levels (P = 0.0055) (Table 3). 151
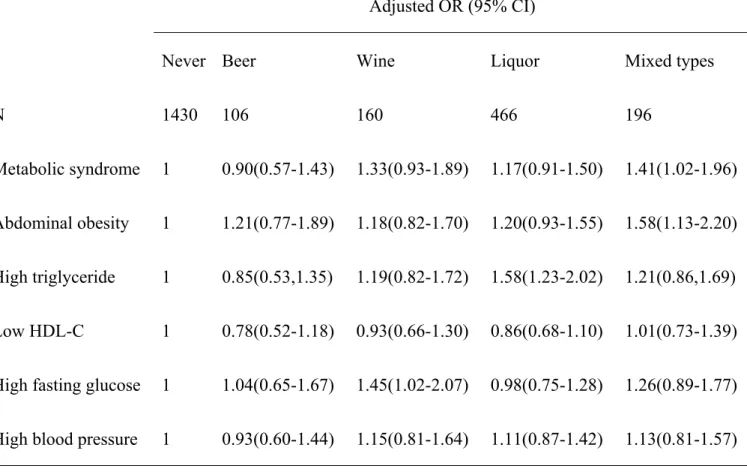
As shown in Table 4, having a mixed type of alcohol consumption was 152
associated with the development of metabolic syndrome (P = 0.0397) and abdominal 153
obesity (P = 0.0069). Liquor-drinking significantly increased the likelihood of 154
developing high triglyceride levels (P = 0.0003), and wine consumption was 155
associated with a greater risk of developing high fasting glucose levels (P = 0.0408). 156
4. Discussion
157This study showed that alcohol consumption increased the risk of developing 158
metabolic syndrome and some of its individual components in a dose-dependent 159
manner. Triglyceride levels were significantly higher in subjects who consumed ≧10 160
g of alcohol per day. Drinking more than 50 g of alcohol per day significantly 161
decreased the risk of developing low HDL-C levels but increased the risk of 162
developing high fasting glucose levels. The type of alcoholic beverages consumed 163
was not related to the development of metabolic syndrome. Consuming mixed types 164
of alcohol, however, increased the risk of developing metabolic syndrome. 165
The results from previous studies on the relationship between alcohol 166
consumption and the development of metabolic syndrome are inconsistent. Some 167
studies have reported that the association is positively linear [17,18], others have 168
demonstrated that the relationship is inversely linear [19,20], some have seen a 169
J-shaped relationship [21], and one study showed that there was no relationship 170
between alcohol consumption and metabolic syndrome [22]. In this study, we 171
demonstrated a positive, linear relationship between alcohol consumption and 172
metabolic syndrome. The discrepancies in past study results may be partly attributed 173
to different study populations and different consumption patterns. Ethnic differences 174
may also play a role in the discrepancy. For example, a previous report showed that 175
an individual’s HDL2-C level was positively associated with alcohol consumption in 176
Caucasian Americans but not in African Americans [23]. That study also 177
demonstrated that heavy alcohol consumption was associated with higher triglyceride 178
levels in African Americans but not in Caucasian Americans [23]. 179
The results of this study were consistent with previous reports that alcohol 180
consumption increases the risk of developing abdominal obesity [4-6] and high 181
triglyceride levels [7,8] while lowering the risk of having low HDL-C levels 182
[7,8,11,12]; however, our results contrast with those of some studies that showed that 183
current drinkers had a lower risk of developing abdominal obesity [24,25] and high 184
blood pressure [8-10]. A meta-analysis showed that moderate alcohol consumption 185
lowers the risk of developing type 2 diabetes, but that this effect disappears in 186
subjects who drank ≧48 g of alcohol per day [9]. Similarly, we found that the 187
consumption of more than 50 g of alcohol per day significantly increased the subject’s 188
risk of developing high fasting glucose levels. 189
Freiberg, et al. showed that the risk of developing metabolic syndrome differed 190
depending on the type of alcoholic beverages consumed [19]. In contrast, Djousse et 191
al. demonstrated that alcohol consumption was associated with a lower prevalence of 192
metabolic syndrome irrespective of the type of alcoholic beverages that were 193
consumed [20]. In this study, the association between alcohol consumption and 194
metabolic syndrome was not related to type of alcoholic beverages consumed. The 195
reason for the discrepancy among these studies is not clear. 196
This study had some limitations. First, the smoking and alcohol drinking statuses 197
were based on the results of self-reported questionnaires; therefore, some of the 198
individuals may have been misclassified. Second, this was a cross-sectional study, and 199
we did not evaluate or consider longitudinal changes in the participants’ habits. Third, 200
although we adjusted for a variety of potential confounders, residual confounding 201
factors are still possible. 202
In conclusion, the results of this study indicate that the risk of developing 203
metabolic syndrome is greater among current drinkers than among never drinkers. In 204
addition, the increased risk of developing metabolic syndrome and many of its 205
individual components, namely high triglyceride and fasting glucose levels, was dose 206
dependent. The type of alcoholic beverages consumed had different effects on the 207
development of the individual components of metabolic syndrome; however, it was 208
not related to the development of metabolic syndrome. The fact that the consumption 209
of a moderate amount of alcoholic beverages has been shown to have protective 210
cardiovascular effects may outweigh the negative effects of consuming alcohol. 211
Acknowledgments
This work was supported by a grant from the China Medical University Hospital (DMR-98-024) in Taichung, Taiwan. The authors declare no conflicts of interest.
References
1[1] Lakka HM, Laaksonen DE, Lakka TA, et al. The metabolic syndrome and total 2
and cardiovascular disease mortality in middle-aged men. JAMA 3
2002;288:2709-16. 4
[2] Hanson RL, Imperatore G, Bennett PH, Knowler WC. Components of the 5
“metabolic syndrome” and the incidence of type 2 diabetes. Diabetes 2002;51: 6
3120-7. 7
[3] Chen CC, Li TC, Chang PC, et al. Association among cigarette smoking, 8
metabolic syndrome, and individual components: the metabolic syndrome study in 9
Taiwan. Metabolism 2008;57:544-58. 10
[4] Tolstrup JS, Heitmann BL, Tjonneland AM, Overvad OK, Sorensen TI, Gronbaek 11
MN. The relation between drinking pattern and body mass index and waist and hip 12
circumference. Int J Obes (Lond) 2005;29:490-7. 13
[5] Schroder H, Morales-Molina JA, Bermejo S, et al. Relationship of abdominal 14
obesity with alcohol consumption at population scale. Eur J Nutr 2007;46:369-76. 15
[6] Riserus U, Ingelsson E. Alcohol intake, insulin resistance, and abdominal obesity 16
in elderly men. Obesity 2007;15:1766-73. 17
[7] Ruixing Y, Shangling P, Hong C, et al. Diet, alcohol consumption, and serum lipid 18
levels of the middle-aged and elderly in the Guangxi Bai Ku Yao and Han 19
population. Alcohol 2008;42:219-29. 20
[8] Lee KS, Park CY, Meng KH, Bush A, et al. The association of cigarette smoking 21
and alcohol consumption with other cardiovascular risk factors in men from Seoul, 22
Korea. Ann Epidemiol 1998;8:31-8. 23
[9] Taylor B, Irving HM, Baliunas D, et al. Alcohol and hypertension: gender 24
difference in dose-response relationships determined through systematic and 25
meta-analysis. Addiction 2009;104:1981-90. 26
[10] Sesso HD, Cook NR, Buring JE, Manson JE, Gaziano JM. Alcohol consumption 27
and the risk of hypertension in women and men. Hypertension 2008;51:1080-7. 28
[11] Linn S, Carroll M, Johnson C, Fulwood R, Kalsbeek W, Briefel R. High-density 29
lipoprotein cholesterol and alcohol consumption in US white and black adults: data 30
from NHANES II. Am J Public Health 1993;83:811-6. 31
[12] Suh I, Shaten BJ, Cutler JA, Kuller LH.Alcohol use and mortality from coronary 32
heart disease: the role of high-density lipoprotein cholesterol. Ann Int Med 33
1992;116:881-7. 34
[13] Koppes LL, Dekker JM, Hendriks HF, Bouter LM, Heine RJ. Moderate alcohol 35
consumption lowers the risk of type 2 diabetes: A meta-analysis of prospective 36
observational studies. Diabetes Care 2005;28:719-25. 37
[14] Carlsson S, Hammar N, Grill V. Alcohol consumption and type 2 diabetes: 38
meta-analysis of epidemiological studies indicates a U-shaped relationship. 39
Diabetologia 2005;48:1051-4. 40
[15] Lin CC, Liu CS, Lai MM, et al. Metabolic syndrome in a Taiwanese 41
metropolitan adult population. BMC Public Health 2007;7:239-43. 42
[16] Grundy SM, Cleeman JI, Daniels SR, et al. Diagnosis and management of the 43
metabolic syndrome: an American Heart Association/ National Heart, Lung, and 44
Blood Institute scientific statement: executive summary. Circulation 45
2005;112:285-90. 46
[17] Fan AZ, Russell M, Dorn J, et al. Lifetime alcohol drinking pattern is related to 47
the prevalence of metabolic syndrome. The Western New York Health Study 48
(WNYHS). Eur J Epidemiol 2006;21:129-38. 49
[18] Baik I, Shin C. Prospective study of alcohol consumption and metabolic 50
syndrome. Am J Clin Nutr 2008;87:1455-63. 51
[19] Freiberg MS, Cabral HJ, Heeren TC, Vasan RS, Curtis Ellison R. Alcohol 52
consumption and the prevalence of the metabolic syndrome in the US: a 53
cross-sectional analysis of data from the Third National Health and Nutrition 54
Examination Survey. Diabetes Care 2004;27:2954-9. 55
[20] Djousse L, Arnett DK, Eckfeldt JH, Province MA, Singer MR, Ellison RC. 56
Alcohol consumption and metabolic syndrome: does the type of beverage matter? 57
Obes Res 2004;12:1375-85. 58
[21] Yoon YS, Oh SW, Baik HW, Park HS, Kim WY. Alcohol consumption and the 59
metabolic syndrome in Korean adults: the 1998 Korean National Health and 60
Nutrition Examination Survey. Am J Clin Nutr 2004;80:217-24. 61
[22] Zhu S, St-Onge MP, Heshka S, Heymsfield SB. Lifestyle behaviors associated 62
with lower risk of having the metabolic syndrome. Metabolism 2004;53:1503-11. 63
[23] Volcik KA, Ballantyne CM, Fuchs FD, Sharrett AR, Boerwinkle E. Relationship 64
of alcohol consumption and type of alcoholic beverage consumed with plasma lipid 65
levels: differences between whites and African Americans of the ARIC study. Ann 66
Epidemiol 2008;18:101-7. 67
[24] Rohrer JE, Rohland BM, Deison A,Way A. Frequency of alcohol use and obesity 68
in community medicine patients. BMC Family Practice 2005;6:17-25. 69
[25] Arif AA, Rohrer JE. Patterns of alcohol drinking and its association with obesity: 70
data from the third national health and nutrition examination survey, 1988-1994. 71
BMC Public Health 2005;5:126-31. 72
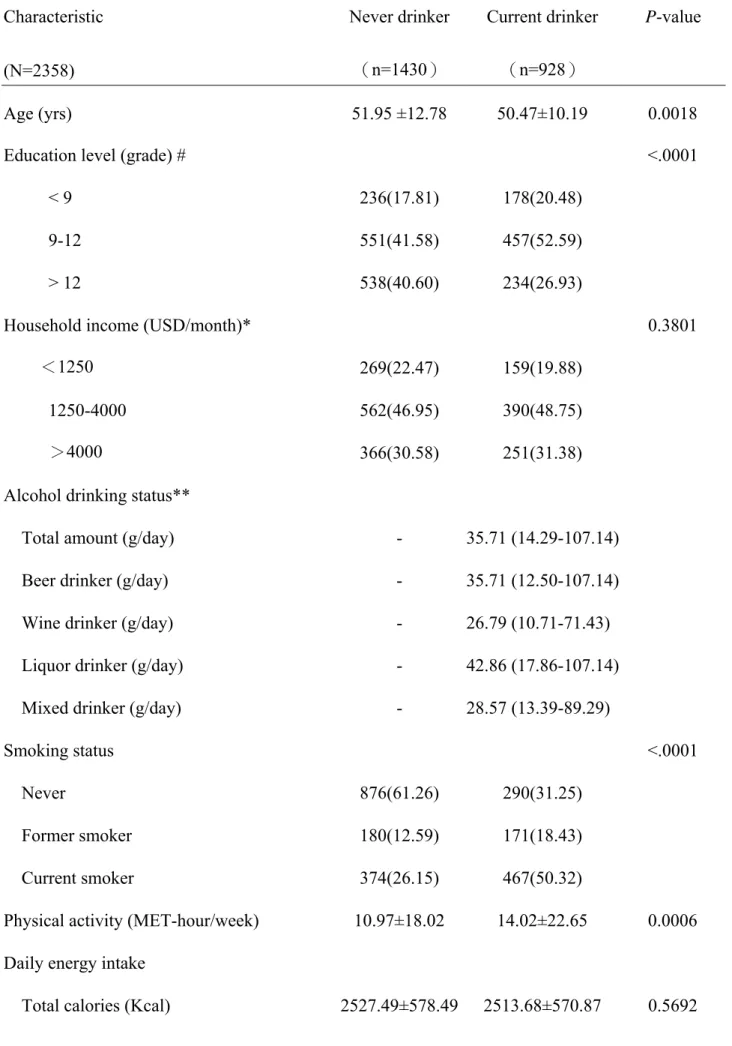
Table 1 Characteristics of the study subjects categorized by alcohol consumption Characteristic (N=2358) Never drinker (n=1430) Current drinker (n=928) P-value Age (yrs) 51.95 ±12.78 50.47±10.19 0.0018
Education level (grade) # <.0001
< 9 236(17.81) 178(20.48)
9-12 551(41.58) 457(52.59)
> 12 538(40.60) 234(26.93)
Household income (USD/month)* 0.3801
<1250 269(22.47) 159(19.88)
1250-4000 562(46.95) 390(48.75)
>4000 366(30.58) 251(31.38)
Alcohol drinking status**
Total amount (g/day) - 35.71 (14.29-107.14)
Beer drinker (g/day) - 35.71 (12.50-107.14)
Wine drinker (g/day) - 26.79 (10.71-71.43)
Liquor drinker (g/day) - 42.86 (17.86-107.14)
Mixed drinker (g/day) - 28.57 (13.39-89.29)
Smoking status <.0001
Never 876(61.26) 290(31.25)
Former smoker 180(12.59) 171(18.43)
Current smoker 374(26.15) 467(50.32)
Physical activity (MET-hour/week) 10.97±18.02 14.02±22.65 0.0006 Daily energy intake
Carbohydrate (g) 476.80±111.71 469.22±110.16 0.1055
Fat (g) 31.84±10.79 33.04±11.61 0.0116
Protein (g) 78.72±19.77 80.24±20.34 0.0715
Fiber (g) 6.58±2.05 6.41±2.06 0.0483
Anthropometric measures
Body mass index (kg/m2) 24.23±3.25 24.78±3.18 <.0001
Total cholesterol (mmol/l) 5.13±0.95 5.25±0.96 0.0017
Metabolic syndrome parameters
Waist circumference≧90 cm 375(26.22) 298(32.11) 0.0021 Triglycerides ≥ 1.69 mmol/l (150 mg/dl) or on medication 437(30.56) 361(38.90) <.0001 HDL-C < 1.03 mmol/l (40 mg/dl) 859(60.07) 528(56.90) 0.1339 Blood pressure ≥ 130/85 mmHg or on medication 572(40.00) 385(41.49) 0.4923
Fasting plasma glucose ≥ 5.6 mmol/l (100 mg/dl) or on medication
412(28.81) 281(30.28) 0.4592
Prevalence of metabolic syndrome 447(31.26) 333(35.88) 0.0223 Data are presented as means ± SD or n (%); MET = metabolic equivalent.
# 164 subjects (n = 105 in never group; n = 59 in current group) without data for education level *361 subjects (n = 233 in never group; n = 128 in current group) without data for household income
Table 2 Association of metabolic syndrome and its components with current alcohol drinking Never (n=1430) Current (n=928) crude OR adjusted OR Metabolic syndrome 1.00 1.23(1.03-1.47) 1.24(1.02-1.50) Abdominal obesity 1.00 1.33(1.11-1.60) 1.27(1.05-1.55) High triglyceride 1.00 1.45(1.22-1.72) 1.29(1.07-1.57) Low HDL-C 1.00 0.88(0.74-1.04) 0.80(0.67-0.96)
High fasting glucose 1.00 1.07(0.90-1.29) 1.15(0.94-1.41) High blood pressure 1.00 1.06(0.90-1.26) 1.19(0.98-1.43)
Presented with odds ratios (OR) (95% CI). The model is adjusted for age, education level, smoking status, physical activity, fat intake, fiber intake and lipid medication. Subjects without data for education level or household income were included in the analyses. A multiple logistic regression analysis was used to calculate the OR. The current drinkers were at a significantly higher risk of developing metabolic syndrome, abdominal obesity, and high triglyceride levels, but they were at a lower risk of developing low HDL-C levels than the never drinkers. The risk of developing high fasting glucose levels and high blood pressure was similar between the two groups.
Table 3 Association of metabolic syndrome and its components with an alcohol drinking amount
Presented with adjusted OR (95% CI). The model is adjusted for age, education level, smoking status, physical activity, fat intake, fiber intake
Current drinkers (n = 928)
Drinking amount (g/day) never > 0, < 10 ≧10, < 30 ≧30, < 50 ≧ 50 P for trend
N 1430 491 231 77 129
Metabolic syndrome 1.00 1.18(0.94-1.49) 1.25(0.92-1.71) 1.53(0.94-2.50) 1.32(0.87-1.95) 0.0312
Abdominal obesity 1.00 1.34(1.06-1.69) 1.08(0.78-1.49) 1.50(0.91-2.47) 1.26(0.84-1.90) 0.0806
High triglycerides 1.00 1.10(0.87-1.39) 1.48(1.09-2.02) 1.57(0.96-2.55) 1.74(1.18-2.56) 0.0004
Low HDL-C 1.00 0.95(0.77-1.18) 0.78(0.58-1.05) 0.79(0.49-1.27) 0.41(0.28-0.60) <.0001
High fasting glucose 1.00 1.00(0.78-1.27) 1.23(0.89-1.69) 1.42(0.85-2.37) 1.72(1.15-2.59) 0.0058
and lipid medication. Subjects without data for education level or household income were included in the analyses. A multiple logistic regression analysis was used to calculate the OR, and the linear trend was evaluated using the trend test. There was a significant,
dose-dependent relationship among the amount of alcohol consumed and the development of metabolic syndrome, high triglyceride levels, and high fasting glucose levels, whereas low HDL-C levels had the reversed relationship. The dose associated with developing low HDL-C levels was ≧50 g per day; however, that dose increased the risk of developing high fasting glucose levels and high triglyceride levels.
Table 4 Association of metabolic syndrome and its components with alcoholic beverages
Adjusted OR (95% CI)
Never Beer Wine Liquor Mixed types
N 1430 106 160 466 196
Metabolic syndrome 1 0.90(0.57-1.43) 1.33(0.93-1.89) 1.17(0.91-1.50) 1.41(1.02-1.96) Abdominal obesity 1 1.21(0.77-1.89) 1.18(0.82-1.70) 1.20(0.93-1.55) 1.58(1.13-2.20) High triglyceride 1 0.85(0.53,1.35) 1.19(0.82-1.72) 1.58(1.23-2.02) 1.21(0.86,1.69) Low HDL-C 1 0.78(0.52-1.18) 0.93(0.66-1.30) 0.86(0.68-1.10) 1.01(0.73-1.39) High fasting glucose 1 1.04(0.65-1.67) 1.45(1.02-2.07) 0.98(0.75-1.28) 1.26(0.89-1.77) High blood pressure 1 0.93(0.60-1.44) 1.15(0.81-1.64) 1.11(0.87-1.42) 1.13(0.81-1.57)
A multiple logistic regression analysis was used to calculate the OR. The model is adjusted for age, education level, smoking status, physical activity, fat intake, fiber intake, drinking amount, and lipid medication. Subjects without data for education level or household income were included in the analyses. Consuming mixed types of alcohol was associated with the development of metabolic syndrome and abdominal obesity. Meanwhile, those that consumed liquor or wine had a greater risk of developing high triglyceride or high fasting glucose levels, respectively.