國
立
交
通
大
學
電機學院光電顯示科技產業研發碩士班
碩
士
論
文
適用於大尺吋掃描式液晶顯示器
之二維串接型背光模組設計
Two-Dimensional LED Tandem Backlight Module
for Large Scale Scanning LCD
研 究 生:姚源榕
指導教授:田仲豪 教授
適用於大尺吋掃描式液晶顯示器
之二維串接型背光模組設計
Two-Dimensional LED Tandem Backlight Module
for Large Scale Scanning LCD
研 究 生
:
姚源榕
Student:Yuan-Jung Yao
指導教授:田仲豪 Advisor:Dr. Chung-Hao Tien
國 立 交 通 大 學
電機學院光電顯示科技產業研發碩士班
碩 士 論 文
A Thesis
Submitted to College of Electrical and Computer Engineering National Chiao Tung University
in partial Fulfillment of the Requirements for the Degree of
Master in
Industrial Technology R & D Master Program on Photonics and Display Technologies
August 2007
Hsinchu, Taiwan, Republic of China
適用於大尺吋掃描式液晶顯示器
之二維串接型背光模組設計
研究生:姚源榕 指導教授:田仲豪 博士
國立交通大學電機學院產業研發碩士班
摘要
本篇論文主要目的為利用串接式楔型導光板達到大尺寸分區掃描式色序法之液晶顯示 器背光模組。傳統色序法背光系統提供一種不需使用彩色濾光片及達到高效能高色彩飽和的 方法。但是由於現今液晶的反應速度仍舊不足,在大尺寸的液晶顯示器運用上,等待整塊面 板的液晶反應時間會壓縮到背光源點亮的時間,導致整體面板的亮度不足。因此,為了解決 此問題,運用掃描式色序法的背光驅動的方式來達到補償等待液晶反應速度上的不足。然而 此種掃描式色序法的背光模組在運作時,若使用傳統無分區的導光板,不同顏色的光場分布 會同時出現在導光板內而出現混光錯誤造成顏色失真的現象。因此,掃描式色序法之液晶顯 示器背光模組需要有良好的分區效果以降低混光錯誤的機率。利用串接式楔型導光板的設 計,組合達到大尺吋的面板需求。經由實驗結果,導光板的均勻性可達到 84%,而在掃描方 向的半高全寬可降低到±30 度,而從點亮的區塊中漏光至鄰近區域的漏光量只有 9.8%。Two-Dimensional LED Tandem Backlight Module
for Large Scale Scanning LCD
Student: Yuan-Jung Yao Advisor: Dr. Chung-Hao Tien
Industrial Technology R & D Master Program of
Electrical and Computer Engineering College
National Chiao Tung University
Abstract
The aim of this thesis is to utilize tandem wedge shaped light guides to accomplish the large scale scanning field-sequential-color liquid crystal display. The field-sequential-color system has a lot of advantages such as high efficiency, high color gamut. However, due to the response time of the liquid crystal is insufficient fast, the duty cycle of the light source is restricted. This situation leads to luminance reduction especially in large size application. In order to overcome this issue, the scanning field-sequential-color backlight system is proposed. In this system, the color state is sequentially scanned from up to down during a whole frame. Nevertheless, if the conventional light guide is used to perform the scanning field-sequential-color backlight module, two different color states will appear on the screen simultaneously. The light penetration will occur inside the light guide, and that will lead the image color distortion. For this reason, each scanning partition of the field-sequential-color scanning backlight application should be an isolated segment to avoid the color mixing error. Based on this purpose, the tandem wedge shaped light guides are assembled to realize large scale application. Through the experiment, the uniformity by 9 points of LG was 84% associated with the brightness enhance film and diffuser. The FHWM (Full Width at Half Maximum) of the extraction light is 30 degree in scanning direction. The leakage from the illuminated block to the adjacent stripes is only 9.8%.
致謝
首先要感謝我指導教授田仲豪老師這幾年來在研究上、英文表達能力及生活 細節上無私的細心指導,並且提供我們良好的研究環境,使我在碩士生涯對於光 學原理與背光系統有深入的了解,並順利完成本論文。 實驗室的日子裡,特別要感謝博士班陸彥行學長以及簡銘進學長在軟體操作 的指導、研究方向以及實驗上的建議,在及在各方面的合作與協助,都幫助我獲 益良多。此外,還有鄭璧如學姊、洪健翔學長以及已經畢業的學長們在研究過程 提供許多寶貴的建議,同時還要感謝其他同學和學弟在課業上、生活上、研究上 的幫助與分享,並陪伴我一起度過這些快樂的日子。 此外,我要感謝和工研院機械所林宗信先生、華映的林威志先生以及中強光 電的林國楠先生,在研究期間提供我實驗材料以及技術上的協助,讓我實驗得以 順利完成。 最後,對於我的家人以及許多朋友,我要感謝你們多年來的支持與鼓勵,還 有生活上的細心照顧與關懷,使我能夠無後顧之憂的研究與學習,並順利完成碩 士學業。這份喜悅我將與幫助過我的各位分享。Table of Contents
Abstract (Chinese) Abstract (English) Table of Contents Figure Caption Chapter 1 Introduction ….……….………11.1 Conventional Thin-Film-Transistor liquid Crystal Display (TFT LCD)……2
1.2 Scanning Backlight………..……..…….………..3
1.3 Field-Sequential-Color (FSC) LCD………..………..7
1.4 FSC LCD with Scanning Backlight………..…………....10
1.5 The Motivation and The Objective of this thesis……….12
1.6 Organization of this Thesis………13
Chapter 2 Principle………..…...14
2.1 Radiometry and Photometry...….………...………14
2.1.1 Radiometry...14
2.1.2 Photometry………..…………...………15
2.2 The light pipe concept………..…...…..………...………....18
2.2.1 Surface & Volume scattering light pipes……….……..18
2.2.2 Variable cross-section light pipes………...………...19
2.2.3 Refractive & Reflective Outcouplers…………...20
2.2.3.1 Shadowing .……...23
3.1 Introduction………...………..………...27
3.2 Simulation Software ...……….………...……….…....27
3.3 Proposed Backlight Module for FSC LCD.………..….……27
3.3.1 Specifications and Criterions………....29
3.4 Design of Wedge Shaped Light Guide………..…..31
3.5 Simulation Model of FSC Scanning Backlight System…………...………33
3.6 Optimization of FSC Scanning Backlight System………..…...33
3.6.1 Optimization of Angular Distribution………..………34
3.6.2 Optimization of Uniformity………...…38
3.7 Simulations………39
3.8 Summary………...……41
Chapter 4 Experimental Results and Discussion……….……..43
4.1 Introduction………...………..………...43
4.2 Diamond turning process technology…....……...………..…………....43
4.3 Wedged Light Guide and Micro-structure profiles………..….…...…45
4.4 Light Source Properties ………..46
4.5 Optomechanical Setup …..………...………46
4.6 Optical Performances of BLM………48
4.7 Summary………...51
Chapter 5 Conclusions &Future works ...52
Figure Caption
[Fig. 1-1] Historical development of electronic displays.………..………....1 [Fig. 1-2] (a) Side emitting type and (b) directly view type backlight system…...2 [Fig. 1-3] (a) Impulse-type display. (b) hold-type display…....……….3 [Fig. 1-4] (a) The situation on the impulse- type display. The moving of black box and real image on the screen can exhibit clear edge. (b) The hold-type display. The fuzzy edge occurs during object moving.………...…….…….4 [Fig. 1-5] (a) The black-image-data insertion method and (b) the timing chart in
black-image-data insertion method……….…….5 [Fig. 1-6] (a) The blinking backlight method and (b) the timing chart in blinking backlight method………..5 [Fig. 1-7] (a) Scanning backlight working sequence during one frame time and (b) the time relation between addressing, response and illumination in scanning backlight………...……6 [Fig. 1-8] (a) LED spectra and the corresponding color filter spectra (b) CIE color….8 [Fig. 1-9] Timing chart in FSC LCD with TFT address, LC response time, and backlight lighting time………..………...………9 [Fig. 1-10] (a) The mechanism of CBU. (b) Stationary image in FSC display
perceived with CBU by eye motion……….9 [Fig. 1-11] (a) FSC scanning backlight system. (b) Time relation on scans of LC TFT array and LED backlight………11 [Fig. 1-12] FSC scanning backlight system (a) without partition; (b) with partitions.12 [Fig. 1-13] A top view of directly type of FSC scanning backlight……….12 [Fig. 2-1] The unit of radiometric and Photometric.………..…………..16
[Fig. 2-4] (a) Surface scattering light pipes (b) Volume scattering light pipes…...….19 [Fig. 2-5] (a) Discontinuous cross-section light pipes; (b) continuous cross-section
light pipes..………..…...20 [Fig. 2-6] (a) Refractive type outcouplers; (b) exit angles achieved by refraction for
different orientations of the refractive surface..………..………….……..21 [Fig. 2-7] (a) Outcoupling produced by a reflective micro-prism (b) Exit angles
achieved by reflection for different orientations of the reflective micro-prism.………..……….22 [Fig. 2-8] The influence of shadowing effect for a given angle of incident………….23 [Fig. 2-9] Propagation between two sections of light pipe………..……….24 [Fig. 2-10] The influence of the shadowing on propagation of the flux and angular spectrum……….………25 [Fig. 2-11] Reduction of the shadowing effect by reduced prism size………...26
[Fig 3-1] (a) Structure of FSC scanning BLM; (b) wedge shaped light guide unit….29 [Fig 3-2] Timing chart for multi-flashing method………....32 [Fig 3-3] Schematic diagram of tandem wedge shaped light guide………...31 [Fig 3-4] Light extraction is introduced by a reflective micro-bump structure….…...32 [Fig 3-5] Exit angles achieved by refraction for different inclined angles and incident angles.………..………...…..…..32 [Fig. 3-6] Simulation module of wedge shaped light guide………...……..33 [Fig 3-7] (a) Radiation characteristic of LEDs emitting (b) Relarive spectral distribution………...………....…..34 [Fig 3-8] Parameters of wedge shaped light guide and effected factor………..……..34 [Fig 3-9] The relation between the refractive angle and zone distribution in (a) region 1, (b) region 2, (c) region 3, and (d) region 4.………..………..…………..36 [Fig 3-10] (a) corresponding incline angle in region (3)………..37
[Fig 3-11] The angular distribution simulated under the various incline angles in (a) region 1, (b) region 2, (c) region 3, and (d) region 4…...…….………...37 [Fig 3-12] Flow chart of optimization for uniformity….…..………….………..38 [Fig 3-13] Luminance map of wedge shared light guide unit………..………39 [Fig 3-14] Rectangular candela distribution plot for divergence of extraction light....39 [Fig 3-15] Illumination map of 3X3 tandem light guide matrix………...…...………40 [Fig 3-16] Definition of light leakage ratio………...………...…41 [Fig 3-17] Illumination map of light guide with single division lit up..………..41 [Fig. 4-1] The fabrication process of wedged light guide with micro structure…...…43 [Fig. 4-2] The fabricated wedged light guide with micro structure…………...…..…44 [Fig. 4-3] The prismatic micro-bumps profiles measured by the optical microscope.44 [Fig. 4-4] The depth and width of prismatic micro-bumps profiles measured under the alpha step………45 [Fig. 4-5] Angular distribution of LEDs – (a) Red (b) Green (c) Blue…………....…46 [Fig. 4-6] (a) Optomechanical setup; (b) Tandem light guides combined with
optomechanical setup………..………...47 [Fig. 4-7] Brightness uniformity of 2x2 tandem light guide matrix – (a) Red (b) Green (c) Blue. (d) Single light guide on white state………....48 [Fig. 4-8] Light leakage from operated block to the neighboring blocks……….49 [Fig. 4-9] The angular distribution of LG module in (a) Green light (b) Red light (c) Blue light……….………...50
Table Caption
[Table 2-1] Radiometry Quantities ………..………....14 [Table 2-2] Photometry Quantities………...…………....16
Chapter 1
Introduction
IntroductionSince electronic displays have been rapidly developed, the technology gradually influences human daily life such as education, communication, and entertainment. Over the past 70 years, cathode ray tube (CRT) shown in Fig. 1-1 [1], was extensively used in TV and monitor. The widespread success of CRT provides a good opportunity for development of flat panel display (FPD). Due to rapid progress on various flat panel display (FPD) such as thin-film transistor liquid crystal display (TFT LCD), projector, and plasma display panel (PDP), the CRT monitors are gradually replaced by the flat panel displays. However, the image quality is still insufficiently comparing with the received by human eye in the real world, and these issues drive people to investigate more front-end State-of-the-technology. In this study, we focus on the backlight system for LCD application.
1.1 Conventional TFT LCD
Recently, TFT LCD is widely embedded into various electronic instruments like TV, camera, monitor, cell phone, etc. Because TFT LCD panel is not a self-emissive device, an additional illumination system is necessary. A general backlight module (BLM) consists of a transparent light guide, optical films, and an adequate light source. Depending on the position of light source, the LCD can be roughly classified two types: side-emitting type and directly-view type as shown in Fig. 1-2.
In conventional cold cathode fluorescent lamps (CCFLs) LCD, the light sources are always turned on for emitting light toward LC cells. The permanent lighting state called hold-type mode will lead to the motion blur while rendering fast moving image.
(a)
(b)
1.2 Scanning Backlight
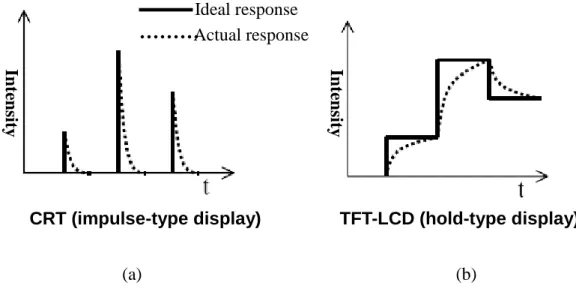
When moving picture is displayed on conventional LCD, the human eyes perceive blurring resulted from the slow response time of the liquid crystal and hold-type backlight [2-5]. Even if the speed of response is near to zero, the fuzzy edge of the object still exists due to the hold-type property of LCD. This is the main reason why CRT has no create blurring image by the impulse-driving mode as shown of Fig. 1-3 (a). Since CRT is impulse-type, the moving image will be exhibited on the center of the retina, and the edge sharpening can be obtained [6]. In other words, making integral of the moving picture in hold-type LCD by human eyes will perceive the blurring image. It is the reason that the human eyes can track the moving object simultaneously. In reality, the movement of the object and the eyes tracking are both continuous. If the object is presented on the hold-type mode display, the movement of the object will lead to the discontinuousness. It will stay on a specific fixed spot during each frame time. Therefore, under the interaction between these two movements, a continuous, and a discrete, the motion blur happens.
(a) (b)
Fig. 1-3 (a) impulse-type display (b) hold-type display. CRT (impulse-type display) In te n sity In te n sity TFT-LCD (hold-type display) Ideal response Actual response
(a) (b)
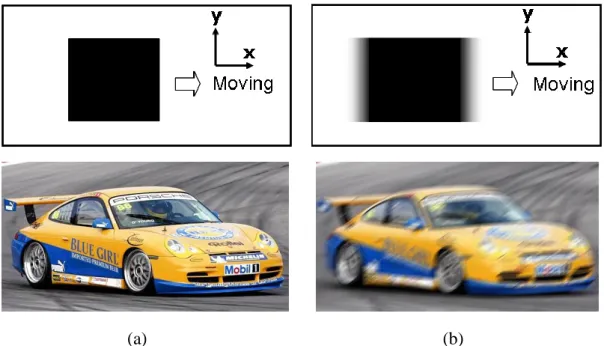
Fig. 1-4 (a) The left side is the situation on the impulse- type display. The moving of black box and real image on the screen can exhibit clear edge. (b) The right side shows the hold-type display. The fuzzy edge occurs during object moving.
Fig. 1-4 shows that the black block horizontally moves along the x-direction. In impulse-type display, the moving of black box exhibits the sharpness edge. If the rapid motion of cinematic image is presented on impulse-type display, the clear image can be observed. However, in the similar case, the fuzzy edge occurs in the hold-type display and the effect of motion blur appearing in LCD will influence the entire quality of display.
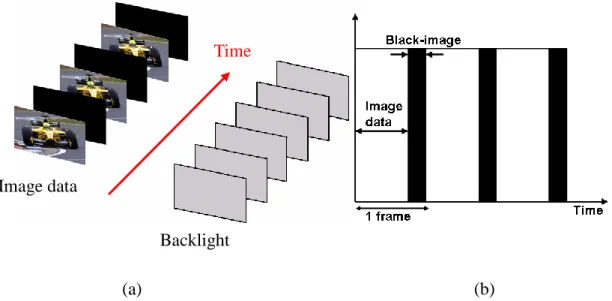
In order to overcome the motion blurs, two impulse-driving methods are proposed: the black frame insertion and the blinking backlight. In the black frames insertion method as shown in Fig. 1-5, the black image is inserted continuously following the real image in each frame, and the backlight is kept constantly on state. Inserting the black frames between each image frame will reduce motion blur. Nevertheless, since the light leakage of LC leads to insufficient dark state [7-10], that will result in lower contrast ratio (CR).
(a) (b)
Fig. 1-5 (a) The black-image-data insertion method and (b) the timing chart in black-image-data insertion method.
The other approach, the blinking backlight system, is realized by iterative on / off state of the backlight. The schematic of the blink backlight system model is shown in Fig. 1-6(b) [11]. The region (1) and (2) indicates the TFT addressing time and the LC response time, respectively. The lamp is turned on following TFT addressing and LC operation, and then turned off before the next frame. The blinking backlight emulates the impulse-type emission like CRT, whereas CCFLs are kept on / off simultaneously.
(a) (b)
Fig. 1-6 (a) The blinking backlight method and (b) the timing chart in blinking backlight method. Image data Backlight Time Image data Backlight Time
Since the operating time of LC in whole screen is insufficiently fast, the luminous span of the lamps is limited. In other words, the image can not obtain sufficient illumination to perform high brightness level. In order to overcome this inadequate situation, scanning backlight is introduced to improve LC response in a simple way, and do not require overdriving backlight scheme to maintain luminance and contrast ratio.
(a)
(b)
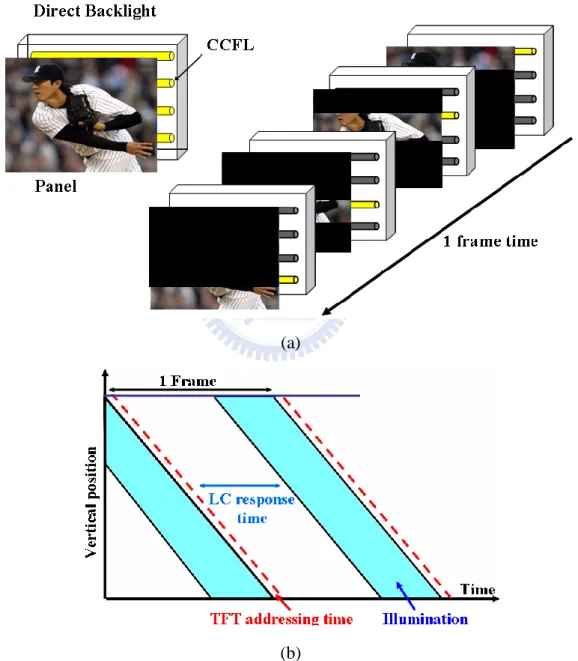
Fig. 1-7 (a) Scanning backlight working sequence during one frame time, and (b) the addressing, response and illumination in the scanning backlight.
As shown in Fig. 1-7(a), the direct scanning backlight system is accomplished by CCFLs which are switched on and off sequentially from up to down in each frame time. By the way of the integral via human eyes and persistence of the vision, the image with lower motion blur can be achieved due to light source is operated with impulse driving method [12]. The chart in Fig. 1-7(b) indicates illumination, TFT addressing, and LC response time. The illumination and addressing of the panel are changed in the same direction with the vertical position of the screen. Each lamp was turned on after LC cells are saturated in corresponded region. Each lighting region does not wait the setup of the entire LC of the panel, it can only delay for its corresponding regions of LC that are saturated. Therefore, the scanning backlight can redeem the problem that is brought by the slow response time of the LC.
1.3 Field Sequential Color LCD
In the modern digital multimedia lifestyle, all kinds of information are requested to render high-quality and high-density. Therefore, the high resolution is required to exhibit the vivid image. Displaying color in conventional LCD has been realized by using three kinds of the color filters to lead the Red, Green, and Blue (R, G, and B) colors pass through. However, it is difficult to accomplish high-resolution LC panel by means of the conventional color-filters (CFs) type LCD due to the CFs hinder the resolution of the LCD from high-resolution. The other concerned issue is the optical efficiency that CFs absorb about two third of energy. Using CF-free display is one of the solutions to improve the optical efficiency and resolution. Moreover, the FSC can be expected to have three times higher resolution than that of the same technology applied to conventional CFs type displays [13-16]. However, the switching speed of CCFLs is not fast enough for the pulsed operation, which is required for the field color sequential scheme.
Using LEDs as light source is suitable for FSC backlight application due to the response time is sufficiently rapid to switch the different color state. Moreover, the emission spectra of R, G, and B LEDs are narrower than the color filters, as shown in Fig. 1-8(a). Based on the CIE 1931 chromaticity diagram, shown in Fig. 1-8(b), the area of the triangle matched by the FSC LCD can exceed 120% NTSC (National Television Standards Committee), which is anticipated to be better than that of current CCFL LCD.
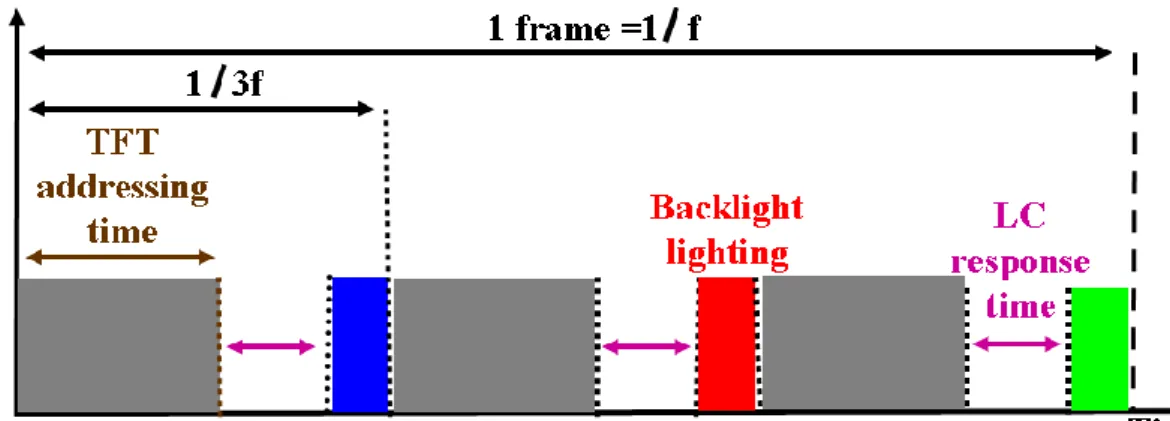
However, the trigger time of each pixel in FSC LCD should be driven three times higher than conventional display, because each frame is composed of three sub-frames. Assuming that the frame frequency is 60 Hz, each sub-frame should be less than 1/180 sec (5.5msec) for TFT addressing, waiting for LC rotating, and LED flashing as shown the timing chart of sequential color LCD in Fig. 1-9
(a) (b)
Fig. 1-8 (a) LED emission spectra and corresponding color filter spectra (b) CIE
Fig.1-9 Timing chart in FSC LCD with TFT address, LC response time, and backlight lighting time.
(a)
(b)
Fig. 1-10 (a) The mechanism of CBU. (b) Stationary image in FSC display perceived with CBU by eye motion.
Viewing direction of eyes
In contrast to the advantages of FSC LCD,however, waiting TFT address and LC response time cause the shorter illumination time and color break-up (CBU) which degrades display quality. As resemble in motion blur, if a displayed object is moving on an FSC LCD, the edge of the object will appear rainbow colors. Fig. 1-10 exhibits the mechanism of CBU during eye tracking movement.
1.4 Field Sequential Color with Scanning Backlight
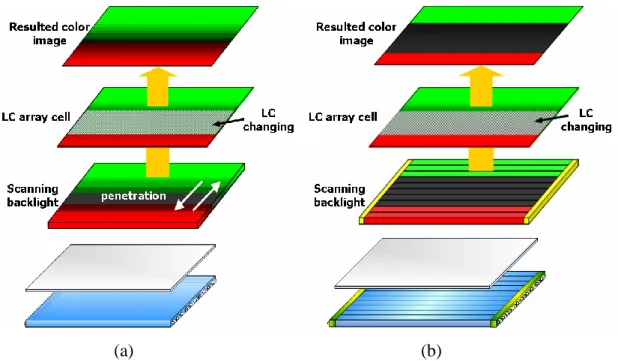
To improve the CBU and decrease the required LC response time, a special configuration of backlight is proposed, i.e., a FSC scanning backlight. The conventional FSC backlight sequentially transforms the color states in order of R, G, and B color in each frame, and the entire screen exhibits the same color state at the same time. Furthermore, the traditional scanning backlight is aimed at motion blur, and the light leakage would not introduce an issue because the color state of edge of moving object does not change. Nevertheless, the FSC scanning backlight, the color state is scanned from up to down for whole BLM. If the whole emitting surface of the light guide is divided into 10 portions to illuminate, and the timing relation between the TFT addressing, LC response, and LED flash is shown in Fig. 1-11(b) [17]. If we take the instant moment as a dotted line, it will be important to notice that the two different color states appear on the screen simultaneously. It is obvious that light penetration will occur inside light guide, and that will cause the image color distortion as shown in Fig. 1-12(a).
(a) (b)
Fig. 1-11 (a) FSC scanning backlight system. (b) Time relation on scanning of LC TFT array and LED backlight.
(a) (b)
Fig. 1-12 FSC scanning backlight system (a) without partition; (b) with partitions.
In view of this, each scanning partition of FSC scanning backlight application should be divided into isolating segments to avoid the color mixing error as shown in Fig. 1-12(b). Because the sharp discontinuity between divisions may lead to the unacceptable image, the control of light leakage between each partition is necessary. Accordingly, light exiting from each partition should be highly directed in order to ensure possibly smallest interference to neighboring divisions.
1.5 Motivation and Objective of the thesis
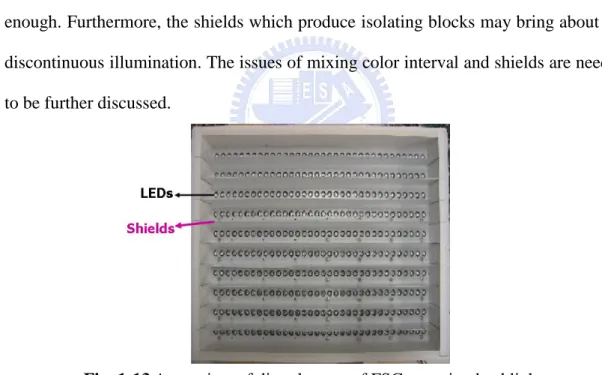
The development of fast-response LCDs, which consists of optically-compensated-bend (OCB) mode LC and high efficiency LEDs for providing three primary colors, have accelerated the accomplishment of the scanning FSC LCD [18-20]. However, this side lit approach is unsuitable for developing the large scale FSC scanning backlight system. In order to maintain the sufficient illumination, the previous researches used the directly view BLM to execute a large size FSC LCD as shown in Fig. 1-13 [21]. Nevertheless, the essential color mixing space should be provided in this mechanism. Moreover, the required partitions are formed by means of shields. The indispensable mixing distance leads the size of display not compact enough. Furthermore, the shields which produce isolating blocks may bring about the discontinuous illumination. The issues of mixing color interval and shields are needed to be further discussed.
Fig. 1-13 A top view of directly type of FSC scanning backlight.
The purpose of the thesis is to establish a large size configuration in FSC scanning backlight system, which can define each partition without shields as well as reduce the mixing color space.
1.6 Organization of this Thesis
The thesis is organized as following: the principle of the components, light guides combine with prismatic micro-bump structures, and the optical theories will be presented in Charter 2. In Chapter 3, the specification of the proposed module will be given, and the simulated optical efficiency and light leakage will be obtained. Furthermore, the fabrication process for micro structure, the method of measurement, and the experimental results will be obtained in Chapter 4. Finally, the conclusions and the future works will be described in Chapter 5.
Chapter 2
Principle
2.1 Radiometry and Photometry
2.1.1 Radiometry
Radiometry is a science which is used to measure the radiation and principally deals with the radiant energy of any wavelength. No matter what kinds of optical system design, the purposes are receiving and transmitting the radiation or communication energy. Therefore, the radiation should be quantified and defined clearly. The fundamental radiometric quantities are shown in Table 2-1.
Table 2-1 Radiometry Quantities
The Q denotes the propagating energy of electromagnetic radiation, and its basic unit is the Joule. Sometimes, the amount of photons is also defined as the radiation energy, and the energy of a single photon ish .
The radiant flux is the rate of flow of the energy with respect to time, dQ/dt, and the unit is Watt (W). The recommended symbol for power is φ.
an area on the surface of the sphere equal to that of a square of side of length equal to the radius of sphere. The intensity is the derivative of the power with respect to the solid angle, dφ/dw. The symbol is I.
The radiance is power per unit projected area per unit solid angle, and the unit is sr
m
W/ 2 . Radiance is the flow of the power with respect to the solid angle and projected area, dφ/dωdAcosθ, where θ is the angle between the surface normal and the specified direction.
The Irradiance is measured in W /m2. Irradiance is the power per unit area incident from all direction in a hemisphere whose base is that surface. The symbol is E, and it is the derivate of the power with respect to area, dφ/dA. A similar quantity is
radiant exitance, which is the power per unit area leaving a surface to a hemisphere whose base is that surface. The symbol is M.
2.1.2 Photometry
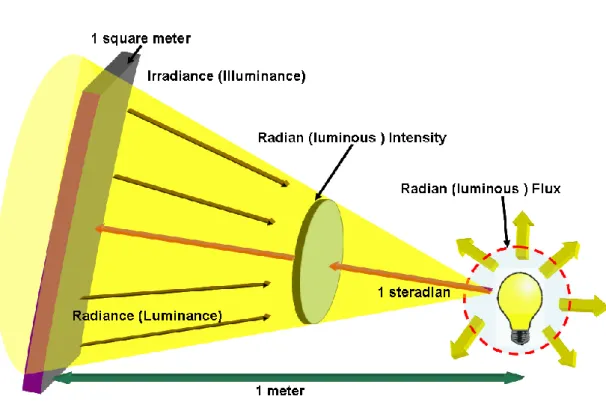
Photometry is the measurement of light which is defined as electromagnetic radiation that is detectable by the human eye. This range corresponding to wavelength is 380 to 830 nanometer (nm). Unit symbols are subscripted with v to denote visible, and unit names are prefixed with the term luminous. The unit of luminous flux (φ ) is v called a lumen (lm). The fundamental photometric quantities are similar to the radiometric as shown in Table 2-2. The only difference between radiometry and photometry is that the radiometry includes the entire optical radiation spectrum, while photometry is limited to visible spectrum as defined by response of human eye. Fig.2-1 shows the both measurement system.
Table 2-2 Photometry Quantities
Fig. 2-1 The unit of radiometric and Photometric.
From the lumen definition, there are 683 lumens per watt at 555 nm. This is the wavelength that corresponds to the maximum spectral responsivity of human eye. The conversion from watts to lumens in any other wavelength involves the product of power (watts) and the V(λ) in the wavelength of interest. The luminous flux in any wavelength can be calculated by the following equation:
Where φ is the luminous flux, v φλλ is the corresponding radiant spectrum of radiation source, and V() is the photopic spectral luminous efficiency function as shown in Fig. 2-2.
Fig. 2-2 Human visual response function.
One thing to watch out for is that the radiometry measurement system uses the same units of Watt as used for electric measurements. In both measurement systems, the term Watt refers to the energy per unit time generated by radiation source. Thus, it is possible to define two different measurements with the same units. The term radiant efficiency, with units W/W, refers to the energy conversion efficiency of radiation source in converting electrical power into radiant flux. The term luminous efficiency, with unit lm/W, refers to the energy conversion efficiency of the light source in converting electrical power into luminous flux. The term luminous efficiency, with unit lm/W, refers to the ratio of luminous flux to radiant flux generated by the light source.
λ – wavelength (nm)
) ( V2.2 The light pipe concept
The function of the light pipe transforms a light source into a desired light distribution. When light is propagating inside the light pipe by total internal reflection (TIR), the pipe surface can selectively covered the outcoupling zone whose function consists in extracting part of light out from the pipe. The shape of the pipe may change depending on the desired optical operation and the object to be illuminated. Fig.2-3 shows different kinds of the light pipe applications: the light guide plate and the circular light pipe.
(a) (b)
Fig. 2-3 (a) Light guide plate. (b) Circular light pipe.
The following subsections will introduce and evaluate the characteristics of different types of the outcouplers. These outcouplers are classified by their working principles.
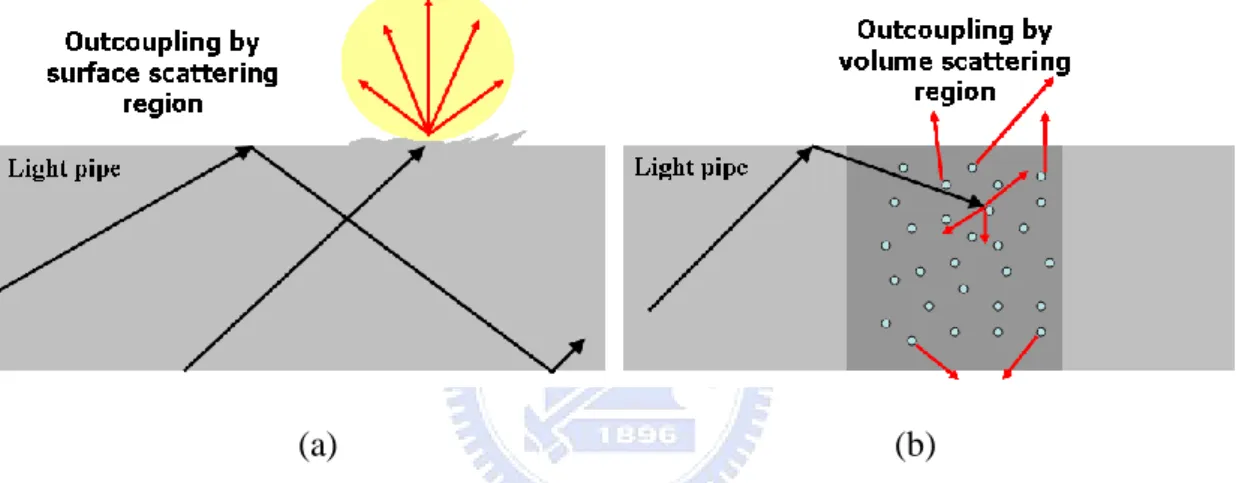
2.2.1 Surface & Volume scattering light pipes
It is well known that the polished light pipe propagates the light by TIR without any optical losses. However, any regional defects of the surface will cause the optical scattering. Actually, the light is partially coupled out from the pipe by the surface roughness which can be generated on purpose in specific location by manufacturing process as shown in Fig. 2-4(a). The main drawback of the outcoupling by surface
As shown in Fig 2-4(b), when the light guided in the light pipe meets the volume scattering section, part of light will not respect the TIR anymore and then they couple out from the light pipe. This volume scattering results from the refraction of the light generated by particles which are poured into the pipe by fabrication process. The illumination should be theoretically controlled by modulation of doping the density of the particles. However, the technical limitation of the fabrication will not allow an exact control of doping distribution. Therefore, the uniformity of the illumination will be difficult to obtain in the volume scattering light pipe.
(a) (b)
Fig. 2-4 (a) Surface scattering light pipes (b) Volume scattering light pipes
2.2.2 Variable cross-section light pipes
The variation of the pipe cross-section can be implemented and classified by continuous or discontinuous cross-section light pipe. The discontinuous cross-section type is illustrated as Fig. 2-5(a). The flux coupled out from the pipe is directly proportional to the variation of the pipe cross-section. The guided fluxIi1at the
th
i 1)
( section of the pipe is defined as
i i i i I d d I 1 1 (2-2) Where I is the guided flux in the i i section of the pipe, th
i
d and di1 are the
i i i i I d d ) 1 ( 1 (2-3) The other case, continuous cross-section, is presented as Fig. 2-5(b). The propagation angle α of the guided ray is changed at each intersection with the inclined angle. When the propagation angle α becomes smaller than critical angle, the ray will not respect the TIR condition anymore, then the ray is extracted from light pipe. If the inclined angle of the pipe surface and the incident angle are defined as and
1
i
, respectively. Then the new propagation angleiis defined as
i i1 2 (2-4)
(a) (b)
Fig. 2-5 (a) Discontinuous cross-section light pipes; (b) continuous cross-section light pipes
2.2.3 Refractive & Reflective Outcouplers
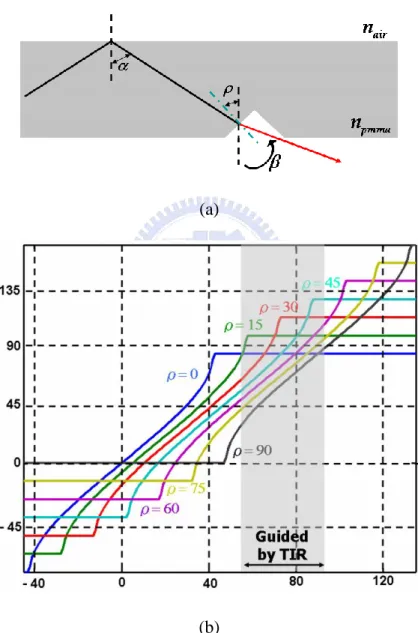
The principle of the refractive outcouples consists in placing discontinuities along the pipe surface in order to locally exceed the TIR condition. In such situation, the light escapes from pipe by refraction as shown in Fig. 2-6(a). Where α is the incident angle and ρ is the inclination of refractive surface. The indices of therefraction of the PMMA and air are defined by npmma and nair. Accordingly, the exit angle β can be obtained by Snell‟s law as
The relationship between exit angle, incident angle, and incline angle is shown in Fig.2-6 (b). The gray region covers the incident angle which relates to the light guided by TIR in the pipe. Furthermore, it is obvious that the light extracted from the pipe appearing large incline angle distribution. It is not practical for general light pipe which requires to illumination normal to the surface. Therefore, this kind of approach usually demands a correction plate to collimate the direction of light.
(a)
(b)
Fig. 2-6 (a) Refractive type outcouplers; (b) exit angles achieved by refraction for
different orientations of the refractive surface.
along the surface of light pipe which deflects the guided ray out from the pipe. Two kinds of the reflective micro prism can be selected: coated micro-prisms and the TIR micro-prism.As illustrated in Fig. 2-7 (a), the reflective coated micro-prism is placed along the pipe surface to deflect part of guided light. The incident angle and the prism orientation are defined by α and ρ, respectively. Therefore, the exit angle can be achieved by ) 2 sin( sin 1 air pmma n n (2-6) (a) (b)
Fig. 2-7 (a) Outcoupling produced by a reflective micro-prism (b) Exit angles
orientations of the micro prism. Different with the refractive case which has grazing angle of the extracted light, the reflective coated micro-prisms approach is more flexible. Therefore, for given any incident angle, there exists a better corresponding orientation to get the desired outcoupling distribution. However, the metallic coating on working face of prism is difficult to be done and the metallic absorption affects the optical efficiency of outcoupling rays. The cumulative optical losses will significantly deteriorate the optical efficiency of the light pipe.
The TIR micro prisms have an advantage that will not require any coating. Moreover, TIR will not cause any optical losses. However, the TIR only occurs when rays reaching the prism which incident angle is greater than critical angle as
c
(2-7) 2.2.3.1 Shadowing
The flux extracted from the light pipe is a function of the prism size and prism density. However, for a given angle of incident, the prism density is limited. As illustrated in Fig.2-8, the shadowing limits the efficiency of the outcoupling. It is obviously that the shadowing effects increase for grazing incident angle (α > 90). A way to repress the shadowing is to design variable cross-section light pipe.
Fig. 2-8 The influence of shadowing effect for a given angle of incident
pipe by TIR. The cross-section of the dimension is defined by Y. If each point
onz plane can be considered as a point source which emits in 0 + direction, the z
angular spectrum of the light is defined by a cone whose half angle is φ. Therefore, the half angular spectrum after propagation toz plane can be demonstrated equal to φ. 1 Furthermore, if the reflective micro prisms are located between z and0 z , the 1 influence of shadowing can be analyzed. As shown in Fig.2-10, the depth of the three micro prisms P is placed in three random positions. As expect, the angular y spectrum and illuminance in planez depends on the1 depth of prisms. Further, there is a region which does not receive any light (complete shadow).
Fig. 2-10 The influence of the shadowing on propagation of the flux and angular
spectrum
In intuitive solution to reduce the shadowing is to decrease the depth of the prisms as shown in Fig.2-11. The prisms are located in the same position, but the depth has been reduced to 60%. As expected, the zone of the complete shadow has been considerably reduced. Nevertheless, some thing should be noticed that the efficiency of the light pipe h is proportional to the prism density G along the light pipe surface which is z p z P v z G z h( ) ( ) ( ) (2-8)
Fig. 2-11 Reduction of the shadowing effect by reduced prism size
Where vp(z) is the local spatial frequency of the prisms, andP is the prism size. z Thus, the reduction of the prism size does not only reduce the shadowing effect, but also the efficiency of the light pipe. The way to diminish the shadowing, while keeping the efficiency, is to curtail the prism size and proportionally increase the prism spatial frequency. Actually, the general solution between the depth of prism P z and the size of the prism cross-section Y is according to
20 y P Y (2-9) 2.3 Summary
Consideration of the particular necessity of FSC scanning BLM, the profile of the light guide chooses the continuous variation of the cross-section type. Further, comparing with different functional light pipes, the reflective outcoupler provides more flexible parameters and better choice for designers. By properly design of the inclined angle of the micro-prism, the craved outcoupled angle can be obtained. In the following chapter, we will use the continuous cross-section light guide combining with reflective micro-prism to accomplish the backlight system, and the simulation software will be utilized to further design and optimize the micro structures.
Chapter 3
Design and Simulation
3.1 Introduction
In this chapter, the main stress will fall on the tandem wedge shaped type light guide components. These components are assembled into desired penal size, and utilized in the backlight module. The BLM is proposed for a scanning field-sequential-color liquid-crystal display (FSC LCD). Therefore, the requirement and specification of the backlight system will be briefly introduced. Moreover, the design of the wedge shaped light guide combining with prismatic micro-bump structures will be described in detail. And the simulation model which is established to characterize the feature of the tandem light guide system will also be represented as well as the simulation results.
3.2 Simulation Software
The optical simulator TracePro® is developed by Lambda Research Corporation, and it is a general ray tracing software for illumination analysis, optical analysis, radiometry analysis, and photometry analysis. It is used to simulate and optimize the uniformity and efficiency of the wedged light guide combining with prismatic micro-bump structures.
3.3 Proposed Backlight Module for FSC LCD
Coupling with the optically-compensated-bend (OCB) mode LC and full color LEDs, a FSC LCD can be realized without any color filters. However, due to the insufficient LC saturated time, the duty cycle of the LEDs is restricted, and that will
cause the backlight not bright enough. In order to improve the issue of the LC response time in FSC LCD application, a specific configuration of the backlight system is required: spatial-temporal partitioned scanning backlight driven by FSC method.
In the previous research, a small size FSC scanning backlight module has been designed and fabricated by using side lit approach [22]. However, this side emitting type BLM is inadequate for developing the large scale FSC scanning backlight system. Therefore, the objective of proposed BLM should be able to accomplish the large size FSC spatial-temporal partitioned scanning backlight system.
The structure of the spatial-temporal scanning backlight for an OCB-mode FSC-LCD is shown in Fig. 3-1(a). The backlight consists of
(1) Tandem wedge shaped light guides have prismatic micro-bump structures over the bottom that control the direction of the light extraction as well as the uniformity and efficiency as shown in Fig. 3-1(b),
(2) 4-in-1 full color LEDs light bar is set in front of the incident surface of the corresponding LG and under the end of the previous one,
(3) A diffuser on the top of the wedge shaped light guides that diffuses light and illuminates local dim regions, and
(4) A brightness enhanced film (BEF) with a saw-tooth cross-section guide light toward the front direction in order to increase the normal component of the light toward the LCD.
Each tandem wedge shaped light guide for FSC LCD application should be made block-wise, so that the illumination of the single block will be isolated from other blocks. If there is no partition between the LG plates, the light from one single block
LED light-bar corresponding single block which consists of 15 packages of 4-in-1 R, G, G, B LEDs are adopted as the light source.
(a)
(b)
Fig. 3-1 (a) Structure of FSC scanning BLM; (b) wedge shaped light guide unit.
3.3.1 Specifications and Criterions
The specification of the developed prototype OCB mode FSC LCD is shown in Table. 3-1. The tandem wedge shaped light guides are assembled into 32-inch diagonal panel size with aspect ratio 16:9. The entire BLM is divided into 12 horizontal blocks in the consideration of LC response time, the optical efficiency of the light guide unit, and the panel resolution. The vertical pixel numbers should be divided into an integer by scanning divisions. Otherwise, the pixel will be located across the boundary of two isolated LG plates and contribute to light leakage. Moreover, if we try to increase the numbers of the scanning blocks, the optical performance of LG unit is difficult to be maintained, and some technical problems may occur during fabrication process. Therefore, the 12 scanning divisions is an adequate choice for our model, and the following condition should be satisfied [23]. [1 sub-frame time] > = [scanning time of the whole gate lines] / [scanning blocks]
+ [response time of liquid crystal] + [LED flashing time] (3-1)
Each color sub-frame takes about 1/180 sec. The duty cycle of the illumination pulse is limited to about 50%. From the specification, the total number of gate lines is 768. If a BLM is divided into 12 scanning partitions, each single block will be in charge of 64 lines of the TFT pixel array correspondingly, and the scanning duration over those lines is about 0.45 ms, which is the acceptable tolerance for the LC response time. Fig. 3-2 shows the simple time relation on scanning of LC, TFT-array cell and LED backlight.
The criterions of the uniformity for full panel and efficiency per light guide unit are 80% and 70%, respectively. The thickness of the overall BLM is expected to less than 30mm and without any shields.
Fig. 3-2 Timing chart for multi-flashing method
3.4 Design of Wedge Shaped Light Guide
Considering the optical efficiency of the wedge shaped light guide unit and the required space for setting LED light bar, the tilt angle of the wedge shaped light guide δ is defined by 13.6 degree as shown in Fig. 3-3.
Fig. 3-3 Schematic diagram of tandem wedge shaped light guide
In order to obtain the uniformity and directional light distribution, the prismatic micro-bump structures are built along the bottom of the light guide. For convenience, every LED is regarded as a point source; therefore, the relationship between incident ray, exit light and micro-bump structures can be illustrated with Fig. 3-4. The incident angle is defined as α, and the tilt angle of wedge type LG and incline angle of micro-bump structure are determined by γ and δ, respectively. Accordingly, the exit angle β can be obtained by Snell‟s law of refraction as this formula.
Fig. 3-4 Light extraction is introduced by a reflective micro-bump structure.
By the eq. (3-2), the relation between the exit angle β, incident angle α, and incline angle γ can be subsequently established in Fig. 3-5. In this graph, each curve refers to the light with a specific incline angle. The gray region is the desired range of exit angle. For each particular incident angle, there exists a better corresponding inclined angle to make the exit angle approximately in the gray region.
3.5 Simulation Model of FSC Scanning Backlight System
It may be noted that the tandem wedge shaped light guide is connected with each other and congregated into 32 inch panel size. In order to consider the time of simulating ray-tracing, initial design and optimization process are carried out under the single light guide unit as shown in Fig. 3-6. The simulation module consists of the main body of backlight system, i.e. LEDs light-bar, wedge shaped light guide, reflector, and a detector placed in top of light guide.
Fig. 3-6 Simulation module of wedge shaped light guide.
The illuminating property of the light source in simulation, as shown in Fig. 3-7, is set as quasi-lambertian. The spectrum of Red, Green, and Blue were 636nm, 456nm, and 522nm, respectively. The refractive index of the light guide unit is set as 1.49 which is the same as that of PMMA. In addition, the detector is set to detect the angular distribution and the uniformity of the outcoupled light, which serve as the function of the optimization.
3.6 Optimization of FSC Scanning Backlight System
After establishing the simulation model, the next part is to optimize the parameters of the wedge shaped light guide to obtain the desired optical characteristic. The parameters include the incline angle of the prismatic micro-bump structure, micro-bump width, and micro-bump gap as shown in Fig.3-8. The incline angle affects the angular distribution of the emitted light, and micro-bump width, and the gap determines the uniformity.
(a)
(b)
Fig. 3-7 (a) Radiation characteristic of LEDs emitting (b) Relarive spectral
distribution
Fig. 3-8 Parameters of wedge shaped light guide and effected factor.
3.6.1 Optimization of Angular Distribution
Since the refractive index of PMMA is set 1.49, and the angular distribution of the LED is about ±90°, the maximum of theθ , the refractive angle of the LED light i
passing trough the incident surface of light guide, will reach to ±42°. Therefore,
Parameters Effected factor
Incline angle Angular distribution Micro-bump Width Uniformity
approximately with ±30°.
In the beginning, the tilted surface of the wedge shaped light guide can be roughly classified into four parts for different incident angle in order to choose the suitable incline angle as shown in Fig. 3-9. The first part is the refractive angle θ i from -42° to -10°. Then, the second part is the refractive angle larger than -10° but smaller than 0° and the light which is reflected once by TIR has the refractive angle from 20° to 42°. The third part is the refractive angle approximately with 0° and the light which is reflected once by TIR has the refractive angle from 15° to 20°. The finally region is the distribution of refractive angle as 5° to 15°.
For convenience, the simulation in this part is carried out under a uniform distribution of the micro grooves, because it does not influence the divergent angle. From the discussion in chapter 3-4, Fig. 3-5 indicates the relation between the exit angle β, incident angle α, and the prismatic micro-bump incline angle γ. Here, an example for how to select the better corresponding incline angle γ in region (3) is given. For the region (3), the refractive angle θ is approximately with 0° and the i
light is propagated once by TIR with refractive angle from 15° to 20°. Accordingly, the incident angle α in region (3) is from 70° to 90° as shown in the yellow region in Fig. 3-10. The yellow region and the gray region intersect at the curve γ near 30°. Therefore, the angular distribution simulates under the various incline angles γ from 28° to 34°. As seen in Fig. 3-11 (a), the angular distribution at incline angle γ = 32° has the most narrow Full Width at Half Maximum (FWHM) about ±15°, and approximate to the normal of output surface comparing with other angles. By the same steps, the region (2), (3), and (4) are also simulated incline angle from δ= 28° to 34°, and δ= 32° to 38°. According to the limitation of fabrication process, the different incline angle in corresponding regions are chosen by 40°, 30°, 32°, and 35°, respectively.
(a)
(b)
(c)
(d)
Fig. 3-9 The relation between the refractive angle and zone distribution in (a) region 1,
(b)
Fig. 3-10 (a) corresponding incline angle in region (3).
(a) (b)
(c) (d)
Fig. 3-11 The angular distribution simulated under the various incline angles in (a)
3.6.2 Optimization of Uniformity
Due to the light intensity decreases with the distance apart from light source, the dimension of the micro-bump structure should be changed to keep the uniformity. The basic principle is that control the filling factor as mentioned in the following formula as shown in Fig. 3-8.
Filling factor = Micro-bump width / Micro-bump width + Micro-bump gap (3-3)
The filling factor near to the light source should be smaller than thefarther one. In order to simplify the light guide structures, the micro-bump width is fixed, and only adjusts the gap of the micro-bump to achieve uniform distribution. The flow optimization chart for the encoding scheme is summarized in Fig 3-11. First, the entire light guide is equally divided into several areas. Then, fixing the micro-bump width and varying the filling factor in each region try to get the high uniformity. If the uniformity can not be improved by changing any filling factor, then adjust the relative area of each region. Such steps will be repeated several times, and obtain the highest uniformity finally.
3.7 Simulations
According to the optimization flow chart in Fig 3-12, the illumination map of the unitary wedge shaped light guide with prismatic micro-bump structures is optimized as shown in Fig. 3-13. The uniformity of the extraction light and the efficiency of the single light guide unit are 93% and 68%, respectively. Furthermore, the directivity of the extraction light is indeed enhanced. The light coupling from light guide has a narrow divergent angle ±15° on the y-z plane, and about ±50° on the x-z plane, which are shown in Fig. 3-14. This directionality is expected to reduce the probability of the light that leak to the region whose state of the LC isstill changing.
Fig. 3-13 Luminance map of wedge shared light guide unit.
As mentioned above, the tandem light guide will be assembled and connected with each other into a large panel size LCD. Therefore, each connected boundary between light guides is an important issue. The partitions must be not visible from any viewing angle on the panel due to the shade or obviously discontinuous luminance severely affects the display performance. For this reason, except for simulating the single light guide unit, the 3x3 tandem wedged light guide matrix is also simulated as shown in Fig. 3-15. In this situation, we do not observe any obvious discontinuity. This simulation is in ideal case. However, the defects may occur during fabrication process in real cases. The finally results will be given in the Chapter 4 Experiments.
Fig. 3-15 Illumination map of 3X3 tandem light guide matrix.
Furthermore, in order to estimate the influence of the image color distortion, we introduce an evaluation, light leakage ratio, which defined as
o A A L L L + = r a t i o L e a k a g e L i g h t (3-5) Where L is the luminance of operating block, and o L is the luminance of adjacent A
blocks. Fig. 3-16 is a scheme that the entire backlight with only the 6 block is th turned on. The corresponding simulation is given in Fig 3-17. The light leakage from the operating block to the neighboring divisions is accounted for 9.2%.
Fig. 3-16 Definition of thelight leakage ratio.
Fig. 3-17 Illumination map of light guide with single division lit up.
3.8 Summary
The wedge shaped light guide unit combining with the prismatic micro-bump structures has been optimized. The uniformity of the emitting light can be achieved about 93% from the simulation. Also, the efficiency can be obtained about 68%. In addition, the angular distribution of the extracted light can even be controlled within ±15° in scanning direction with the prismatic micro-bump structures. We also simulate the boundary between each connected light guides. In 3x3 tandem light guide matrix, there is no obvious discontinuity. Furthermore, the light leakage ratio which is used to evaluate the image color distortion is 9.8%.
Chapter 4
Experimental Results and Discussions
4.1 IntroductionIn this chapter, the diamond turning process technology, adapted to implement the prismatic micro-bump structures of tandem wedge shaped light guide units, will be briefly introduced in advance. After that, the fabricated micro-bump structures are examined with the optical microscope and the alpha step.
For the backlight system, the integrating sphere is utilized to measure the optical property of the 4-in-1 LED. Moreover, the Conoscope is used to survey the angular distribution of the illuminating light from the whole BLM. Then, the uniformity and efficiency of the light coupling from light guide are also measured by the charge coupled device (CCD). Finally, the light leakage ratio from the operating block to the adjacent blocks will be given.
4.2 Diamond turning process technology
Diamond turning, a kind of micro-mechanism machining, is utilized the copy principle to duplicate the desired structures. Different to the injection molding which is suitable for the mass production, the diamond turning process provides low cost and flexible fabrication. Therefore, the direct carving is the method for implement in this study.
The fabrication steps of the wedge shaped light guides with prismatic micro-bump structures can be roughly illustrated as Fig. 4-1.
along the z direction to set an orientation as well as the depth of the structure. Then, the knife is moved horizontally toward the y direction to form a prismatic micro-bump structure.
(iii) After forming a single structure, the diamond knife shifts a specific pitch along the x direction and sets another orientation to repeat the step (ii). (iv) Continuously repeating step (ii) and (iii), a wedge shaped light guide with
prismatic micro-bump structures is fabricated finally.
(i)
(ii)
(iii)
(iv)
4.3 Wedged Light Guide and Micro-structure profiles
In this study, the wedge shaped light guide and prismatic micro-bumps structures are supported by Coretronic and Industrial Technology Research Institute (ITRI), respectively. After the fabrication, the profiles of light guide unit are shown in Fig. 4-2. Fig. 4-3 indicates the micro-bumps profile which is detected by the optical microscope (OM). Because it is difficult to focus in wedge shaped light guide, the fuzzy edge appears. Furthermore, the depth and width of the micro structures are measured by the alpha step as shown in Fig. 4-4. The width of the micro-bump structures is varied along the x direction from 30μ m to hundreds μ m.
Fig. 4-2 The fabricated wedged light guide with micro structure.
Fig. 4-4 The depth and width of the prismatic micro-bumps profiles measured under
the alpha step.
4.4 Light Source Properties
The package of 4 in 1 (RGGB) LEDs is used as light source. The angular distribution directly affects the whole property of the BLM. In the experiment, the performance of LEDs is measured by an integrating sphere as shown in Fig. 4-5. When current is fixed by 100mA, the voltage on green, blue, and red color states are driven by 3.3v, 3.4v, and 2.2v. The luminous flux is achieved by 8.2lm, 2.2lm, and 5.2lm, respectively.
4.5 Optomechanical Setup
The optomechanical setup which consists of LED light bars, holder mechanism,
and light guide units are used to demonstrate the simulation. Each light-bar PCB contains 15 packages of 4-in-1 RGGB LEDs with 3 input / output port. Furthermore, the heat sinks and holder mechanism are implemented due to the thermal and light guide tilt issues as shown in Fig. 4-6. The holders are made by aluminum. The thickness of the entire BLM is about 25mm. Next part we will examine the optical performance of thewhole BLM.
(a)
(a) (b)
Fig. 4-6 (a)Optomechanical setup; (b)Tandem light guides combined with
optomechanical setup.
4.6 Optical Performances of BLM
After measuring the light source property, the uniformity of the 2x2 tandem light guide matrix on different color states are captured and analyzed by the CCD camera as shown in Fig. 4-7. The uniformity by 9 points of the LG are 89%, 86%, 84%, and 85% on R, G, B, and the white color states associated with a brightness enhance film and a diffuser. In addition, according to the measurement and calculation, the optical efficiency of BLM is 63%. The lumen per watt in terms of R, G, and B color states are 33 lm/w, 37 lm/w, and 9.1 lm/w, respectively. Furthermore, the discontinuity of the boundary between LGs is undistinguishable.
(a)
(b)
(c)
(d)
Fig. 4-7 Brightness uniformity of 2x2 tandem light guide matrix – (a) Red (b) Green
Moreover, in order to analyze the light leakage, only single block is lit up as mentioned in simulation. The light leakage from operating block penetrate to the adjacent divisions is well suppressed to below the 9.8%. From the operating block to the third division, the light leakage is repressed near to zero. However, due to the entire light guide and driving program are still in progress, the effect of the light leakage can not be defined very well. Therefore, the influence of the light leakage on the image quality with LC panel will be further evaluated.
Fig. 4-8 Light leakage from operated block to the neighboring blocks
After that, the angular distribution of the wedged type light guide unit is measured by Conoscope. The result is shown in Fig. 4-9. The full width at half maximum (FHWM) of the extraction light on different color state is about 30 degree in y direction (dashed line) and 50 degree in x direction (solid line). Such directionality is expected to reduce the possible color mixing error.
(a)
(b)
(c)
4.7 Summary
The tandem wedge type LGs with prismatic micro-bump structures for scanning FSC BLM are fabricated. The function of the LG unit enables collimating the high divergence of the incident light into ±30° in y direction and ±40° in x direction. Furthermore, the uniformities on R, G, and B color states exhibit 89%, 86%, and 89%,
respectively. The thickness of thewhole BLM is about 25 mm. We successfully define the partition down to 9.8% light leakage to the neighboring divisions without any shields or gaps. Such light leakage can avoid the occurrence of color dependence for adjacent portions of the light guide. However, due to the tilt angle of the wedge shaped light guide is more oblique than thecommon case, the optical efficiency is not good enough. This drawback should be further improved by the proper optimization.
Chapter 5
Conclusions & Future Works
With development of education, communication, and entertainment in human daily life, LCDs become an important display technology. High brightness, resolution, and excellent color rendering are themajor concerns. Although several configurations of the hold-type LCDs have been proposed, many issues such as motion blur, optical efficiency, and poor color representation have large space to improve. In this study, the scanning FSC LCD is proposed to overcome these defects.Scanning FSC LCD has potential to serve as the new approach in terms of offering better image quality. It can efficiently improve the fuzzy edge of the moving picture, provide higher color gamut without color filter less and higher optical efficiency. These advantages drive us to pursue an partitional BLM in such display.
The tandem wedge shaped light guides combining with the prismatic micro-bump structures have been introduced in this thesis. The prototype of the spatial and temporal scanning backlight system have been demonstrated. 4-in-1 red, green, green, and blue LEDs are utilized to generate color fields sequentially during the scanning process. Different with conventional LCDs which are supplied the entire uniform backlight, the scanning FSC LCDs must provide isolated scanning partitions and well light divergence for each division. Otherwise, the light will leak to the adjacent blocks and cause image color distortion. The proposed tandem wedge shaped light guide combining with micro-bump structures can partition the BLM into several isolated blocks without any shields and gaps. The prismatic micro-bump structures are
distribution of the illuminating light as well as the uniformity along the pipe direction. According to the simulation, the wedge shaped light guide is designed and optimized by modifying the filling factor and incline angle. The uniformity and efficiency of the light guide unit can be obtained 93% and 68%, respectively. The divergence angle in scanning direction is ±15°. In addition, the light leakage ratio from operating block to the neighboring divisions is accounted for 9.2%.
In the experiment, the CCD camera and the Conoscope are utilized to measure the optical performance of BLM. The uniformities of the different color states are 84% to 89%. The divergence angle of scanning direction is ±30°. The light leakage ratio from operating block to the neighboring divisions is suppressed down to 9.8%. The experimental results in close agreement with the simulation confirm our optical modeling and fabrication precision. The most concerned issue lies in the boundary between light guides is undistinguishable. Finally, the thickness of the whole BLM which consists of holders and optical films are 25 mm without any shields or gaps.
In the future, the BLM will be coupled with FSC scanning program and OCB liquid crystal panel to further evaluate the influence of the light leakage on image quality. In addition, the different driving method for FSC scanning BLM such as the dual scan or two-dimensional scan can be employed to enhance the optical performance.