行政院國家科學委員會專題研究計畫 成果報告
探討奈米顆粒對玻璃纖維複合材料動態及靜態壓縮強度之
影響
研究成果報告(精簡版)
計 畫 類 別 : 個別型 計 畫 編 號 : NSC 99-2221-E-009-023- 執 行 期 間 : 99 年 08 月 01 日至 100 年 10 月 31 日 執 行 單 位 : 國立交通大學機械工程學系(所) 計 畫 主 持 人 : 蔡佳霖 計畫參與人員: 碩士班研究生-兼任助理人員:高菁穗 碩士班研究生-兼任助理人員:洪健峰 博士班研究生-兼任助理人員:王泰元 博士班研究生-兼任助理人員:黃健洋 博士班研究生-兼任助理人員:曾世華 報 告 附 件 : 出席國際會議研究心得報告及發表論文 處 理 方 式 : 本計畫涉及專利或其他智慧財產權,2 年後可公開查詢中 華 民 國 100 年 09 月 26 日
行政院國家科學委員會補助專題研究計畫
□期中進度報告 ■ 成 果 報 告探討奈米顆粒對玻璃纖維複合材料動態及靜態壓縮
強度之影響
計畫類別:■ 個別型計畫 □ 整合型計畫
計畫編號:NSC 99-2221-E-009-023
執行期間: 99 年 08月 01日至 100年 10月 31日
計畫主持人:蔡佳霖
計畫參與人員: 曾世華 王泰元 黃健洋 洪健峰 高菁穗
成果報告類型(依經費核定清單規定繳交):
■精簡報告 □完整報告本成果報告包括以下應繳交之附件:
□赴國外出差或研習心得報告一份
□赴大陸地區出差或研習心得報告一份
■出席國際學術會議心得報告及發表之論文各一份
□國際合作研究計畫國外研究報告書一份
處理方式:除產學合作研究計畫、提升產業技術及人才培育研究計
畫、列管計畫及下列情形者外,得立即公開查詢
□涉及專利或其他智慧財產權,□一年
■
二年後可公開查詢執行單位:
國立交通大學機械工程學系
中 華 民 國 100 年 10 月 10 日
行政院國家科學委員會專題研究計畫成果報告
探討奈米顆粒對玻璃纖維複合材料動態及靜態壓縮
強度之影響
計畫編號:NSC 99-2221-E-009-023
執行期限:99年08月01日至100年10月31日
主持人:蔡佳霖 國立交通大學機械工程學系
計畫參與人員:曾世華 王泰元 黃健洋 洪健峰 高菁穗
中文摘要 本研究宗旨為探討添加不同含量之二氧 化矽奈米顆粒,對於玻璃纖維/環氧樹脂複合材 料其壓縮強度的影響。藉著溶膠-凝膠技術,直 徑 25 奈米的二氧化矽顆粒均勻地混入環氧樹脂 中。隨後由真空手積層技術將環氧樹脂混合物 置入單方向玻璃纖維內,以製作出含有 10%、 20%與 30%二氧化矽重量百分比的玻璃纖維/環 氧樹脂複合材料積層板。分別利用 MTS 液壓機 以及分離式霍普金森壓桿(SHPB),對含有纖 維方向 0 °、5°、10 °、15° 以及 90 °之複合材料 試片進行靜態和動態壓縮試驗。觀察破壞試片 發現,當纖維方向小於 15 度時,纖維微挫曲是 主要的破壞機制;而對於纖維方向 90 度的試 片,則為出平面的剪切破壞。此外,實驗結果 亦顯示,玻璃/環氧複合材料的壓縮強度,隨著 二氧化矽含量的增加,有明顯提高的趨勢。此 壓縮強度的增強,我們可以透過微挫曲模型加 以預測。 關鍵詞 : 二氧化矽奈米複合材料、壓縮強度、分離式霍 普金森壓桿 AbstractThe research is aimed to investigate the compressive strengths of glass/epoxy nanocomposites, containing various loadings of spherical silica nanoparticles. Through a sol-gel technique, the silica particles with a diameter of 25 nm were exfoliated uniformly into the epoxy resin. Subsequently, by inserting the silica epoxy mixture into the unidirectional glass fiber through
a vacuum hand lay-up process, the glass fiber/epoxy composite laminates with 10, 20, and 30 wt% of silica nanoparticles were fabricated. Quasi-static and dynamic compression tests were conducted on the brick composite specimens with fiber orientations of 0°, 5°, 10°, 15°, and 90° using a hydraulic MTS machine and a Split Hopkinson Pressure Bar (SHPB), respectively. Observations on the failure specimens indicated that for fiber orientations less than 15 degrees, the fiber microbuckling is the dominant failure mechanism. On the other hand, for the 90 degree samples, the out-of-plane shear failure is the main failure mechanism. In addition, it was denoted that as the silica contents increase, the compressive strengths of the glass/epoxy composites are improved accordingly. The enhancing mechanism in the compressive strengths can be properly explicated using the microbuckling mode
KEY WORDS:
silica nanocomposites, compressive strength, Split Hopkinson Pressure Bar
1. Introduction
With extensive applications of composites, the demand for the materials possessing the characteristics of high stiffness and strength is increasing. However, because the compressive strengths of fiber composites are lower when compared to its tensile strength, the compressive failures have been of great concern to the composite community. In past decades, the compressive strengths of unidirectional composites were effectively predicted by using either the microbuckling model [1, 2] or the
kink-band model [3, 4]. It was suggested that the compressive failure of a fiber composite in the form of fiber microbuckling is governed by the matrix stiffness property. Thus, it is reasonable to expect a pronounced improvement of compressive strength if the matrix properties can be modified appropriately. Based on the aforementioned concept, Subramaniyan and Sun [5] demonstrated that the longitudinal compressive strength of glass fiber reinforced composites could be improved properly by using nanoclay-modified matrix.
Spherical particles have been used as reinforcement in polymeric materials for many years. In general, these particle sizes were in micron ranges. However, with the advance of nanotechnology as well as the processing techniques, various types of particles with nano-scale have recently been developed and then utilized in conventional polymeric materials to form the nanocomposites. Rosso et al. [6] employed the well-dispersed silica nanoparticles as reinforcement in composites, indicating that the addition of 5 vol% silica nanoparticles could improve the stiffness and fracture energy to 20% and 140%, respectively. The similar escalating behaviors were also observed by Johnsen et al. [7]. Considering the superior mechanical properties of silica nanoparticles, Zheng et al. [8] adopted the silica nanocomposites as matrix material in conjunction with the glass fiber to form hybrid glass/silica/epoxy nanocomposites. They found that the bending properties as well as the tensile properties of the fiber composites were enhanced by the addition of silica nanoparticles. The enhancement could be attributed to the promoted bonding forces between the glass fiber and matrix modified by the silica nanoparticles. In light of the forgoing investigation, it was concluded that the silica nanoparticles can significantly enhance the mechanical behaviors of polymeric materials as well as the tensile and bending properties of glass fiber composites. Recently, Uddin and Sun [9] indicated that inclusion of silica nanoparticles can significantly increase the longitudinal compressive strength of fiber composites and moderately improve the longitudinal and
transverse tensile strengths. Moreover, the improvement in compressive strength is much pronounced in high fiber volume fraction nanocomposites than the low fiber volume fraction nanocomposites.
In this study, systematic experimental investigations were carried out to understand the effect of silica nanoparticles on quasi-static and dynamic compressive behaviors of glass fiber/epoxy composites. Off-axis brick specimens with fiber orientations of 0°, 5°, 10°, 15°, and 90° were tested to failure using a hydraulic MTS machine and a Split Hopkinson Pressure Bar, respectively, from which the quasi-static and dynamic compressive strengths were determined accordingly. All failure samples were examined using SEM microscopy to determine the corresponding failure mechanism.
2. Sample preparations
In order to investigate the silica nanoparticle effect on the compressive strength, the glass fiber/epoxy brick specimens with various loadings of silica particles were prepared. The epoxy resin used in this study is Nanopox@ F400, which was supplied from Hanse Chemie, Germany. Basically, it is a diglycidyl ether of bisphenol A (DGEBA) resin, containing 40 wt% silica nanoparticles. Through sol-gel processing, the synthesized silica particles were dispersed uniformly in DGEBA resin [10]. The curing agent used is Jeffamine D-230 (polyoxypropylenedi amine with a molecular weight of 230) provided by the Huntsman
Corporation. To have a desired amount of
silica contents in the specimens, the Nanopox@ F400 resin was diluted at the beginning by adding a desired amount of DGEBA resin. The mixture was then sonicated using a sonicator with a cooling system around the sample container until the particles were displaced uniformly in the epoxy resin. The epoxy–silica mixture was degassed at room temperature in a vacuum oven for 10 minutes and then mixed with the curing agent. The mechanical stirrer was utilized to blend the final mixture at room temperature for 10 minutes. Afterwards,
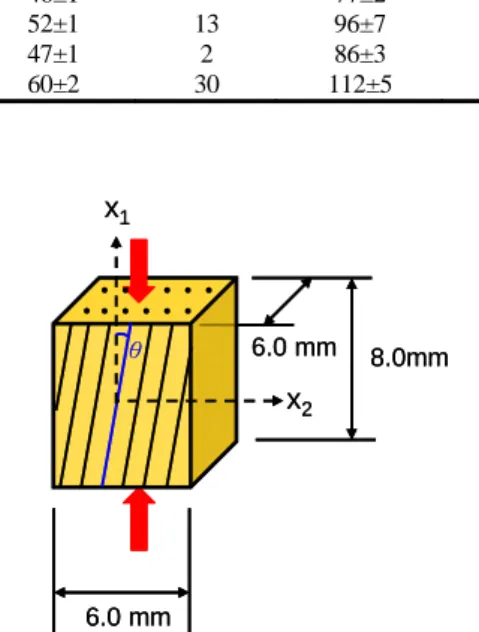
vacuum-assisted hand lay-up procedures were adopted for preparing the glass fiber/silica/epoxy nanocomposites. The mixture of silica/epoxy and the D-230 curing agent was poured on one dry unidirectional glass fiber layer (provided by Vectorply®, E-LR0908-14 unidirectional E-glass fiber). The compound was impregnated into the dry fiber using a hand roller until the fiber bundles were permeated completely by the resin. Then, another ply of dry fiber was stacked on it. The repeating process continued until the 22 layers of glass fibers were fabricated. The fiber stack was sandwiched between two steel plates with porous Teflon fabric on the surfaces, and it was then sealed within a vacuum bag. The whole laminates were cured in a hot press with a suggested temperature profile under vacuum conditions. It is noted that the vacuum is an essential process for forming nanocomposites because it can facilitate the removal of the tiny bubbles trapped in the nanocomposites. In this study, the laminates consisting of 0, 10, 20, and 30 wt% silica nanoparticles were prepared. Off-axis brick specimens with fiber orientations of 0°, 5°, 10°, 15°, and 90° with dimensions of 8mm×6mm×6mm as shown in Figure 1 were cut from the laminates using a diamond wheel. The fiber volume fraction for all the off-axis specimens is around 45%.
In order to evaluate the quality of dispersion of the silica nanoparticles in the epoxy matrix, the epoxy samples were examined using a Transmission Electron Microscope (TEM). Samples with around 70 nm thickness for TEM analysis were prepared using a microtome at the cryogenic condition. TEM observations of epoxy/silica nanocomposites were carried out by a JEOL 200CX with an acceleration voltage of 120KV. The micrographics of the nanocomposites with 20 wt% silica nanoparticles at 50,000 and 100,000 magnifications were illustrated, respectively, in Figure 2. It was shown that the particles were well dispersed and homogeneously distributed in the nanocomposites. In addition, most of the nanoparticles were in spherical shape and the
average diameter was around 25 nm. Therefore, based on the TEM observations, it was suggested that the present samples were regarded as the nanocomposites with fully dispersed spherical nanoparticles.
3. Experimental procedure
In order to understand the silica particle influence on the compressive strengths, the fiber composites with various silica loadings were tested to failure under compressive loadings. Both quasi-static and dynamic compression tests were performed on the samples using a conventional hydraulic MTS machine and a Split Hopkinson Pressure Bar (SHPB), respectively.
3.1 Quasi-static compression tests
Off-axis brick specimens with fiber orientations of 0, 5, 10, 15, and 90 degrees (against the long direction) were employed for the measurement of compressive strengths. The brick specimens were lapped on a lapping machine with a 3 μm abrasive slurry to ensure smooth and flat loading surfaces. In addition, a lubricant was applied to the end surfaces of the specimen to reduce contact friction. The compressive forces were applied to the samples through the end loading fixture attached by a pair of tungsten carbide disks as shown in Figure 3. A self-adjusting device, as shown in Figure 3, was used to eliminate potential bending moments and also to ensure that the specimen was in full contact with the loading surfaces. All tests were conducted at a hydraulic MTS machine with a strain rate of 0.0001/s. The applied load and displacement for each test were recorded using LabVIEW software with a PC computer. The maximum value in the load–displacement curve was regarded as the failure stress of the sample in the quasi-static tests.
3.2 Dynamic compression tests
High strain rate experiments were conducted using a Split Hopkinson Pressure Bar (SHPB), which is a simple and effective device for dynamic tests. The SHPB setup used in this study was made of hardened steel bars, which were 13.3 mm
in diameter, as shown in Figure 4. The striker bar had a length of about 90 mm, and the incident bar and the transmission bar were 91 cm and 56 cm long, respectively. The off-axis brick specimens employed in the SHPB tests were the same as those used for the quasi-static tests. During the tests, the brick specimen was sandwiched between the incident bar and the transmission bar. It is noted that shear-extension coupling takes place in off-axis specimens under axial loading. This behavior combined with bar-specimen interfacial friction could give rise to inhomogeneous deformation in the specimen, resulting in deviations from the conventional Hopkinson bar assumption. In order to reduce the interfacial friction, all test specimens were lapped and lubricated as suggested by Ninan et al [11]. In addition, a pulse shaper technique was used to produce a gently rising loading pulse that would help in extracting reliable stress–strain curves from SHPB tests. This pulse shaping can be achieved using a piece of soft material inserted between the striker bar and the incident bar. A copper tab that was 1.7 mm thick was used as the pulse shaper in the present study.
A pair of diametrically opposite gages (gage A), as shown in Figure 4, was mounted on the incident bar to measure both the incident and reflected signals. On the other hand, in the transmission bar, strain gages (gage B) were mounted at about 160 mm from the bar/specimen interface to measure the transmitted pulse. The strain gages on the bars were connected to Wheatstone circuits and then amplified using a conditioning amplifier. Finally, the signals were recorded by the digital oscilloscope with a sampling rate of 10MHz. Figure 5 shows the typical strain gage signals measured from the incident and transmission bars, respectively. Based on one-dimensional wave propagation theory [12], the contact stress P1 between the
incident bar and the specimen, and P2, the contact
stress between the specimen and the transmission bar, can be extracted from the recorded signals. Figure 6 shows contact forces P1 and P2 for the 5o
specimen with 20wt% silica content in the SHPB test. It can be seen that the P1 and P2 curves are
nearly the same as well as their peak values, and thus the average of the peak values was taken as the dynamic failure stress of the specimen. It is noted that the strain rate ranges in the dynamic tests are around 400–600 1/s.
4. Results and Discussions 4.1 Failure mechanism
In an attempt to understand the failure mechanisms, all failed specimens were examined using a microscope. For the 0o specimens, it was found that the failure was mostly dominated by the fiber microbuckling; although, in few cases, the fiber splitting might take place at the specimen ends. However, even though these two failure mechanisms are distinct; no significant differences in the failure stresses were observed. For the 5o,
10o, and 15o specimens, the main failure
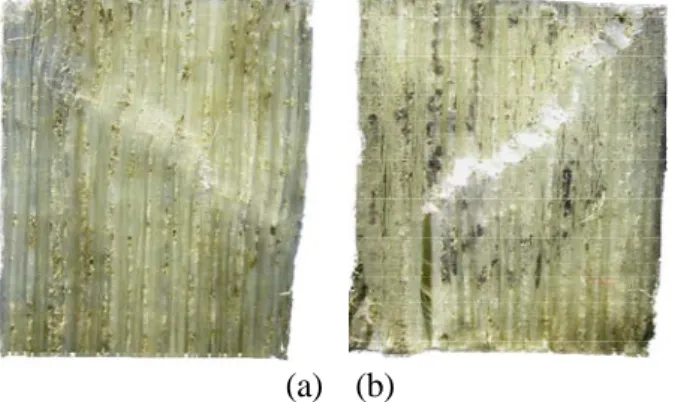
mechanisms were also the fiber microbuckling. The similar failure mechanism was also reported in the literature [9]. Figures 7 and 8 illustrate the fiber microbuckling of the 0o and 5o samples, respectively. The shining band strips as shown on the photos designate the areas where substantial fiber microbuckling takes place. On the other
hand, for 90o samples, the major failure
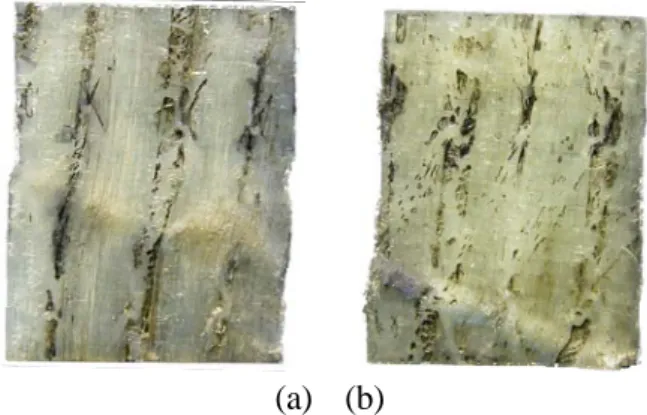
mechanism was the out-of-plane shear failure as shown in Figure 9. It can be seen that the crack in shear mode occurred on the plane orientated around 36–40 degree with respect to the loading direction propagating transverse to the fiber direction. Similar failure behaviors were also observed in other polymeric composites systems [13]. Based on the experimental investigations, it was found that the compressive failure mechanism basically was not altered by the contents of silica nanoparticles and the loading rates. In contrast, the compressive failure stresses could be influenced by the silica nanoparticles as well as the loading rates.
4.2 Compressive strength
The experimental data for the off-axis specimens obtained from the quasi-static and dynamic compression tests associated with different fiber orientations are enumerated in
Tables 1–5, respectively. It is noted that for each case, at least four samples were tested. Apparently, the compressive strengths of fiber composites are sensitive to the loading rates, and when the loading rates increase, the materials demonstrate higher failure stresses. Moreover, the compressive strengths of the fiber composites are improved as the silica loading increases, and the incremental percentages caused by the silica nanoparticles in both quasi-static and dynamic cases are almost the same. It is noted that the compressive strength does not seem to increase consistently as particle loading increases. This is especially obvious for the case with silica loading of 20wt%. The possible reason for the little reduction in the 20 wt% samples could be the larger fiber misalignment generated during the fabrication of the fiber composites. The fiber misalignment which is a manufacturing defect created by fiber movement in the matrix during the lay-up and curing process may influence the compressive strength of the fiber composites [2, 14]. In general, the variation of the fiber misalignment is more significant in the hand-made fiber composites and this could be responsible for the reduction of the compressive strength in the 20wt% samples.
For the 0o, 5o, 10o, and 15o samples, the main failure mechanisms are the fiber microbuckling, so the enhancement in compressive strength modified by the silica nanoparticles can be explained using the microbuckling model [2]. In the microbuckling model, the compressive failure was assumed triggered because of fiber microbuckling imbedded in the matrix as shown in Figure 10. By taking into account the nonlinear behavior of the matrix in the bifurcation buckling analysis, Sun and Jun derived the compressive strength of unidirectional fiber composites as
f ep m c 11 c 1 G − = σ (1) where ep m
G is the elastic–plastic tangent shear modulus of the matrix, and cf denotes the fiber
volume fraction of the composites. According to eqn (1), it is implied that the compressive strength of the composites can be enhanced if the tangent shear modulus of the matrix is improved. From our previous experiments on the constitutive behaviors of silica/epoxy nanocomposites [15], it was revealed that the Young’s modulus of the epoxy matrix was effectively modified by using silica nanoparticles as shown in Figure 11. The improvement occurred not only in the elastic part but also in the nonlinear ranges. Thus, the corresponding tangent modulus of the matrix could be efficiently modified by the nanoparticles and so was the tangent shear modulus if the isotropic property was assumed in the silica/epoxy matrix system. In view of the forgoing, it is quite sensible that the compressive strengths of fiber composites can be appropriately enhanced by silica nanoparticles. In addition, it was depicted that the constitutive behavior of the epoxy matrix is influenced by the loading rate, and when the loading rates are increased, the epoxy materials would become stiffer [16]. Therefore, because of the stiffened behavior of matrix under dynamic loading, the dynamic compressive strengths of the fiber composites are higher than the quasi-static ones. It should be noted that the microbuckling stress given in eqn (1) is evaluated in the fiber direction (0 degree), and hence the compressive failure stresses as well as their sensitivity to the silica nanoparticles are dependent on the fiber orientation with respect to the loading direction.
On the other hand, for the 90o samples, although the failure mechanism is out of plane shear failure, the failure stresses are also improved by the silica nanoparticles. In order to further understand the enhancing mechanism caused by the silica nanoparticles, the failure surfaces of the samples were examined by the Scanning Electric Microscopy (SEM). The SEM micrographs on the fracture surfaces of the samples with pure epoxy resin and 30 wt% silica nanoparticles are compared in Figure 12. It is indicated that for the fiber composites with pure epoxy, the fiber surfaces are quite smooth and featureless without any matrix adhered. It is apparent that the interfacial debonding is the main failure
mechanism of the samples. On the contrary, for the fiber composites with a silica/epoxy matrix, the fiber surfaces were not clean, but they bonded with a little bit of epoxy matrix. Such epoxy adhesion indicates the interfacial bonding between the fiber and matrix was improved, and the interfacial debonding was effectively retarded. Thus, the corresponding improvement in the compressive strength of 90o samples could be a result of the enhanced interfacial bonding modified by the dispersed silica nanoparticles.
5. Conclusions
The compressive strengths of off-axis glass/epoxy nanocomposites with different silica nanoparticle loadings were experimentally investigated. Both quasi-static and dynamic compressive behaviors were determined, respectively, using a hydraulic MTS machine and a Hopkinson pressure bar. From experiments, it was revealed that the compressive strengths of 0o, 5o, 10o, and 15o specimens increase with the increment of nanoparticle loadings, and the increasing behaviors were observed in both dynamic and quasi-static cases. Moreover, the main failure modes of the samples were found to be the fiber microbuckling, and thus based on the fiber microbuckling model, and the enhancement could be due to the increment of the modulus of the epoxy matrix made by the silica nanoparticles. On the other hand, for the 90o samples, the compressive strengths were also improved by the silica nanoparticles. From SEM observations on the failure surfaces, it was indicated that the ascending phenomena could be ascribed to the improved interfacial bonding between fibers and surrounding epoxy caused by the silica nanoparticles.
Acknowledgments
This research was supported by the National Science Council, Taiwan, under the contract No. NSC 99-2221-E-009-023 to National Chiao Tung University.
References
1. Rosen, B.W. (1965). Mechanics of composite strengthening. In Fiber Composites Materials. American Society of Metals, Metals Park, OH: 35-75.
2. Sun C.T. and Jun A.W. (1994). Compressive Strength of Unidirectional Fiber Composites with Matrix Non-Linearity, Composites
Science and Technology, 52(4): 577-587.
3. Argon A.S. (1972). Treatise on Materials Science and Technology, 1: 1-79.
4. Budiansky B. and Fleck N.A. (1993). Compressive Failure of Fibre Composites,
Journal of the Mechanics and Physics of Solids, 41(1): 183-211.
5. Subramaniyan A.K. and Sun C.T. (2006). Enhancing Compressive Strength of Unidirectional Polymeric Composites Using Nanoclay, Composites: Part A, 31: 2257-2268. 6. Rosso P., Ye L., Friedrich K. and Sprenger S. (2006). A Toughened Epoxy Resin by Silica Nanoparticle Reinforcement, Journal of
Applied Polymer Science, 100(3): 1849-1855.
7. Johnsen B.B., Kinloch A.J., Mohammed R.D., Taylor A.C., and Sprenger S. (2007).
Toughening Mechanisms of Nanoparticle-Modified Epoxy Polymers,
Polymer, 48(2): 530-541.
8. Zheng Y. and Ning R. (2005). Study of SiO2 Nanoparticles on the Improved Performance of Epoxy and Fiber Composites, Journal of
Reinforced Plastics and Composites, 24(3):
223-233.
9. Uddin M.F. and Sun C.T. (2008). Strength of Unidirectional Glass/Epoxy Composite with Silica Nanoparticle-enhanced matrix,
Composites Science and Technology, 68:
1637-1643.
10. Adebahr T., Roscher C., and Adam J. (2001). Reinforcing Nanoparticles in Reactive Resins,
European Coatings Journal, 4: 144-149.
11. Ninan L., Tsai J. and Sun C.T. (2001). Use of Split Hopkinson Pressure Bar for Testing
Off-Axis Composites, International Journal of
Impact Engineering, 25(3): 291-313.
12. Graff K.F. (1975). Wave Motion in Elastic Solids, Dover Publications, New York.
13. Bazhenov S.L. and Kozey V.V. (1991).
Transversal Compression Fracture of Unidirectional Fibre-Reinforced Plastics,
Journal of Materials Science, 26(10):
2677-2684.
14. Yurgartis S.W. (1987). Measurement of small angle fiber misalignments in continuous fiber
composites. Composite Science and
Technology 30 (4): 279-293.
15. Tsai J.L., Hsiao H. and Cheng Y.L. (2007). Investigating mechanical behaviors of nanoparticle reinforced composites,
Proceedings of the ASC 22th technical conference. Seattle, September.
16. Chen W., Lu F. and Cheng M. (2002). Tension and Compression Tests of Two Polymers Under Quasi-Static and Dynamic Loading, Polymer Testing, 21: 113-121.
Table 1. Compressive strengths of 0 degree specimens with different silica contents.
Silica content (wt%) Quasi-Static compressive strength (MPa) Increment ratio (%) Dynamic compressive strength (MPa) Increment ratio (%) 0 415±18 — 678±7 — 10 452±13 9 706±14 4 20 445±20 7 703±6 4 30 460±16 11 720±22 6
Table 2. Compressive strengths of 5 degree specimens with different silica contents.
Silica content (wt%) Quasi-Static compressive strength (MPa) Increment ratio (%) Dynamic compressive strength (MPa) Increment ratio (%) 0 227±5 — 531±7 — 10 253±8 11 569±17 7 20 265±8 17 586±4 10 30 275±22 21 618±26 16
Table 3. Compressive strengths of 10 degree specimen with different silica contents.
Silica content (wt%) Quasi-Static compressive strength (MPa) Increment ratio (%) Dynamic compressive strength (MPa) Increment ratio (%) 0 154±3 — 363±2 — 10 166±10 8 400±20 10 20 163±7 6 387±6 5 30 179±7 16 408±5 12
Table 4. Compressive strengths of 15 degree specimens with different silica contents.
Silica content (wt%) Quasi-Static compressive strength (MPa) Increment ratio (%) Dynamic compressive strength (MPa) Increment ratio (%) 0 117±3 — 226±4 — 10 123±2 5 252±12 12 20 124±1 6 242±4 7 30 138±6 18 261±20 15
Table 5. Compressive strengths of 90 degree specimens with different silica contents.
Silica content (wt%) Quasi-Static compressive strength (MPa) Increment ratio (%) Dynamic compressive strength (MPa) Increment ratio (%) 0 46±1 — 77±2 — 10 52±1 13 96±7 25 20 47±1 2 86±3 12 30 60±2 30 112±5 45 6.0 mm 6.0 mm 8.0mm x1 x2 θ 6.0 mm 6.0 mm 8.0mm x1 x2 θ
(a) 50000 (b) 100000
Figure 2. TEM micrographs of epoxy/silica nanocomposites. (20 wt% silica nanoparticles)
Specimen Tungsten carbide Self adjust
fixture
Specimen Tungsten carbide Self adjust
fixture
Figure 3. Schematic of quasi-static compression tests
Striker bar Incident bar Transmission bar Throw-off bar Pulse shaper Gage A Gage B
Specimen
Striker bar Incident bar Transmission bar Throw-off bar Pulse shaper Gage A Gage B
Specimen
Striker bar Incident bar Transmission bar Throw-off bar Pulse shaper Gage A Gage B
Specimen
Striker bar Incident bar Transmission bar Throw-off bar Pulse shaper Gage A Gage B
Specimen
Figure 4. Schematic of Split Hopkinson Pressure Bar fixture Time(μs) Vo lt a g e (v ) 0 100 200 300 400 -2 -1 0 1 2 3 4 Incident Transmission
Figure 5. Typical incident and transmission signals obtained from Split Hopkinson Pressure Bar tests.
Time(μs) Fo rc e (K N ) 0 20 40 60 80 0 5 10 15 20 25 P1 P2
Figure 6. Time histories of the contact forces for 5 degree off-axis specimen
(a) (b)
Figure 7. Microbuckling failure mechanism for 0 degree specimens ((a) pure epoxy resin, (b) 30wt% silica nanoparticles)
(a) (b)
Figure 8. Microbuckling failure mechanism for 5 degree specimens ((a) pure epoxy resin, (b) 30wt% silica nanoparticles)
(a) (b)
Figure 9. Out-of-plane shear failure mechanism for 90 degree specimens ((a) pure epoxy resin, (b) 30wt% silica nanoparticles)
Figure 10. Microbuckling model.
Strain S tre s s (M P a ) 0 0.01 0.02 0.03 0.04 0.05 0.06 0 10 20 30 40 50 60 70 80 Neat epoxy Silica - 10wt% Silica - 20wt% Silica - 40wt%
Figure 11. Stress and strain curves of silica/epoxy nanocomposites with different silica loading.
(a) (b)
Figure 12. SEM photos on the failure surfaces of 90 degree samples ((a) pure epoxy resin, (b) 30 wt% silica particles).
行政院國家科學委員會補助國內專家學者出席國際學術會議報告
99 年 10 月 2 日 報告人姓名 蔡佳霖 服務機構及職稱 交通大學機械工程系 教授 時間 會議 地點 99 年 9 月 14 日至 99 年 9 月 18 日 Jeonbuk Korea 本會核定 補助文號 NSC 99-2221-E-009-023 會議 名稱 (中文) 第 3 屆國際多功能材料及結構會議 (英文) The 3rdInternational Conference on Multi-Functional Materials and Structures
發表 論文 題目
(中文)探討粉體對奈米複合材料拉伸強度之影響
(英文) Investigating Particle Effect on Tensile Strength of Particulate Nanocomposites
報告內容:
第三屆國際多功能材料及結構會議於2010年9月14日至9月18日在韓國全州省
政府會議廳舉行,筆者於9/14(二)上午12:50搭乘泰航班機由台北出發直飛韓
國首爾仁川機場,於下午4:30到達。接著搭乘巴士到達本次會議所在地全州,
車程約四個小時,當晚入住旅館休息。第二天上午十點,筆者參加大會開幕
典禮,並接著由美國喬治亞理工大學Prof. R. M. Nerem 做大會演講,題目
為Biotechnology Research in the 21th century。此次會議共有二百餘篇
論文發表,內容包含材料破壞分析,檢測及環境影響等,會議過程十分緊湊,
每天同時有六個會議室排定口頭發表論文、全體出席的演講(plenary section)
及poster section的安排。會場亦有書商展示期刊及最新的複合材料相關書籍,
可讓與會人士瀏覽並了解最新的出版資訊。筆者論文被安排在9月17日上午
8:30 於 Damage Identification and properties / integrity session 中
發表,筆者亦為此session 的主持人。值得一提的是,筆者發表論文榮獲此
次會議最佳論文獎。(詳下圖)
對筆者而言, 能有機會跟國際知名學者一起切磋,對個人研究水準提昇不
少,出國參加研討會,是提昇自我並學習的好機會,也能夠了解到目前最近
科技發展,以免閉門造車,也建議國科會能儘量補助教授出國開會以拓展國
際視野。 本次會議筆者攜回會議手冊一本,其內容為會議日程表、會場配
置圖及發表論文摘要,另攜回參展覽廠商傳單多份。
The 3rd International Conference on Multi-Functional Materials and Structures
MFMS 2010
September 14 – 18, 2010Jeonbuk Provincial Government Jeonju, Korea
MFMS 2010 Secretariat
LETTER OF INVITATION
August 3th ,2010
Prof. Jia-Lin Tsai
Paper No. :
P_1042
Paper Title : Investigating Particle Effect on Tensile Strength of Particulate Nanocomposites
As an Organizing Committee Chair of the 3rd International Conference on Multi-Functional Materials and Structures (MFMS 2010), I am honored to invite you to the valuable conference, which will be held at Jeonju, Korea for the period from September 14-18, 2010.
MFMS 2010 is mainly focused on multi-functional materials and structures for different engineering applications ranging from smart materials, composite, nanostructure and nano-technology to bio engineering materials.
I sincerely hope that you have an opportunity to broaden both your knowledge and networking on Multi-Functional Materials and Structures in the wonderful city, Jeonju, in Korea.
I am looking forward to seeing you at Jeonju.
Sincerely Yours,
Joong Hee Lee Organizing Committee Chair of MFMS 2010
Investigating Particle Effect on Tensile Strength of Particulate
Nanocomposites
Jia-Lin Tsai
1,aand Yi-An Lin
2,b1Department of Mechanical Engineering, National Chiao Tung University, Hsinchu, Taiwan 2Department of Mechanical Engineering, National Chiao Tung University, Hsinchu, Taiwan
a[email protected], b[email protected]
Keywords: Particulate nanocomposites, Strain energy release rate, Fracture mechanics
Abstract. This research aims to investigate the effects of particle size, volume fraction and dispersion
on the tensile strengths of particulate nanocomposites with an embedded crack. The finite element micromechanical model in conjunction with linear elastic fracture mechanics (LEFM) was used to study the particle effect on the fracture behavior of nanocomposites. Results indicated that the tensile strength of particulate composites increases when the particle size is decreasing, however it can be deduced dramatically by the local aggregation of particles. The simulation results are in good agreement with the experimental observation. In addition, the predictions show that the tensile strength decreases with the increase of volume fraction of nanoparticles. So far, no consistent experimental data can be found to validate the above results and thus further study in this issue is required.
Introduction
With the development of nanotechnology, the particles in nano-sizes have been utilized as reinforcement in nanocomposite. Experimental observation revealed that the mechanical properties of the particulate nanocomposites are dependent on the particle size, particle dispersion, and particle volume fraction. Cho et al. [1] performed tensile test on Vinyl ester based nanocomposites indicating that in the micro-scale, the tensile strength increases as the particle sizes decrease. While, at nano-scales, because of the particle aggregation, the particle size effect is not apparent in their study. The similarly tendency that the strength of the nanocomposites increases as the particle size decreases can also be found in the literature [2, 3]. In addition to the size, the dispersion is another essential factor influencing the mechanical responses of the nanocomposites. Fekete et al. revealed that as the particle size is less than a critical value, the severe particle aggregation would take place resulting in the reduction of the tensile strength [4]. In this study, the influence of particle size, volume fraction and particle aggregation on the tensile strength of the nanocomposites were investigated based on the linear elastic fracture mechanics (LEFM) in conjunction with the finite element analysis.
Linear Elastic Fracture Mechanics
In the theory of LEFM, stress intensity factor (SIF) and strain energy release rate (SERR) are the two parameters generally introduced in modeling the fracture behaviors of continuum solids. Although the two quantities were developed based on different physical concepts (one is from the local stress/displacement filed, and the other is from energy variation), they can be adopted alternatively in predicting the onset of the crack embedded in a continuum solid. In this study, the SERR, due to its simplicity in finite element analysis, was employed to measure the fracture behavior of the nanocomposites. It is noted that in the following analysis, the nanocomposites was assumed to be a continuum solid and the nanoparticles as well as the surrounding matrix are linear elastic materials.
The SERR basically defines the measurement of change in strain energy associated with an infinitesimal crack extension, and when it reaches a critical value, the crack begins to propagate. Irwin [5] proposed a crack closure integral to evaluate the SERR in a cracked solid. By following the
[
f (u u ) f (u u )]
a 2 1 lim G p2' y 2 p y 4 p y ' 1 p y 1 p y 3 p y 0 a I =δ→ δ − + − (1)[
f (u u ) f (u u )]
a 2 1 lim G p2' x 2 p x 4 p x ' 1 p x 1 p x 3 p x 0 a II =δ→ δ − + − (2)where GI indicate Mode I SERR and GII represent Mode II SERR. In addition, f and xp3 fyp3 denotes the nodal force at node p3 in the x and y directions, respectively and p4
x
f and p4 y
f denotes the nodal force at node p4 in the x and y direction, respectively. p1
x
u and p1 y
u are the displacement components at node p1, and similar definition was applied on nodes p2, p1’ and p2’ as shown in Fig. 1. It is noted the above formulation is derived based on the 8-node 2-D element and the corresponding element size near the crack tip should be at least 1% less than the crack length.
p3 a δ δa p1 p2 p3 p4 p1’ p2’ p3 x f 3 p y f 4 p x f 4 p y f p3 a δ δa p1 p2 p3 p4 p1’ p2’ p3 x f 3 p y f 4 p x f 4 p y f
Fig. 1 Crack closure method employed in the 8-node 2-D element for finite element analysis
Effective Properties 40L L 60L Effective Properties 40L L L 60L Effective Properties 40L L 60L Effective Properties 40L L L 60L Effective Properties 40L L 60L Effective Properties 40L L L 60L (a) (b) (c)
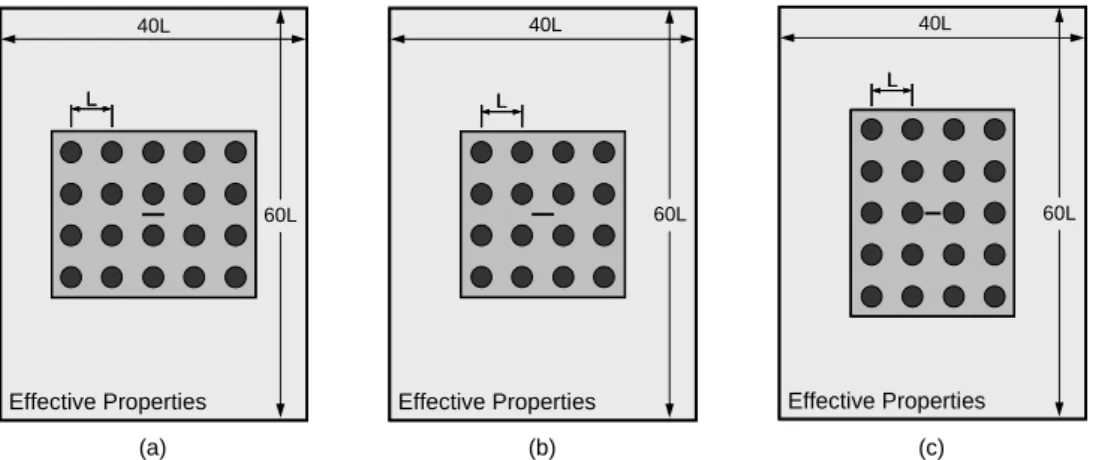
Fig. 2 Embedded FEM models for particulate composites with crack at different locations (crack length is 2a)
Finite Element Model
The finite element micromechanical models as shown in Fig. 2 were proposed to simulate the tensile strength of particulate nanocomposites with a crack. Three different crack locations were considered in the analysis. It is noted in the finite element models, only the microstructures around the crack are constructed explicitly and the rest area was represented using effective properties. The purpose for generating the embedded model is to save the computer cost since only the stress states near the crack tip in conjunction with the microstructures are essential to the fracture behavior of the nanocomposites. In the microstructure model, the particles were assumed to be distributed uniformly within the matrix and thus the corresponding effective properties for the homogeneous configuration were calculated from the micromechanics model [8] and then utilized in the finite element model to represent the material properties.
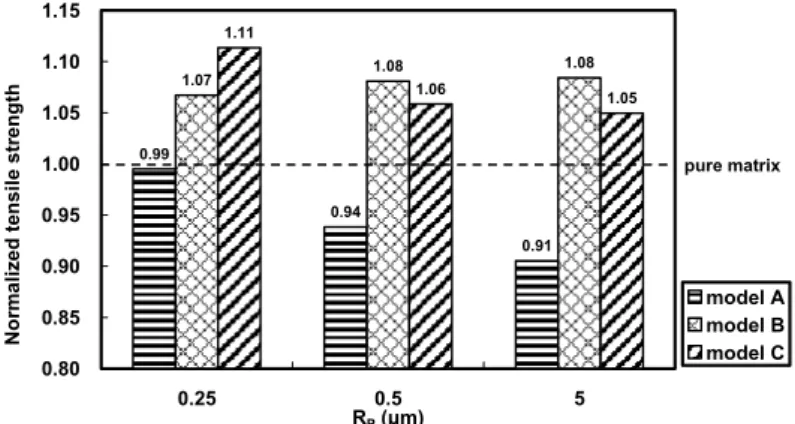
Fig. 3 demonstrates the particle size effect on the tensile strength of the nanocomposites. The obtained values were normalized with respective to the strength in the pure matrix associated with the same crack length. It can be seen that the model A is the critical case that the corresponding strength is much less than those obtained from the other two models. As a result, when the crack is distributed randomly in the materials, the tensile strength of the nanocomposites would be dominated by the crack located vertically between two particles as denoted by model A. Moreover, it is found that as the particle size increase, the failure stress decreases accordingly, which is quite coincided with the experimental observations [2, 3]. 0.99 0.94 0.91 1.07 1.08 1.08 1.11 1.06 1.05 0.80 0.85 0.90 0.95 1.00 1.05 1.10 1.15 0.25 0.5 5 RP (μm) Norm aliz ed te nsile str e ngth model A model B model C pure matrix
Fig. 3 Normalized tensile strength of the nanocomposites with different particle sizes (volume fraction is 5 vol% and half crack length “a” is 0.5 μm)
Effect of Particle Volume Fraction
The influence of particle volume fraction on the tensile strength of nanocomposites is shown in Fig. 4. It is apparent that as the particle volume fraction increases, the normalized tensile strength for the model A (the critical case) is decreasing. Therefore, the addition of the nanoparticle into nanocomposites may not enhance the tensile strength although the stiffness can be modified accordingly by the nanoparticles.
0.91 0.84 0.74 1.38 1.18 1.08 1.34 1.12 1.05 0.0 0.2 0.4 0.6 0.8 1.0 1.2 1.4 1.6 5 10 20 Volume fraction (%) N o rm al iz ed t ens ile s tr engt h model A model B model C pure matrix
Fig. 4 Normalized tensile strength of the nanocomposites with different particle volume fractions (particle size is 5 μm and half crack length “a” is 0.5 μm)
Effect of Particle Aggregation
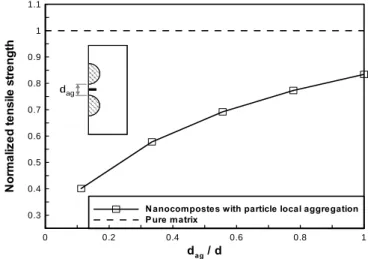
The particle aggregation is usually observed in the morphology of nanocomposites. However, its effect on the tensile strength of nanocomposites was seldom explored before. According to our earlier investigation, it is found the model A is the critical case in predicting the strength of
aggregation effect by adjusting the intra-particle spacing dag between the two neighboring particles. It can be seen from Fig. 5 that as the spacing between the particle decreases (aggregation taking place), the associated tensile strength is decreasing. In order to have better mechanical behaviors, the nanocomposites with well dispersed nanoparticles should be accomplished during the fabrication process. dag/ d N o rm a liz e d te n sile st re n g th 0 0.2 0.4 0.6 0.8 1 0.3 0.4 0.5 0.6 0.7 0.8 0.9 1 1.1
Nanocompostes with particle local aggregation Pure matrix
dag dag
Fig. 5 Effect of particle local aggregation on the normalized tensile strength of nanocomposite
Summary
In this study, a micromechanical finite element model was developed to characterize the tensile strength of particulate nanocomposites with an embedded crack. By means of the linear elastic fracture mechanics theory, the influences of particles size, volume fraction and dispersion on the cracked nanocomposites were investigated systematically. It was revealed that the nanocomposites with particles included exhibit less tensile strength than the pure resin, although the corresponding stiffness of the nanocomposites can be improved by the particles. Furthermore, when the particle size increases, the decreasing behavior in tensile strength is appreciable. In addition, when the particle volume fraction increases, the corresponding tensile strengths are also decreasing. Furthermore, the particle aggregation is another important factor to reduce the tensile strength of the nanocomposites.
References
[1] J.Cho, M.S. Joshi and C.T. Sun: Compos. Sci. Technol. Vol. 66 (2006), p. 1941 [2] J. Leidner, R.T. Woodhamss: J. Appl. Polym. Sci. Vol. 18 (1974), p. 1639
[3] L. Jiang, Y.C. Lam, K.C. Tam, T.H. Chua, G.W. Sim and L.S. Ang: Polymer Vol. 46 (2005), p. 243
[4] E. Fekete, Sz. Molnár, G.-M. Kim, G.H. Michler and B. Pukánszky, Aggregation: J. Macromol. Sci. Phys. Vol. 38 (1999), p. 885
[5] G.R. Irwin: J. Appl. Mech. Vol. 24(1957), p. 361
[6] E.F. Rybicki and M.F. Kanninen: Eng. Fract. Mech. Vol. 9 (1977), p. 931 [7] C.J. Jih and C.T. Sun: Eng. Fract. Mech. Vol. 37 (1990), p. 313
行政院國家科學委員會補助國內專家學者出席國際學術會議報告
100 年 9 月 2 日 報告人姓名 蔡佳霖 服務機構及職稱 交通大學機械工程系 教授 時間 會議 地點 100 年 8 月 21 日至 100 年 8 月 26 日 Jeju, Korea 本會核定 補助文號 NSC 99-2221-E-009-023 會議 名稱 (中文) 第十八屆國際複合材料會議(英文) The 18th International Conference on Composite Materials (ICCM-18)
發表 論文 題目
(中文)利用多尺度模擬來探討奈米碳管力量傳遞效率
(英文) Characterizing load transfer efficiency in carbon nanotubes nanocomposites using multiscale simulation
報告內容:
一、參加經過
此行主要目的係出席第 18 屆國際複合材料會議( 18th
International Conference on Composite Materials),並於 8 月 26 日上午 Multi-scale modeling session 中發表論文。 此外,藉由積極參與此會,提昇台灣在國際複合材料研究領域的知名度。第 18 屆國際 複合材料會議於 2011 年 8 月 21 日至 8 月 26 日在韓國濟州島國際會議中心舉行,此會 議每兩年舉辦一次,是目前全球複合材料領域最大會議,主要在世界主要大城市輪流 主辦。筆者於 8 月 23 日晚上 6 時 30 分搭乘復興航空公司班機,由台北直飛濟州,當 晚抵達飯店 第二天抵達本次會議所在地─濟州島國際會議中心。此次會議計有 1300 餘篇論文發表,內容包括複合材料製造、分析及破壞,環境溫度與溼度影響及近年來 最熱門之奈米複合材料及複合材料風力葉片。此次會議中,共邀請 18 位學者專家做 plenary lecture,其中值得一提的是 Prof. O. T. Thomsen 主持有關複合材料風力葉片未來 之研究發展與挑戰。Prof. O.T. Thomsen 去年十一月受邀到交通大學機械系,擔任風能 研討會的主講者。目前筆者正從事複合材料風力葉片相關研究,因此對於筆者未來在 複合材料風力葉片研究有極大助益。
二、心得 此次會議出席人員均為全球知名大學教授及其研究生,讓筆者驚訝的是中國地區 及其他亞洲國家(如日本 韓國),學生用英文作 presentation 的能力及技巧已大幅增進, 並凌駕於台灣學生之上,因此我們必須更加強研究生的英文能力,以增強台灣在國際 上的競爭力。此外,參加大型國際會議對於一個年輕學者而言,是吸收最新知識的最 佳途徑,筆者在此非常感謝國科會及交大研發處的補助。圖為筆者於會場照片。 . 三、建議 希望能夠補助一些優秀研究生出國參加國際會議,以擴展其國際視野
。
四、攜回資料名稱及內容 Conference Proceedings 1 份ICCM
18
The 18th International Conference on Composite Materials August 21-26, 2011, ICC Jeju, Jeju Island, Korea http://www.iccm18.org
April 25, 2011 Jia-Lin Tsai
Department of Mechanical Engineering National Chiao Tung University
Taiwan
Email: [email protected]
Dear Dr. Jia-Lin Tsai,
Thank you for your deep support and interest in the ICCM18.
With your active participation, over 1,800 abstracts from 61 countries have been submitted on the ICCM18. On behalf of the ICCM18 organized committee, we are pleased to inform you that your abstract has been accepted for Oral presentation at the conference.
Please confirm the detailed presentation schedule as follows. Ⅰ. Presentation Information
Presentation Type Oral
Session Category Atoms to Aircraft Presentation Title
CHACTERIZING LOAD TRANSFER EFFICIENCY IN CARBON NANOTUBES NANOCOMPOSITES USING MULTISCALE SIMULATION
Ⅱ. Information
- The deadline for paper submission is May 31, 2011.
- All authors whose abstracts are accepted should submit the full paper up to 4 pages maximum
including pictures and diagrams.
- With the paper submission, fill out the final summary within 50 words in the online system. Ⅲ. Registration
The presenter should make pre-registration for the conference by May 31th, 2011. For smooth symposium operation, the speaker who does not register by the pre-registration deadline can be withdrawn in the schedule. Please visit our website (http://www.iccm18.org).
Should you have any inquiries, please feel free to contact us. Thank you again for your cooperation.
Best regards,
WOO IL LEE
Chairman of organizing committee ICCM18
ICCM18 Secretariat
1F Haeoreum Bldg., 748-5 Yeoksam-dong, Gangnam-gu, Seoul 135-925, Korea Tel: +82-2-566-5920, 5950 Fax: +82-2-566-6087 E-mail: [email protected]
18TH INTERNATIONAL CONFERENCE ON COMPOSITE MATERIALS
1. Introduction
The load transfer efficiency from the matrix to the carbon nanotubes (CNTs) plays an important role in the mechanical response of the CNTs nanocomposites since it may affect the effectiveness of the nano-reinforcements. In this study, the load transfer efficiency from a surrounding matrix to the CNTs was examined using multi-scale simulations. Both single-walled carbon nanotubes (SWCNTs) and double-walled carbon nanotubes (DWCNTs) were taken into account in the investigation. The atomistic behaviors between the adjacent graphite layers in DWCNTs were characterized by molecular dynamics (MD) simulation, from which a cylindrical DWCNTs continuum model was established. Subsequently, a representative volume element (RVE) containing the hollow cylindrical continuum (denoting the CNTs) and matrix was proposed and employed in the finite element analysis for characterizing the axial stress distribution as well as the load transfer efficiency of the CNTs.
2. Molecular Dynamics Simulation
For the DWCNTs, two kinds of interactions, i.e. van der Waals (vdW) force and artificial build-up covalent bonds were regarded as the atomistic interaction of the adjacent graphite layers. In order to evaluate the atomistic intensity of the adjacent graphite layers, the outer graphite layer was extended with respect to the inner layer in MD simulation as shown in Figure 1. Both the extension of the outer layer and the reaction of the inner layer were recorded during the simulation. Based on the results, a two-layer hollow cylindrical continuum model in which the interaction of the neighboring layers was modeled using spring element was proposed in this study. It is noted that the corresponding spring constants between the layers were determined so that the extension versus
simulation. As a result, the spring constants associated with the two interfacial properties (vdW interaction, covalent bonding) were determined. This two-layer hollow cylindrical continuum model proposed to represent the discrete atomistic structure of the DWCNTs was then embedded in the matrix to form a continuum model of nanocomposites.
3. Continuum Finite Element Analysis Model
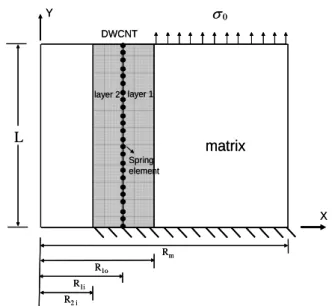
The continuum finite element analysis (FEA) model for the DWCNTs nanocomposites is introduced in Figure 2. By applying a loading σo , the corresponding stress distribution on the layer 1 and layer 2 can be evaluated directly from FEA analysis. It is noted that in Figure 2, the DWCNTs is perfectly bonded to the matrix and the interface between the graphite layers is modeled using the spring element as described earlier.
4. Results and Discussion
In order to effectively quantify the load transfer efficiency from the surrounding matrix to the SWCNTs, the concept of effective length is introduced as s 0 f eff f dy σ σ
∫
= L L (1)where
σ
f is the axial stress in the SWCNTs,and s f
σ
is the corresponding saturated stress. In the design of nanocomposites, the main concept is to facilitate the load applied on the materials being efficiently transferred into the reinforcement and then carried by the reinforcement. Indeed, the effective length can be regarded as an index to evaluate the effectiveness of the reinforcement embedded in the matrix. When the effective lengthCHACTERIZING LOAD TRANSFER EFFICIENCY IN CARBON
NANOTUBES NANOCOMPOSITES USING MULTISCALE
SIMULATION
Ting-Chu Lu, Jia-Lin Tsai*
Department of Mechanical Engineering, National Chiao Tung University, Hsinchu, Taiwan
* Corresponding author([email protected])
efficiency of the reinforcement is increasing, and the overall mechanical properties of the nanocomposites can be enhanced accordingly. When the effective length concept was extended into the DWCNTs, the effective length was calculated as
s 0 f1 f2 eff f 2 dy ) ( σ σ σ
∫
+ = L L (2)where
σ
f1 ,σ
f2 indicate the axial stress in layer1, and layer 2, respectively, and s f
σ
is the corresponding saturated stress of SWCNTs. Figure 3 illustrates the load transfer efficiency of SWCNTs and DWCNTs and DWCNTs with covalent bond. It is apparent that the covalent bond can effectively improve the load transfer efficiency of DWCNTs. However as compared to the SWCNTs, the improvement is still less. In addition, the increase of CNTs length basically can enhance the load transfer efficiency of CNTs nanocomposites.5. Conclusion
The atomistic interaction of adjacent graphite layers in DWCNTs was characterized using MD simulation, based on which a spring element was introduced as the interface in the continuum DWCNTs model. Afterwards, the continuum DWCNTs was embedded in the matrix to form a continuum nanocomposites from which the load transfer efficiency were determined. It was found that the load transfer efficiency increases with the increment of CNTs length. In addition, the DWCNTs with covalent bonds exhibit superior load transfer efficiency than those with only vdW interactions. In addition, the SWCNTs still possess the best load transfer efficiency as compared with DWCNTs even though there are covalent bonds in the DWCNTs. Therefore, to achieve better mechanical properties, SWCNTs instead of DWCNTs are suggested as reinforcements in the nanocomposites.
Fixed atoms
Extension of outer layer Fixed atoms
Extension of outer layer
X DWCNT layer 1 layer 2 Y matrix 0 σ L R1o R1i Spring element Rm R2 i X DWCNT layer 1 layer 2 Y matrix 0 σ L R1o R1i Spring element Rm R2 i
Figure 2. Continuum FEM model for DWCNTs nanocomposites. Length(Å) Lef f /L 0 100 200 300 400 500 0 0.2 0.4 0.6 0.8 1 SWCNTs DWCNTs
DWCNTs with covalent bond
Figure 3. Load transfer efficiency of SWCNTs and DWCNTs.
國科會補助計畫衍生研發成果推廣資料表
日期:2011/09/22國科會補助計畫
計畫名稱: 探討奈米顆粒對玻璃纖維複合材料動態及靜態壓縮強度之影響 計畫主持人: 蔡佳霖 計畫編號: 99-2221-E-009-023- 學門領域: 疲勞與損壞無研發成果推廣資料
99 年度專題研究計畫研究成果彙整表
計畫主持人:蔡佳霖 計畫編號:99-2221-E-009-023- 計畫名稱:探討奈米顆粒對玻璃纖維複合材料動態及靜態壓縮強度之影響 量化 成果項目 實際已達成 數(被接受 或已發表) 預期總達成 數(含實際已 達成數) 本計畫實 際貢獻百 分比 單位 備 註 ( 質 化 說 明:如 數 個 計 畫 共 同 成 果、成 果 列 為 該 期 刊 之 封 面 故 事 ... 等) 期刊論文 0 0 100% 研究報告/技術報告 1 0 100% 研討會論文 2 0 100% 篇 論文著作 專書 0 0 100% 申請中件數 0 0 100% 專利 已獲得件數 0 0 100% 件 件數 0 0 100% 件 技術移轉 權利金 0 0 100% 千元 碩士生 2 0 100% 博士生 3 0 100% 博士後研究員 0 0 100% 國內 參與計畫人力 (本國籍) 專任助理 0 0 100% 人次 期刊論文 1 0 100% 研究報告/技術報告 0 0 100% 研討會論文 2 0 100% 篇 論文著作 專書 0 0 100% 章/本 申請中件數 0 0 100% 專利 已獲得件數 0 0 100% 件 件數 0 0 100% 件 技術移轉 權利金 0 0 100% 千元 碩士生 0 0 100% 博士生 0 0 100% 博士後研究員 0 0 100% 國外 參與計畫人力 (外國籍) 專任助理 0 0 100% 人次其他成果
(
無法以量化表達之成 果如辦理學術活動、獲 得獎項、重要國際合 作、研究成果國際影響 力及其他協助產業技 術發展之具體效益事 項等,請以文字敘述填 列。)獲得 最佳論文獎 2010, International Conference on Multi-functional Materials and Structures, 14-18, September, Korea.
成果項目 量化 名稱或內容性質簡述 測驗工具(含質性與量性) 0 課程/模組 0 電腦及網路系統或工具 0 教材 0 舉辦之活動/競賽 0 研討會/工作坊 0 電子報、網站 0 科 教 處 計 畫 加 填 項 目 計畫成果推廣之參與(閱聽)人數 0