Abstract—This study aims to acquire the functional image of the rat brain, small animal positron emission tomography (microPET) with high resolution and sensitivity is adopted to assess the metabolic activity corresponding to the neuronal activity induced by the electrical stimulation of the rat tail using [18F] fluorodeoxyglucose (FDG) as the radiotracer. The microPET imaging technology can provide anatomical and functional information on neuronal activity used to analyze responses in pathway sequence relationships between the thalamus and the cerebral cortex.
Keywords—Electrical stimulation, fluorodeoxyglucose, microPET
I. INTRODUCTION
Understanding brain function is the ultimate challenge in neuroscience. The brain is an unresting assembly of cells that continually processes spatial distributed information, analyzes it, perceives it, and makes decisions. The newly developed technique, positron emission tomography (PET), enables neurologists to locate and observe neuron activities directly, follow their progress in the living brain, and make inferences regarding higher cortical functions[1-3]. PET is a noninvasive technique for providing visual information on blood flow, oxygen utilization, and glucose uptake to isolate local neural activity associated with sensory, motor, and cognitive function or with emotional process. Sensory systems are particularly well suited for PET studies because the experimenter controls the initiating event (the stimulus) and the subject can report the response (the perception)[4;5]. In the present study, a high spatial resolution PET scanner (microPET) is used to investigate the brain functions responding to the electrical stimulation.
II. METHODOLOGY
2.1 Animal preparations: Ten adult male Wistar rats
(250 -350 g) were used in the study, each of which had refrained from food for 24-h before scanning using microPET. Following anesthetizing with ketamine (50 mg/kg; i.p.), a scalp needle was intubated into the vein of tail via the injecting pump to continue to inject a low dosage of ketamine (15 mg/mL, 1 mL/h, i.v.) to maintain anesthesia depth, and a far infrared ray lamp was used to maintain animal body temperature.
2.2 Stereotaxic technique for the rat brain: A
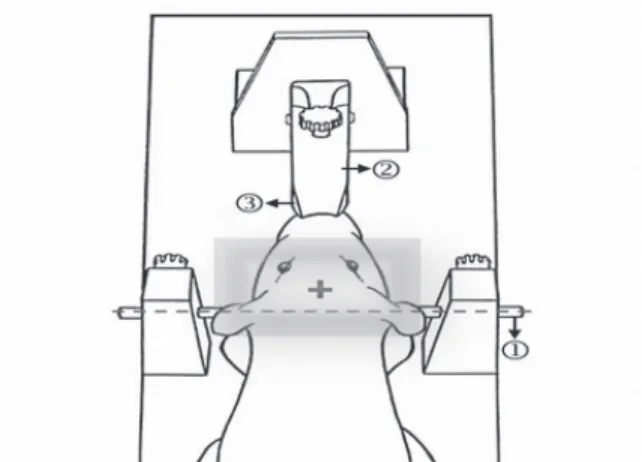
head-first/prone orientation then was used to place the head on the bed pallet of microPET. The bed pallet then was moved until the cross hair of the laser alignment system was
positioned 1 cm in front of the imaginary line between the centers of each ear bar of the stereotaxic apparatus (Fig. 1).
2.3 Stimulation and microPET imaging: [18F]FDG (3~3.5 mCi, 0.3 mL) was injected into the tail vein of the anesthetized rats. During the 30 min uptake period, electrical stimuli (ES) were applied to the rat-tail. When using electrical stimuli, the stainless steel needle was inserted into the left side of the tail (S2-S3) and a pulse of constant current source with a duration of 100µs and a frequency of 1 Hz (Digitimer DS2 and Axon isolator 11; Digitimer Ltd, UK) was used to directly elicit the nerve of the tail. To obtain a baseline measurement of FDG uptake as a reference to compare with the stimuli, a non-stimuli control experiment was applied to each rat. Following uptake, the quantitative dynamic scan was performed on each rat for 30 min using the commercial microPET system (R4, Concorde Microsystems, Knoxville, TN). The scan range was 8 cm in axial direction, and bregma was used as the center reference 4 cm in the front and back axially. 3D volumetric images were acquired 63 slices in 1 min frames using standard 3D-filtered back-projection (FBP) reconstruction[6-8]. The full width at half maximum (FWHM) of the FBP algorithm was 2 mm (spatial resolution) and the acquired rat brain image was 128 × 128 pixels per slice.
2.3 Data analysis: This study used medical image
analysis software, ASIPro™ (Concorde Microsystems, Inc, Knoxville, TN) and AMIDE[9], analyze region of interest (ROI) statistics. This technique could obtain radioactivity counts for various parts of the brain. The measured radioactivity in the dissected tissues was expressed as %ID per gram of tissue (%ID/g).
Fig. 1. Schematic representation of the rat brain positioned using to the stereotaxic apparatus to align the microPET system (Bregma Coordinate + microPET Coordinate = Final Coordinate). 1, ear bar; 2, nose bar; 3, incisor bar.
Dynamic evaluation of [
18F]-FDG uptake in the rat brain by microPET imaging
Y.Y.Chen
1, C. N. Chien
2, T.W Lee
3, Y.K Fu
3, T.S Kuo
1, F.S Jaw
21Institute of Electrical Engineering, National Taiwan University, Taipei, Taiwan, ROC 2Institute of Biomedical Engineering, National Taiwan University, Taipei, Taiwan, ROC 3Institute of Nuclear Energy Research, Atomic Energy Council, Taoyuan, Taiwan, ROC
0-7803-8439-3/04/$20.00©2004 IEEE 4461
Proceedings of the 26th Annual International Conference of the IEEE EMBS San Francisco, CA, USA • September 1-5, 2004
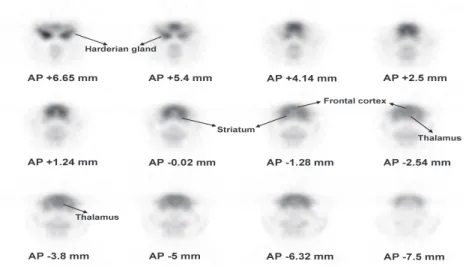
Fig. 2. MicroPET images of coronal sections through the rat brain. Images are arranged in order from rostral to caudal and the AP coordinates position the microPET images using the bregma as a reference point. The thickness of each image is ~ 1.26 mm.
III. RESULTS
3.1 Compare microPET images with the stereotaxic atlas of the rat brain
Figure 2 shows the coronal brain section along the anteroposterior (AP) direction using microPET. The ranking order of these images refers to the stereotaxic atlas rat brain of Paxinos and Watson[10]. Specifically, the ranking order uses bregma as the origin of the axial direction to progressively increase or decrease the coordinate position of every slice, and the interval between successive slices is around 1.26 mm (8 cm /63).
3.2 MicroPET images of neuronal activation
Figure 3 shows the neuronal activation in the cortex and thalamus under different stimuli using microPET scanning. Comparing ES with non-stimuli control revealed that the metabolic activity in the brain can be increased. The most excited neuronal activation induced ES is in the cortex (arrowhead) and thalamus (arrow).
Fig. 3. MicroPET scan in metabolic activity studies of brain activation during non-stimuli (left column), electrical stimuli (middle column).
3.3 Dynamic uptake of [18F]-FDG in the brain
Decay time activity curves were plotted to represent FDG uptake in rat (animal No. NTU-22) under non-stimuli control and electrical stimulated conditions (Fig.4). Static images were obtained 70 mins post-injection and tracer accumulation in the Region of Interests (ROI) in the thalamus and the somatosensory cortex were analyzed by Standard Uptake Value (SUV). The stimulation was initiated simultaneously with the injection of [18F]-FDG
when microPET scanning and a markedly increase in radiotracer uptake in the thalamus and somatosensory cortex to the electrical stimulation compared with non-stimuli control. The time-uptake curves of the thalamus and cortex increased and reached plateau in 15 mins and 30 mins, respectively, under the electrical stimulation. By 30 min after tracer injection, FDG uptake increased by 12% and 13% in the contralateral thalamus and somatosensory cortex, respectively as compared with the ipsilateral cortex under the electrical stimulation condition.
Fig. 4. Dynamic uptake of [18F]-FDG in the bilateral thalamus (A) and
somatosensory cortex (B) using microPET. SUV = average radioactivity concentration in ROI (nCi/mL) × body weight(gram)/ injected dose(nCi)
IV. DISCUSSION
A previous study attached three PVC tubes to rat craniums and injected high radioactivity [18F]FDG (1~3
MBq, 1 µL) into tubes to serve as markers for microPET scanning and proceed image position[11]. Meanwhile this study used the new brain stereotaxic technique, as described in 2.2, to precisely confirm microPET images in the stereotaxic atlas. The key advantage of this approach is reducing experimental time, and reducing the effect on the brain of anaesthetic used in additional surgery for brain positioning. Additionally, the rats subjected to this procedure (2.2) did not have any surgical wound for reducing the sensory stimulus on the neuronal activities in the brain, thus increasing the reliability of the microPET scanning information.
MicroPET can distinguish the metabolic activity of the brain, particularly the thalamus and cortex. The thalamus and cortex send and process sensory signals within somatic nervous system; therefore, these two locations have higher neuronal activity than other locations. This investigation found that regardless of whether the rat-tail is stimulated, the radioactivity of the bilateral thalamus exceeds that of the cortex. This disparity may result from the sensory signals from the peripheral nervous system being continually sent to the thalamus to excite the neuronal activity in the thalamus. Another possible reason is that the thalamus itself can also have spontaneous neural activity to regular some brain functions, even without external stimuli[12;13]. The thalamus displays more frequent nervous activity than any other part of the brain.
Comparing dynamic uptake induced by the electrical stimulation with non-stimulation reveals that the time-decay curves of the electrical stimulation are always higher in the
bilateral thalamus and cortex, indicating that the electrical stimulation induces more metabolic activities in the thalamus and cortex than does the non-stimulation. The inference is that the multiple sensations evoked by the electrical stimulation involve a larger responsive area and higher intensity of neuronal activation than the touch responses evoked by non-stimulation. Additionally, applying the electrical stimulation to the left side of the rat-tail revealed significant glucose metabolic activity in the ipsilateral thalamus and cortex. This phenomenon may result from the bilateral activation of pain sensation (mirror pain) induced by the electrical stimulation[14-17]. Previous human PET studies have utilized heat (> 45 oC) or cold (< 5 oC) to induce pain sensations in the brain and observed
bilateral changes in the functional metabolic activity of forebrain structures[5].
V. CONCLUSION
Our preliminary studies demonstrate that microPET has sufficient resolution to distinguish numerous structures in the brains of rats. Furthermore, microPET can distinguish the variations of metabolic activities responding to peripheral stimuli. We anticipate that microPET will enhance the use of in vivo rodent models in the study and development of novel therapeutics for epilepsy, brain injury, and other disorders of the brain.
ACKNOWLEDGMENT
The authors would like to thank Mrs. Li-Chiao Wu for helping the animal operations, Mr. Shyh-Yi Chyi for preparing [18F]FDG in this study. We also thank Mr.
Chuen-Shing Shyu and Mr. Kuo-Wei Chen for performing microPET scanning. This present study was supported by grants NSC-91-2213-E-002-119 from the National Science Council of the Republic of China, Taiwan.
REFERENCES
[1] Ghatan, P. H., Hsieh, J. C., Wirsen-Meurling, A., Wredling, R., Eriksson, L., Stone-Elander, S., Levander, S., and Ingvar, M., "Brain activation induced by the perceptual maze test: a PET study of cognitive performance," Neuroimage, vol. 2, no. 2, pp. 112-124, June1995.
[2] Martin, W. R., Powers, W. J., and Raichle, M. E., "Cerebral blood volume measured with inhaled C15O and positron emission tomography," Journal of Cerebral Blood Flow and Metabolism, vol. 7, no. 4, pp. 421-426, Aug.1987.
[3] Videen, T. O., Perlmutter, J. S., Herscovitch, P., and Raichle, M. E., "Brain blood volume, flow, and oxygen utilization measured with 15O radiotracers and positron emission tomography: revised metabolic computations," Journal of Cerebral Blood Flow and Metabolism, vol. 7, no. 4, pp. 513-516, Aug.1987. [4] Casey, K. L., Minoshima, S., Berger, K. L., Koeppe, R. A.,
Morrow, T. J., and Frey, K. A., "Positron emission tomographic analysis of cerebral structures activated specifically by
repetitive noxious heat stimuli," Journal of Neurophysiology, vol. 71, no. 2, pp. 802-807, Feb.1994.
[5] Casey, K. L., Minoshima, S., Morrow, T. J., and Koeppe, R. A., "Comparison of human cerebral activation pattern during cutaneous warmth, heat pain, and deep cold pain," Journal of Neurophysiology, vol. 76, no. 1, pp. 571-581, July1996. [6] Chatziioannou, A. F., Cherry, S. R., Shao, Y., Silverman, R. W.,
Meadors, K., Farquhar, T. H., Pedarsani, M., and Phelps, M. E., "Performance evaluation of microPET: a high-resolution lutetium oxyorthosilicate PET scanner for animal imaging," Journal of Nuclear Medicine, vol. 40, no. 7, pp. 1164-1175, July1999.
[7] Chatziioannou, A., Qi, J., Moore, A., Annala, A., Nguyen, K., Leahy, R., and Cherry, S. R., "Comparison of 3-D maximum a posteriori and filtered backprojection algorithms for high-resolution animal imaging with microPET," IEEE Transactions on Medical Imaging, vol. 19, no. 5, pp. 507-512, 2000. [8] Loening, A. M. and Gambhir, S. S. A completely free system
for medical imaging data analysis. Journal of Nuclear Medicine 42[5], 192P. 2001. Journal of Nuclear Medicine.
[9] AMIDE(a Medical Imaging Data Examiner). [0.7.14 (gtk 2.0)]. 2003. Free Software Foundation . Gnu general public license. Available: http://amide.sourceforge.net/.
[10] Paxinos, G. and Watson, C., The rat brain in stereotaxic coordinates, 4th ed. New York: Academic Press, 1998. [11] Rubins, D. J., Meadors, A. K., Yee, S., Melega, W. P., and
Cherry, S. R., "Evaluation of a stereotactic frame for repositioning of the rat brain in serial positron emission tomography imaging studies," Journal of Neuroscience Methods, vol. 107, no. 1-2, pp. 63-70, May2001.
[12] Lenz, F. A., Kwan, H. C., Martin, R., Tasker, R., Richardson, R. T., and Dostrovsky, J. O., "Characteristics of somatotopic organization and spontaneous neuronal activity in the region of the thalamic principal sensory nucleus in patients with spinal cord transection," Journal of Neurophysiology, vol. 72, no. 4, pp. 1570-1587, Oct.1994.
[13] Saleh, T. M. and Cechetto, D. F., "Peptides in the parabrachial nucleus modulate visceral input to the thalamus," AJP - Regulatory, Integrative and Comparative Physiology, vol. 264, no. 4, pp. R668-R675, Apr.1993.
[14] Aloisi, A. M., Porro, C. A., Cavazzuti, M., Baraldi, P., and Carli, G., "'Mirror pain' in the formalin test: behavioral and 2-deoxyglucose studies," Pain, vol. 55, no. 2, pp. 267-273, Nov.1993.
[15] Coghill, R. C., Sang, C. N., Maisog, J. M., and Iadarola, M. J., "Pain intensity processing within the human brain: a bilateral, distributed mechanism," Journal of Neurophysiology, vol. 82, no. 4, pp. 1934-1943, Oct.1999.
[16] Mao, J., Mayer, D. J., Hayes, R. L., and Price, D. D., "Spatial patterns of increased spinal cord membrane-bound protein kinase C and their relation to increases in 14C-2-deoxyglucose metabolic activity in rats with painful peripheral
mononeuropathy," Journal of Neurophysiology, vol. 70, no. 2, pp. 470-481, Aug.1993.
[17] Morrow, T. J., Paulson, P. E., Danneman, P. J., and Casey, K. L., "Regional changes in forebrain activation during the early and late phase of formalin nociception: analysis using cerebral blood flow in the rat," Pain, vol. 75, no. 2-3, pp. 355-365, Apr.1998.
![Fig. 4. Dynamic uptake of [ 18 F]-FDG in the bilateral thalamus (A) and somatosensory cortex (B) using microPET](https://thumb-ap.123doks.com/thumbv2/9libinfo/8854304.243315/3.918.89.432.119.378/dynamic-uptake-bilateral-thalamus-somatosensory-cortex-using-micropet.webp)
