Wireless Sensor Network Enabled Servo Velocity Sensors for
Bridge Vibration
Yao-Chiang Kan1, Chi-Chang Lin2, Wen-Pei Sung3, Hsueh-Chun Lin4, and Yao-Ming Hong*5
1Department of Communications Engineering, Yuan Ze University, Taoyuan, Taiwan 2Department of Civil Engineering, National Chung Hsing University, Taichung, Taiwan
3Department of Landscape Architecture, National Chin-Yi University of Technology,Taichung, Taiwan 4Department of Health Risk Management, China Medical University, Taichung, Taiwan
5Department of Design for Sustainable Environment, MingDao University, Changhua, Taiwan
E-mail: blueway@mdu.edu.tw
Tel: +886-4-8876600 ext. 8613; Fax: +886-4-8886927
Abstract
The servo velocity sensors (SVS) provide the reliable and accurate velocity and acceleration measurements of the civil infrastructures, such as bridges and buildings. However, most SVSs communicate with the data processing unit through wired cable and this impedes the on-time and continuous monitoring applications using SVS. In this study, a mote-integrated converter module is designed and implemented to bridge SVS and wireless sensor networks (WSN). The proposed WSN-enabled SVS is verified by comparing measured results with those from the purchased commercial system in a bridge scour experiment, applied to a corridor bridge vibration measurement, and employed in a suspension bridge vibration test. Several guidelines of the deployment and installation of this WSN-enabled SVS in a vibration monitoring application are carefully addressed and suggested. With optimized deployment scheme which reduce the packet loss efficiently, this WSN-enabled SVS can be applied to continuous monitoring applications definitely.
Keywords: WSN, Velocity Sensor, Bridge Vibrations
1. Introduction
Bridge safety and management is a critical issue in countries which often suffer multiple nature threats such as earthquakes and hurricane. Both contact and non-contact monitoring technologies have been developed with alerting systems relative to monitor the bridge vibration. Some non-contact vibration monitoring solutions are based on the reflections of laser or microwave [1] and others on image and video processing [2]. Structural health monitoring (SHM) typically works with the expensive wired contact system like the tethered sensing system [3]-[5] that usually employs the accelerometer or servo velocity sensor (SVS). However, a more sensitive SVS is preferred for measuring vibration of normal concrete bridges or buildings. In general, SVSs are deployed on monitored bridge and the wired cables are connected from SVSs to the base station that processes transmitted data. To overcome cost and inconvenience of the wired system, several wireless sensing units are proposed and demonstrated in the past decade. The most well-known system, named WLL (Wang, Lynch, Law) system [6][7] in this paper, consists of five components: sensor signal processing, signal digitization, computational core, and wireless communication unit. The wireless network topology in this proprietary system is the star topology. In the literature, total 25 nodes deployed for ambient vibration study of a steel arch bridge have been reported [8]. Most of the applications of WLL system thus focus on structure vibration of civil engineering without considering network data transmission and power issues [9]. Another
low-cost wireless sensing unit (WSU), based on the Wi-Fi [10], is designed with AC-powered unit and is deployed in the dense wireless mesh network to monitor vibration of the suspension bridge.
In this study, a WSN-enabled SVS is developed for continuously monitoring the bridge vibration. All of the five components within WLL system as well as the power regulator portion are integrated onto a printed circuit board, called the converter module. Another DC-to-DC power circuit is also built and located in the battery enclosure. The proposed design is validated by an in-house testing with multi-node wireless transmission. Then a four-node field measurement is executed to assess the scalability. Some suggestions and conclusions are finally addressed at the end of this paper.
2. The Converter Module
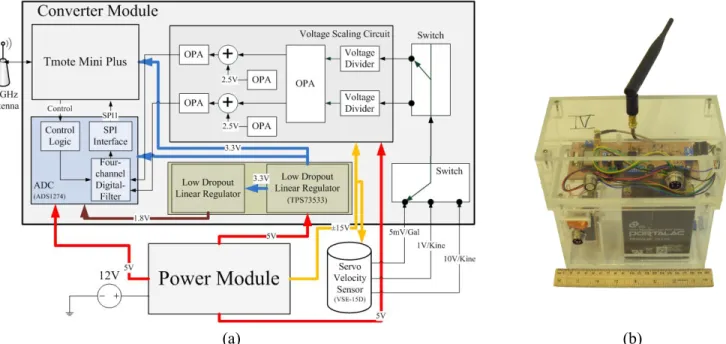
The converter module reads accelerations or velocities from the SVS and then wirelessly transfer sensed kinetic parameters back to the gateway. As shown in Fig.1 (a), the designed converter module includes a Tmote mini plus, an external dipole antenna, a 24-bit analog to digital converter (ADC), the voltage scaling circuit, two switches, and the DC-to-DC voltage converter. The picture of the WSN-enabled SVS system including the antenna, the converter module, the power module, a battery, and SVS is shown in Fig.1 (b). The Tmote mini plus with a built-in 20dB power amplifier (PA) which not only enlarges the wireless transmission distance but also provides flexible deployment of sensor nodes for diverse applications. To meet the requirements of the bridge vibration measurement, several issues of the converter module are addressed below.
(a) (b)
Fig. 1. (a) The function blocks of the proposed WSN-enabled SVS and (b) the picture of the converter and battery modules.
The power module for the proposed WSN-enabled SVS is separated from the converter module to provide the flexibility of using AC or a battery. The current consumption of the servo velocity sensor, VSD-15D, is around 50 to 60mA if the SVS is connected to a power supply. In addition, one 12V lead-acid rechargeable battery, a DC-to-DC (12V to 15V) converter, and a DC-to-DC (12V to 5V) converter have been employed. The total current consumption of the proposed converter module with the SVS is about 200mA and the battery module can last about 45 hours for continuous measurement. For monitoring applications more than a week, the solar charging scheme should be considered [11].
The voltage scaling between the output of SVS and input of the ADC as well as the input port selection of SVS are two main issues for the hardware design of data retrieval. The measured maximum output voltage of the SVS is ±14V which is larger than ±10V in the specification. The
simpler way to solve this hardware design problem is adopting a 16-bit ADC with ±10V input voltage range with about 0.3mV of resolution. However, this type of ADC is not available when the proposed converter module is implemented. Another way is to utilize a voltage scaling circuit followed by a 24-bit ADC with ±3V input voltage range, which is adopted in this study due to its simplicity. The voltage shrinking leads to the loss of data precision and then a 24-bit ADC chip (ADS1274) is introduced to compensate the loss. The amplification ratio of this circuit is about 0.1351 with scaling around -17.38dB, and the linearity of the circuit output is assessed and verified. There are two velocity outputs with high and low resolutions as well as one acceleration output in the SVS. The converter module is designed with a hardware switch for choosing any two out of the three output ports of SVS so that at most two output channels can be sampled simultaneously. Usually the high resolution velocity port or the acceleration port is connected for vibration measurement. The maximum frequency of the data output of the SVS is about 100Hz and the minimum sampling rate should be greater than 200Hz. In this study, the sampling frequency is set to 408Hz and the data rate is about 9.8 kbps per output port. The output data rate can also be reduced for implementing some simple algorithms like moving average in the converter module.
The last issue of the converter module is resulted from the limitations of the wireless transmission. According to the ZigBee specification, there are 16 wireless channels and the maximum wireless transmission speed is 125kbps if all channels work together. However, only one channel could be used each time due to the firmware program in the TinyOS 2.0 development environment. That is, the speed of the single wireless channel is about 7.8kbps which is less than 9.8 kbps of the output data rate from ADC. This problem can be solved by using at least 256 bytes of data buffer implemented by a circular queue (CQ). The output of the ADC is read by MCU through the SPI bus and is stored in the CQ before the wireless transmission occurred as the specified number of data is reached. The length of the payload data (LoPD) in the designed TinyOS packet is 116 bytes and it not only affects the processing time on the base node but also determines the numbers of nodes (NoN) in one group.
3. Results and Discussions
3.1. Validation
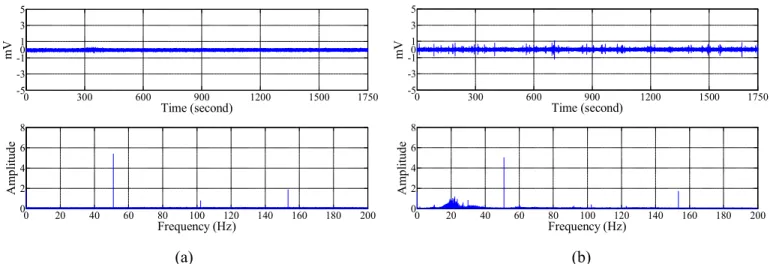
In order to verify the function of the proposed converter module, several measurements are performed: A. the converter module works alone; B. WSN-enabled SVS; C. WSN-enabled SVS with the wired SVS in the bridge scour experiment; D: WSN-enabled SVS with the wired SVS in a corridor bridge. In Test A, the received voltage is within ±0.1 mV as shown in Fig. 2(a). In the bottom figure of Fig. 2(a), three peaks at about 51 Hz, 102 Hz, and 153 Hz are observed in the spectrum. These three peaks in the spectrum result from the power drops caused by the RF transmission per 8 data sets. These peaks can be filtered out by software and will not affect accuracy of the measurements later. In Test B, some noise around 10Hz to 40Hz is observed in Fig. 2 (b) implying that the SVS should be calibrated to reduce the internal noise before applied to any practical applications.
0 300 600 900 1200 1500 1750 -5 -3 -10 1 3 5 Time (second) m V 0 20 40 60 80 100 120 140 160 180 200 0 2 4 6 8 Frequency (Hz) A m pl itu de 0 300 600 900 1200 1500 1750 -5 -3 -10 1 3 5 Time (second) m V 0 20 40 60 80 100 120 140 160 180 200 0 2 4 6 8 Frequency (Hz) A m pl itu de (a) (b)
Fig. 2. The measurements of (a) the converter module only and (b) the converter module with SVS connected.
The WSN-enabled SVSs are then installed side by side with the data acquired wired (DAQ-wired) SVSs in a bridge scour experiment under clean water condition in Test C. As shown in Fig. 3, the spectrums of the acceleration data from the WSN-enabled SVSs are in excellent agreement with those from wired SVSs. The frequency range of the bridge scour is from 2Hz to 25Hz roughly with main peaks around 6.5Hz and second peaks at 15Hz. Obvious noise is observed for node 4 after 35 Hz in the spectrum and it seems to be amplified by the converter module. It is verified that the observed noise is caused by the node 4 itself after connecting the node 4 to a spectrum analyzer. Therefore, the proposed WSN-enabled SVS is validated for vibration measurement.
Fig. 3. The spectrums of WSN-enabled and DAQ-wired SVSs in a bridge scour experiment under clean water.
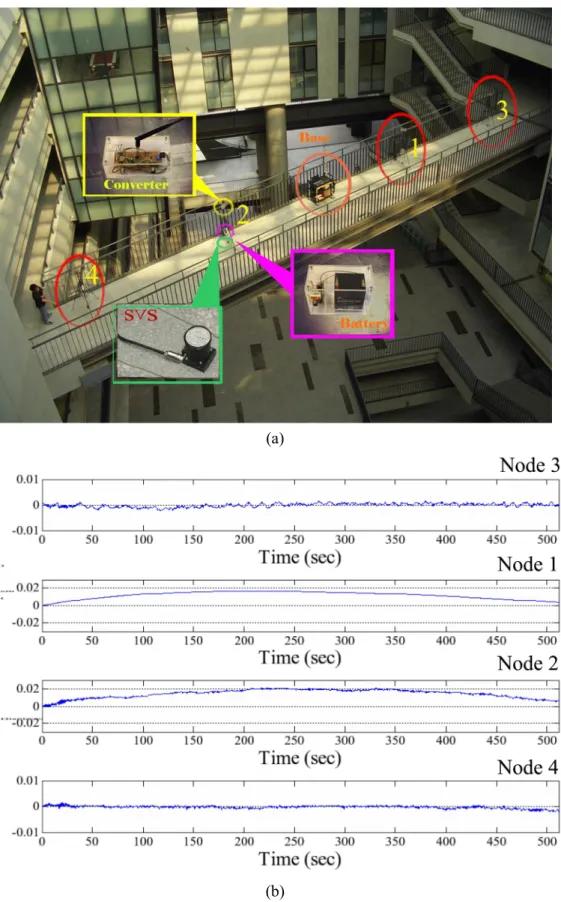
Furthermore, Test D is performed at a corridor bridge inside the building 7 at Yuan Ze University with the WSN-enabled SVS. The base station is located in the middle of the bridge as shown in Fig. 4(a) with four nodes deployed evenly. The main vibration frequency of node 3 and node 2 is about 3.5Hz and the second one is about 0.4Hz. As shown in Fig. 4(b), the displacements of the deployed nodes are obtained by numerical integration of the measured velocities. It is also observed that middle part of the corridor bridge bends down slightly. Note that the positive direction of the displacement is directed toward the earth.
(a)
(b)
Fig. 4. (a) The picture, (b) measured velocities and (c) the derived displacements of a corridor bridge vibration measurement.
3.2. Packet Loss
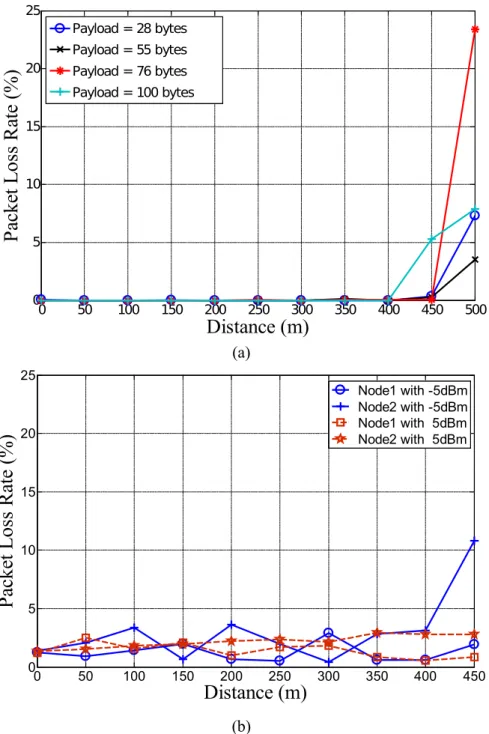
The packet loss is a critical problem of wireless transmission in WSN since the retransmission scheme is costly in the point of view of power management. Hence, the maximum transmission distances (MTD) is defined to be the distance between node and base without any packet loss under 100 bytes
LoPD in an open area without any obstacle in the line of sight (LOS). The MTDs of a single node are about 1200m, 750m, 500m and 400m at the RF powers of 20dBm, 10dBm, 5dBm and -5dBm, respectively. As shown in Fig. 5(a), some packets are lost after 400 m with -5dBm RF output power for different LoPD in the single node measurement. The packet loss exists for any distance less than 400 m when there are two nodes in a channel even though the length of packet is 28 bytes in Fig. 5(b). However, the loss rate is below 4% when the distance is less than 400m. Therefore, at most two sensors in a channel are suggested and the distance between gateway and node should less than 400 m with -5dBm output power. Also, the packet loss rate of nodes with 5dBm is obviously less than that of nodes with -5dBm at the same distance in Fig.5 (b).
0 50 100 150 200 250 300 350 400 450 500 0 5 10 15 20 25
Distance (m)
P
ac
ke
t L
os
s
R
at
e
(%
)
Payload = 28 bytes Payload = 55 bytes Payload = 76 bytes Payload = 100 bytes (a) 0 50 100 150 200 250 300 350 400 450 0 5 10 15 20 25Distance (m)
P
ac
ke
t L
os
s
R
at
e
(%
)
Node1 with -5dBm Node2 with -5dBm Node1 with 5dBm Node2 with 5dBm (b)Fig. 5. The packet loss rates of (a) single and (b) two sensor nodes in one channel. All the RF powers of all nodes are set to -5dBm and the length of payload in (b) is 28 bytes.
3.3 Deployment schemes
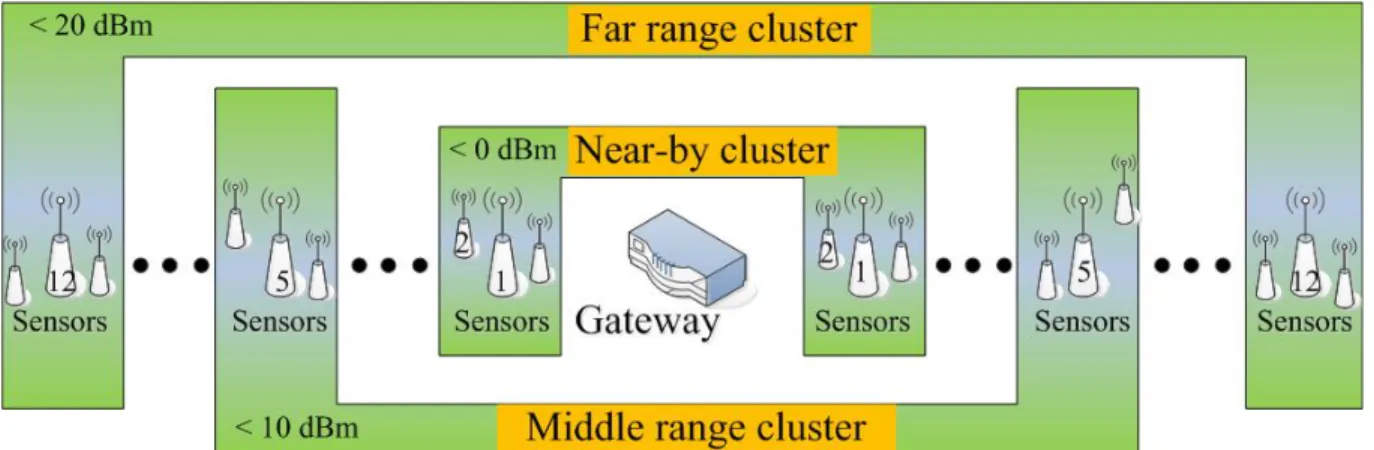
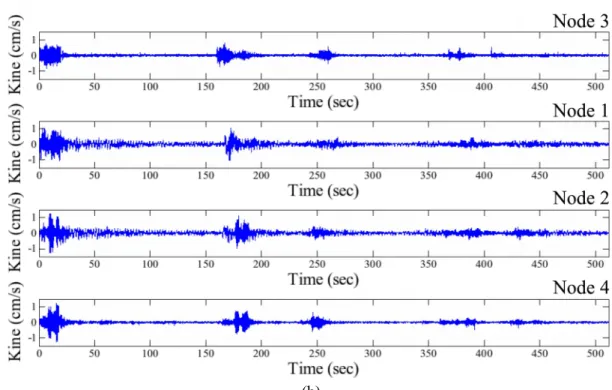
For monitoring vibration, the deployment scheme of sensors depends on how many locations on the structure to be monitored and the distance between nodes. It is known that the distance between two bridge piers of the pre-stressed concrete bridge is about from 20m to 45m but that of suspension bridge ranges roughly between 300m and 2000m. If the maximum monitored distance is less than twice of the maximum measured distance of the nodes with 20 dBm RF power, the deployment scheme with single-hop transmission in Fig. 6 is suggested. Results in Fig. 5(b) suggest that at most two nodes in one channel thus imply that the multi-hop transmission is not a good choice. It is further confined that the maximum number of deployed nodes is 32 if 16 channels are all utilized. In this single-hop scheme, every sensor node will communicate with the gateway directly and is classified by nearby cluster, middle range cluster, and far range cluster with respect to the distance from the gateway. The nodes in different clusters are set to different RF power levels which should be determined by the real distance measurement on the monitored bridge in the worst case, e.g. raining. For monitoring with longer distance requirement, the more expensive scheme is to duplicate the single-hop scheme with different group ID at different bridge segments. This multiple group scheme is preferred for the long bridge monitoring application because of its simplicity, easy deployment and management. As shown in Fig.7 (a), this deployment scheme is applied to a field measurement of New Taipei Bridge in Taiwan and the measured velocities of four nodes are shown in Fig.7 (b). It is observed that the vibration around 160 seconds of node 3 is propagating to the successive nodes. However, it seems that some packet loss problem in node 4 results in the stop of the propagation. To compensate the loss data due to the packet loss, some algorithms should be further investigated.
Fig. 6. One deployment scheme of the sensor nodes for bridge vibration monitoring. The number on the sensor denotes the wireless channel.
(b)
Fig. 7. The (a) deployment configuration (b) measured velocities of the vibration of the New Taipei bridge in Taiwan.
4. Conclusion
A WSN-enabled SVS is designed and implemented for vibration measurements and is tested under several environments including an inside-building bridge measurement, a bridge scour experiment, and a field test. Satisfactory results are obtained and some suggestions on applying the WSN-enabled SVS to bridge vibration measurement are summarized. In general, this WSN-enabled SVS can be applied to bridge vibration measurement with careful examination on packet loss. At most two nodes in a wireless channel, higher power level for nodes at longer distance from base or gateway, and enough channel separation for two successive clusters do reduce the packet loss rate tremendously. The on-time packet loss evaluation software for deployment, the packet loss compensation scheme and a task distribution algorithm for the bridge vibration monitoring should be further studied.
Acknowledgments
This research is supported by the National Science Council with the project no. 99-2625-M-451-001, 100-2221-E-451-009, and the China Engineering Consulting Inc. in Taiwan.
References
[1] Cheng, C.-C., K.-T. Hsu, and C.-P. Yu, 2010, “Evaluation of the Dynamic Characteristics of an Extra-dosed Bridge Using Microwave Interferometer”, Proc. of 2nd
Symposium on Life-Cycle Civil Engineering, Oct., Taipei, Taiwan.
[2] Chen, C.-C., W.-H. Wu, H. Z. Tseng, and T.-H. Chen, 2010, “Identification of Dynamic
Parameters of Stay Cables Using Commercial Camcorder”, 5th European Workshop on
Structural Health Monitoring, June, Sorrento, Italy.
[3] Stahl-Offergeld, M., H. P. Hohe, and J. Sauerer, 2009, “Integrated Sensitivity Adjustment for 3D Hall Sensors”, Sensor Letters 7 (3), pp. 313-316.
[4] Encica, L., J. L. G. Janssen, J. J. H. Paulides, and E. Lomonova, 2009, “Electromagnetic
[5] Nabily, S., J. Gieraltowski, F. Alves, and B. Kaviraj, “Giant magneto impedance sensors based on microwire and sandwiched structures for non destructive testing applications”,
Sensor Letters, 7(3), pp. 278-281
[6] Veto, R., S. Dyke, L. Liu, P. C. Wang, F. Sun, and C. Y. Lu, 2006, “Employing wireless
sensing technology in smart structures”, Proc. of 4th China-Japan-US Symposium on
Structural Control and Monitoring, Oct., HangZhou, China.
[7] Lynch, J. P., Y. Wang, K. Loh, J. Yi, and C.-B. Yun, 2006, "Performance Monitoring of
the Geumdang Bridge using a Dense Network of High-Resolution Wireless Sensors", Smart
Materials and Structures, IOP, 15(6), pp.1561-1575.
[8] Lei, Y., W. A. Shen, Y. Song and Jerome P. Lynch, 2007, "Application of Wireless
Monitoring System for the Ambient Vibration Study of the Wu Yuan Steel Arch Bridge," Proc.
of the World Forum on Smart Materials and Smart Structures Technology, May.
[9] Lu, K.-C., Y. Wang, J. P. Lynch, C. H. Loh, P. Y. Lin, and Z. K. Lee, 2006, “Ambient
vibration study of Gi-Lu cable-stay bridge: application of wireless sensing units”, Proc. of
SPIE 6147.
[10] Picozzi, M., et al., 2010, “Wireless technologies for the monitoring of strategic civil infrastructures: an ambient vibration test on the Fatih Sultan Mehmet Suspension Bridge in Istanbul Turkey”, Bulletin of Earthq. Eng. 8(3), pp.671-69.
[11] Kan, Y.-C., H.-C. Lin, and Y.-M. Hong, 2011, “The Design and Implementation of the