w
國立高雄大學國際商業管理碩士學位學程
碩士論文
The Rise and Fall of Ethanol Industry: The Case of Brazil
乙醇工業的興衰:以巴西為例
Advisor(s): Po-Chih Lee, Ph.D.
Yung-Kai Yang, Ph.D.
Postgraduate: Anderson Wang
I
ACKNOWLEDGEMENT
I would first like to thank my thesis advisor Professor Lee of the Department of Asia-Pacific Industrial and Business Management at National University of Kaohsiung. I would also like to acknowledge Associate Professor Yang of the Department of Asia-Pacific Industrial and Business Management at National University of Kaohsiung as the second reader of this thesis, and I am gratefully indebted to his for his very valuable comments on this thesis.
Finally, I must express my very profound gratitude to my parents and to my family for providing me with unfailing support and continuous encouragement throughout my years of study and through the process of researching and writing this thesis. This
II
The Rise and Fall of Ethanol Industry: The Case of
Brazil
Advisor(s): Professor Po-Chih Lee, Ph.D Associate Professor Yung-Kai Yang, Ph.D.
Department of Asia-Pacific Industrial and Business Management National University of Kaohsiung
Student: Anderson Wang IMBA
National University of Kaohsiung
Abstract
Brazil one of the most successful bio-fuel program in the world, today in Brazil 88% of the light vehicles can use ethanol sugarcane based, in 2009 the ethanol
(Hydrated) sales in brazil was 65% of gasoline total sales and in 2016 reduced to 34 %. This study utilizes PEST method of analysis to understand the reasons behind the rise and fall of ethanol.
The results indicate the one of the ethanol rise main factors was the Hybrid car and high investment in the sector, on the other side one of the main reasons of the ethanol fall is high debt around R$ 100 billion today is equivalent to 100% of the production chain revenue. Due to no long-term planning one of the options that may help with this situation is to create exclusive Biofuel program.
III
乙醇工業的興衰:以巴西為例
摘要
巴西是世界上最成功的生物燃料計劃之一,今天在巴西,88%的輕型汽車可以使用乙醇甘 蔗,2009 年巴西乙醇(Hydrated)汽油銷量佔汽油總銷量的 65%,2016 年減少 到 34%。 本研究利用 PEST 分析方法來了解乙醇上升和下降背後的原因。 結果表明,乙醇上漲的主要因素之一是混合動力汽車和該行業的高投入,在訂單方面,乙 醇價格下跌的主要原因之一是今天約 1000 億雷亞爾的高負債相當於 100%的 生產鏈收 入。 由於沒有長期規劃,可能有助於解決這種情況的方案之一是創建獨家生物燃料計劃。 關鍵詞:乙醇,巴西,PEST,興衰IV ……….………38 ………..…………..…..…..………38 ………..……….……38 ………..………….……….……….………39 ……….…………..……….……….….…………39 ………..……….………..……….…………40 ……….……….………40 ………..………V ………..………VI ……….……….………1 ………2 ………..………….………3 ………6 ………..………..………6 ………8 ……….……13 ………..….……17 ………..…………18 ……….……….………18 ……….…………..……19 ………..……….………..……20 ………..………20 ………..………..……….……….…………23 ………..…………..………..………23 ……….………24 ………..……26 ……….……….………..…………27 …..………..……….………..…28 ………..……….…………28 ………30 ………..…33 ………36 ………..………...……..………36 ………..………..………36 ………..………..………36 ………..……….…..………37 ……….……….………41 Table of Contents List of Figure List of Tables
Chapter One: Introduction
1.1 Background Information 1.2 Main Purpose of the Study Chapter Two: Review of Literatures
2.1 Rise Of Ethanol first phase (1980 – 1990) 2.2 Rise of Ethanol second phase (2003-2010) 2.3 Fall of Ethanol Phase 2009 Today
2.4 PEST Analysis
Chapter Three: Research Method 3.1 Research Framework 3.2 Qualitative Analysis Chapter Four: Major Results
4.1 Brief introduction 4.2 Rise of Ethanol 4.2.1 Political 4.2.2 Economic 4.2.3 Social 4.2.4 Technological 4.3 Fall of Ethanol 4.3.1 Political 4.3.2 Economical 4.3.3 Social 4.3.4 Technological
4.4 Ethanol in United States of America 4.4.1 Ethanol Policy
4.4.2 Impact Ethanol in the Food Prices 4.4.3 Corn vs Sugarcane
Chapter Five: Concluding Remarks
5.1 Currently ethanol industry in Brazil 5.2 Rise of Ethanol
5.3 Fall of Ethanol 5.4 Suggestions
5.5 Restriction of the study 5.6 Suggestions for future Studies References
V ………2 ……….………3 ………..………4 ………5 ………7 ………10 ………11 ………11 ………..………12 ……….………13 ………15 ………..………16 ………18 ………21 ………..………22 ………..………23 ………24 ……….………25 ………26 ………28 ………..………29 ………..………30 ………..………31 ………..………31 ……….………32 ……….………32 ………..………33 ………..………34 ……….………45 ………..………45 List of Figures
Figure 1.1: Sugarcane Field Figure 1.2: Sugarcane Ethanol Mill Figure 1.3: Sugarcane Ethanol Process Figure 1.4: Flow Chart of the study Figure 2.1 Oil Price World Wide 1971-1996 Figure 2.2: Oil price World Wide 1997-2010 Figure 2.3: Ethanol & Gasoline price comparison Figure 2.4: Ethanol Brazil production 2000-2010
Figure 2.5: Brazil Sugar & Ethanol Production Distribution 1980-2015 Figure 2.6: Open/Shutdown sugarcane Mills in Brazil 2005-2016
Figure 2.7: Average Yield and the Total Recoverable Sugar (TRS - Kg Sugar/ t Sugarcane) Figure 2.8: Brazil Gasoline price 2002-2015
Figure 3.1: Research Framework
Figure 4.1: Sugarcane Production 2008-2017 Figure 4.2: Sugarcane Production (Ethanol X Sugar) Figure 4.3: CIDE-Fuel – Investments 2004-2013 Figure 4.4 Export Average sugar price (US$/ton) Figure 4.5: New Sugarcanes Factory Plants in Brazil Figure 4.6 Consumer main reason to buy Hybrid Car Figure 4.7: Brazil Gasoline price 2002-2015
Figure 4.8: Ethanol vs Gasoline Price and Sales Comparison Figure 4.9: Gasoline International Price US Dollars per Gallon Figure 4.10: Sugarcane sector debt estimation
Figure 4.11 International Sugar Price
Figure 4.12 Sugarcane Productivity & Renew,Expansion plantation Figure 4.13 Average number of cuts/harvests per life cycle Figure 4.14 Governmental Investments in sugarcane harvest
Figure 4.15 Sugarcane Planting and cutting Process Cost Comparison 2012 OCT (R$/t) Figure 4.16 Brazil Ethanol average probability consumption (2002-2003)
VI ……….………6 ………9 ……….………10 ………..………12 ………..………14 ………14 ………..………19 ………..………25 ………..………27 ………37 List of Tables
Table 2.1: Ethanol Use Mandate
Table 2.2: Tax Incentives to hybrid vehicle Table 2.3: Hybrid light vehicles production
Table 2.4: Total Area of Sugarcane Temporary and Permanent crops 2005-2014
Table 2.5: Number of formal workers directly involved in the production of sugar cane 2009/2013/2014 Table 2.6: Sao Paulo Sugarcane Sector Admitted/Discontinued on Non-farming and farming jobs 2013 & 2014 Table 3.1: PESTLE on Ethanol Process
Table 4.1: Brazil Ethanol Exportation Value Dollars Table 4.2: Ethanol Industry Investments
1
CHAPTER ONE
Introduction
Energy consumption in the transport sector shows a continuous increase, showing high dependence in petroleum, the fossil fuel represents 97.3% for world road transport (IEA, 2010,). In 2017 Brazil showed a better scenario, total gasoline consumption was 76.4 billion liters and the ethanol consumption were 25.7 billion liters (ANP, 2018).
In the post-2000 period, the high international interest in alternative and less environmentally harmful sources of energy led to a large increase in the production of biofuels in countries with high production potential, such as Brazil, the United States and some European Union countries. In this context, the Brazilian case draws attention to the technological and productive vanguard position achieved by the country in the unique experience of the use of large-scale fuel ethanol, which began in the 1930s, but
effectively boosted in 1975, with the creation of Proálcool (National Alcohol Program), which created the institutional apparatus and the structure of incentives needed to develop this scenario.
Especially in the last decade, there was a great stimulus to ethanol production, mainly due to the appearance of hybrid fuel vehicles in 2003, capable of using any arbitrary combination of gasoline and ethanol, which significantly increased domestic demand for hydrated ethanol. It also highlights the cessation of direct government intervention in 1999 and the movement of mergers, expansion and internationalization of assets and production, which bring new investments. Between 2000 and 2010, sugarcane production jumped from 256.81 to 620.41 million tons, that is, expansion of 141.5% in the period and 2015-2016 reaching 666.824 million tons. The vehicle production was also highly affected in comparison between 2003 and 2006 the total hybrid small vehicles leaped from 2.9 % to 56.3 % and in 2016 the grand total of hybrid vehicles reached 59.8 %
Although the production of sugar cane had been increasing the ethanol consumption have been decreasing the last two years (-18.24% and -6.47 % respectively) and the gasoline consumption didn’t change it.
2
Background Information
Ethanol as a biofuel can be produced from a large variety of plants including sugarcane, wheat, corn and sugar beet, the most of these plants also can produce sugar. According to researches That is, according to the literature, the growing demand for ethanol with the introduction of flex-fuel vehicles, which reflected in the price of biofuel, influenced ethanol and sugar offerings only in the short term, thus stressing that the ethanol price does not generate impacts on sugar and ethanol production.
A change in the price of sugar has a higher impact on the productions of the sugar and alcohol industry. This phenomenon is seen by the consolidation of sugar in the foreign market. However, much of the sugar supply variation is inherent to factors linked to sugar production, such as inventories. The model suggests that sugarcane producer reacts most strongly to a change in the price of sugar in relation to a change in the price of ethanol. Revealing the preference in producing sugar for the foreign market.
Ethanol production as mentioned before is highly affected by the prices of sugar, but not only, gasoline as a substitute good also has a high influence in the market. Last decades the Brazilian government due attempt to combat inflation kept gasoline fuel prices low, which led sugarcane mills to produce more sugar.
The ethanol has been in the market for more than 43 years and only in 2004 had effectively entered the market, even after 14 years the ethanol market isn’t stable yet, oscillating from 37.47 % (2014-2015) to -18.34% (2015-2016), highly affecting the long-term projects and planning.
3 Fig u re 1 .2 S u ga rc an e E th an o l Mil l Sour ce : G er son Moer a & Nilson Car do so
4 1. Su garcan e H arv est 2. We ig h in g 3. Clean in g 4. Cu tt in g 5. So rtin g 6. Ch em ical Bath 7. P u rif icati o n a. R emo ve c h emical c o mp o n en ts 8. Ferm en tat io n 9. D istill ati o n a. H yd rat ed ( Eth an o l) b. A n h yd ro u s (E th an o l G as o lin e B le n d u sag e) 10. Sto rag e Fig u re 1 .3 S u ga rc an e E th an o l Pr o ce ss Sou rce: e-edu ca tion .p su Carolin a Cliffo rd
5
Main Purpose of the Study
The main purpose of the study is to archive the following goals: 1. Currently ethanol industry in Brazil
2. Reasons of the rise and fall of ethanol 3. Offer suggestions for further developments
Flow Chart
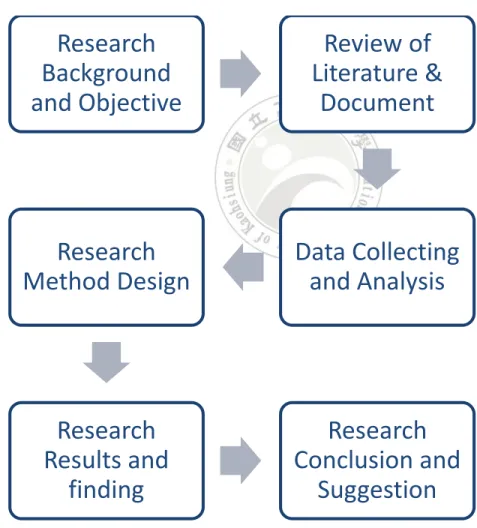
The flow chart of this study is a following
Figure 1.4: Flow Chart of the study
Research
Background
and Objective
Review of
Literature &
Document
Data Collecting
and Analysis
Research
Method Design
Research
Results and
finding
Research
Conclusion and
Suggestion
6
CHAPTER TWO
Review of Literatures2.1 Rise of Ethanol first phase (1980 – 1990)
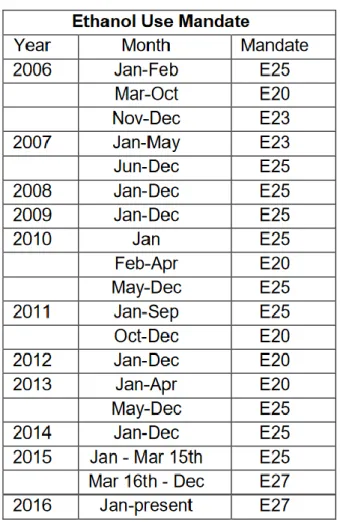
The use of ethanol as fuel in Brazil began with the addition in gasoline on the proportion of 5% (Ethanol anhydrous) in July 1931. However, fuel alcohol only gained notoriety since 1975 with the establishment of Proalcool program, initially encouraged the
production of anhydrous ethanol to be blended with gasoline up to a level of 20% (Table 2.1) . The end of the 1970s it also promoted the use of pure hydrated alcohol as vehicle fuel (Hydrated Ethanol).
Table 2.1 Ethanol Use Mandate
7
This strategy of encouraging the production and consumption of Ethanol hydrated in the country was closely related to Intense increase in the price of oil in the world market and the high dependence on petroleum. That moment the environmental and social benefits of biofuels appeared only in the background (Elizabeth Farina 2013).
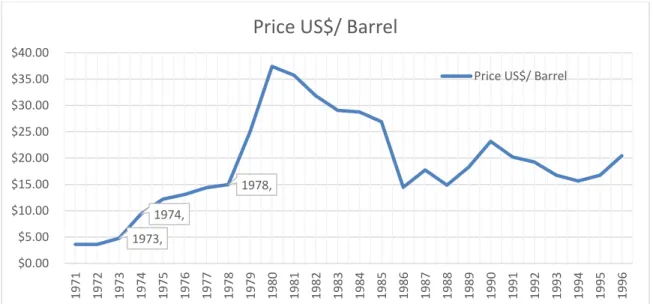
In the 1970s two oil shocks brought insecurity to supply and exposure to the Brazilian economy. In the first shock (1973-1974) due the members of the OAPEC proclaimed an oil embargo, the world oil prices more than tripled, from US $ 2.90 to US $ 11.65 barrel in just 3 months (Figure 2.1). Brazilian spending on oil and oil products rose by 450% between 1973 and 1974, from US $ 750 million to US $ 4.1 billion the following year, even though the imported value only grew by 15%. Then the second shock (1978-1979) due to the Iranian revolution, the oil price increased from US $ 15 to US $ 37 (1978-1980) highly affected the gasoline prices.
Figure 2.1: Oil Price World Wide 1971-1996
Source : IOGP International Association of Oil & Gas Producers
The proportion of consumption between hydrated ethanol and gasoline was basically determined by vehicle sales. The government had several instruments to influence consumer choice over the type of vehicle to be purchased. In the case of ethanol, fleet growth could be boosted by a variety of measures, eg: car tax exemption, financial help, road taxes reductions, and maintenance at favorable prices.
During this period, ethanol production began to be evaluated and planned. Characteristics such as the long-time response of supply, climatic and biological factors, among other
1973, 1974, 1978, $0.00 $5.00 $10.00 $15.00 $20.00 $25.00 $30.00 $35.00 $40.00 1971 1972 1973 1974 1975 1976 1977 1978 1979 1980 1981 1982 1983 1984 1985 1986 1987 1988 1989 1990 1991 1992 1993 1994 1995 1996
Price US$/ Barrel
8
strong factors in agricultural commodity markets, began to gain great importance in Brazilian politics.
To guarantee the necessary supply of ethanol to the consumer, the government used various methods and instruments, such as, control over the domestic supply of petroleum derivatives and price control of the annual sugarcane harvest. In this scenario the
government had total control on oil extraction and sugarcane production. This phase shaped by the government began during the 1980s and lasted until the fall of the price of petroleum in the 1990s, from that moment ethanol fuel in Brazil had great loss in the market from 19% in 1990 to almost 0 % in 1996 (SCHECHTMAN, 2003).
2.2 Rise of Ethanol second phase (2003-2010)
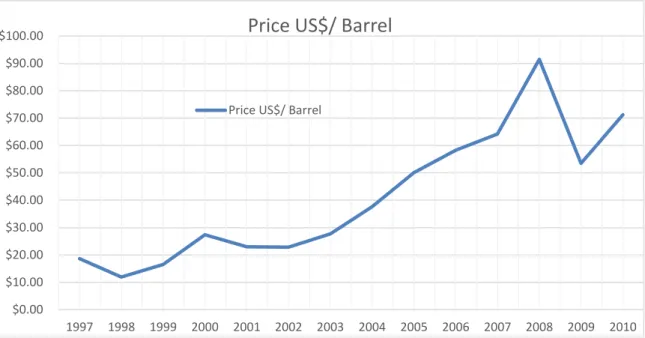
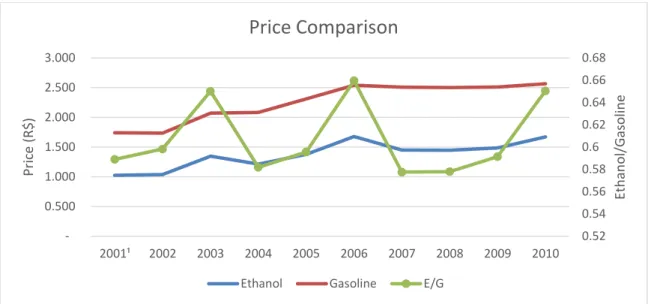
From 2003 ethanol consumption has changed significantly due to the new technologies trying to reduce the CO2 emissions in the market and changes in the petroleum market (Figure 2.2) In 2003, the first hybrid car was lunched , then capable of using any arbitrary combination of gasoline and hydrated ethanol ( LIMA 2009 ), strategically the Brazilian government launched hybrid vehicles tax Incentive (Table 2.2) to boost ethanol market. Also, the competitiveness of ethanol at that time had great impact, ethanol in 2003-2004 was 35% lower than gasoline (Figure 2.3)(Luciano Rodrigues 2013) Consequently the acceptance of the hybrid car became high, in four years, 90 % of new cars sales in the country became hybrid (Table 2.3)
9
Table 2.2 Tax Incentives to hybrid vehicle
10
Figure 2.2: Oil price World Wide 1997-2010
Source : IOGP International Association of Oil & Gas Producers
Table 2.3: Hybrid light vehicles production
Year Total Hybrid light vehicles produced Flex Vehicles as total light vehicles % 2003 49,264 2.9 2004 332,507 15.2 2005 880,941 36.7 2006 1,392,055 56.4 2007 1,936,931 69.1 2008 2,243,648 74.7 2009 2,541,153 84 2010 2,627,111 77.1 2011 2,550,875 80.7 2012 2,701,781 83.4 2013 3,169,114 88.5 2014 2,940,508 88.2 2015 2,194,020 88.3 2016 1,750,750 88 2017-YTD 1,578,786 88
Source : Associação Nacional dos Fabricantes de Veículos Automotores ( ANAFVA )
$0.00 $10.00 $20.00 $30.00 $40.00 $50.00 $60.00 $70.00 $80.00 $90.00 $100.00 1997 1998 1999 2000 2001 2002 2003 2004 2005 2006 2007 2008 2009 2010
Price US$/ Barrel
11
Figure 2.3 : Ethanol & Gasoline price comparison
Source: National Agency of Petroleum, Natural Gas and Biofuels (ANP)
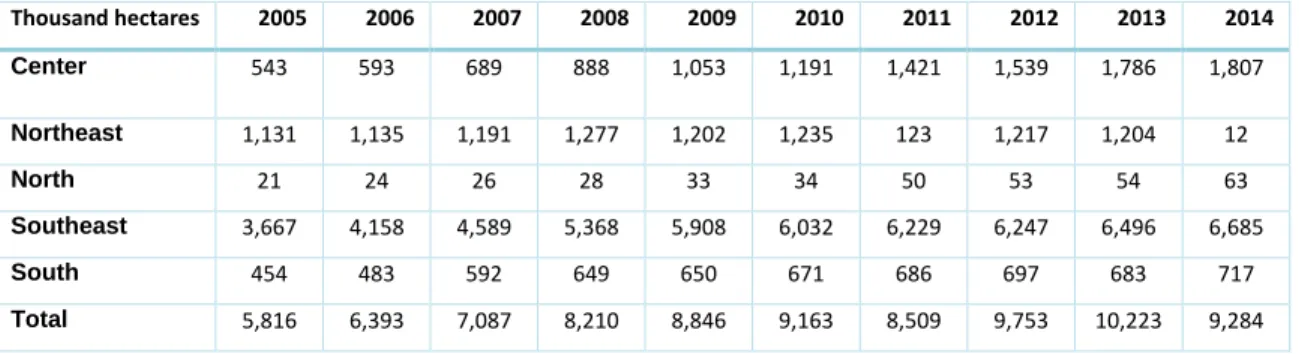
The increase in ethanol demand has also led to a significant increase in ethanol production between 2003 and 2008 increased from 5,6 Million cubic meters to 17.6 Million cubic meters (Figure 2.4), The effect of this process was the significant
expansion of sugarcane harvest in the Brazilian countryside, through the incorporation of new areas, mainly from the substitution of coffee growing areas, traditional food crops or pasture areas. The total area planted in hectares of sugar cane increased from 4,879,841 hectares, or 9.4% of Brazilian areas destined for temporary and permanent crops in 2000, to 9,284,169 hectares in 2014 (Table 2.4). 0.52 0.54 0.56 0.58 0.6 0.62 0.64 0.66 0.68 0.500 1.000 1.500 2.000 2.500 3.000 2001¹ 2002 2003 2004 2005 2006 2007 2008 2009 2010 Eth an o l/G asolin e Price (R$ )
Price Comparison
Ethanol Gasoline E/G
-20.00% 0.00% 20.00% 40.00% 60.00% 5,000.00 10,000.00 15,000.00 20,000.00 25,000.00 2000 2001 2002 2003 2004 2005 2006 2007 2008 2009 2010 Y/ Y H yd rated Gro wt h Tho u san d m ³
Etanol Production
Hydrated Anhydrous Y/Y % Figure 2.4: Ethanol Brazil production 2000-2010
12
Table 2.4 Total Area of Sugarcane Temporary and Permanent crops 2005-2014
Thousand hectares 2005 2006 2007 2008 2009 2010 2011 2012 2013 2014 Center 543 593 689 888 1,053 1,191 1,421 1,539 1,786 1,807 Northeast 1,131 1,135 1,191 1,277 1,202 1,235 123 1,217 1,204 12 North 21 24 26 28 33 34 50 53 54 63 Southeast 3,667 4,158 4,589 5,368 5,908 6,032 6,229 6,247 6,496 6,685 South 454 483 592 649 650 671 686 697 683 717 Total 5,816 6,393 7,087 8,210 8,846 9,163 8,509 9,753 10,223 9,284
Source: Brazilian Institute of Geography and Statistics (IBGE 2016 )
The recent increase in sugarcane production was driven by the increase in the demand for both fuel ethanol and sugar, a product that has historically been highly representative in the global market. As shown in Figure 2.5, even in the face of the great increase in sugarcane production, the share between sugar and domestic ethanol remained practically stable: in the 2007/08 harvest, 59.36% of sugarcane production was dedicated to ethanol and 40.64% to sugar; in the 2012/2013 harvest, the percentages were 59.58% and 40.43% respectively ( CONAB, 2016)
Figure 2.5: Brazil Sugar & Ethanol Production Distribution 1980-2015
Source: Moraes & Zilberman (2014), CONAB (2016) and UNICA (2016)
13
Highlighting the growth of the number of workers. In Brazil as a whole, the study
indicates that between 2000 and 2005, considering the three sectors (sugarcane, sugar and ethanol) together, there was a significant increase of 52.9% in the number of employees, (MORAES, 2007) Martinez et al. (2013) estimate that in areas of the Brazilian Northeast the impact on employment are even more evident. Coelho (2006) points out the cost is lower creating a job in the agrochemical industry compared to the chemical and petrochemical industry.
2.3 Fall of Ethanol Phase 2009 - Today
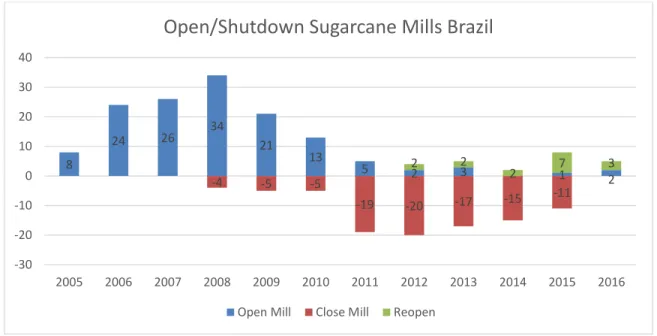
After the period of great expansion, ethanol industry 2009 begins a period of crisis and suppression of investments. As show in Figure 2.6 reflects this moment of gradual decline of investments in the industrial area.
Figure 2.6: Open/Shutdown sugarcane Mills in Brazil 2005-2016
Source: EPE Análise de Conjuntura dos Biocombustíveis 2016
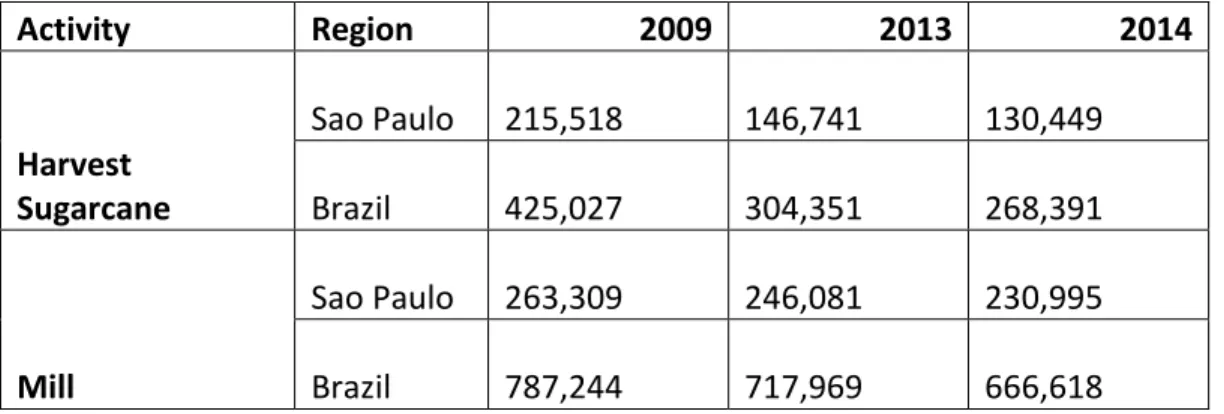
Consequently, the number of formal workers directly involved in the production of sugar cane, sugar and ethanol in Brazil and the State of São Paulo in follow years in 2009, 2013 and 2014 greatly shrieked as table 2.5 shows. The advance of mechanization in the cane harvest and the Agro-environmental Protocol also greatly affected the sugarcane cutters job demand. 8 24 26 34 21 13 5 2 3 1 2 -4 -5 -5 -19 -20 -17 -15 -11 2 2 2 7 3 -30 -20 -10 0 10 20 30 40 2005 2006 2007 2008 2009 2010 2011 2012 2013 2014 2015 2016
Open/Shutdown Sugarcane Mills Brazil
14
Table 2.5: Number of formal workers directly involved in the production of sugar cane 2009/2013/2014
Activity Region 2009 2013 2014 Harvest Sugarcane Sao Paulo 215,518 146,741 130,449 Brazil 425,027 304,351 268,391 Mill Sao Paulo 263,309 246,081 230,995 Brazil 787,244 717,969 666,618 Source: RAIS (2015)
The non-agricultural occupations involving workers in transportation, administrative services, processing in the sugar and alcohol plants and other functions were also
impacted by the crisis. In 2014, there were about 7 thousand admissions less than in 2013 (Table 2.6). And the balance of demand that was still positive in 2013, in the year 2014 was negative in 9,415 jobs with a formal contract (Carlos Eduardo Fredo 2015).
Table 2.6 Sao Paulo Sugarcane Sector Admitted/Discontinued on Non-farming and farming jobs 2013 & 2014 source: CAGED/MTE
Admitted Discontinued Balance Occupation 2013 2014 2013 2014 2013 2014 Farming 88,374 60,905 91,525 74,041 (3,151) (13,136) Non-farming 46,005 38,937 44,095 48,352 1,910 (9,415) Total 134,379 99,842 135,620 122,393 (1,241) (22,551) Source: CAGED/MTE 2016
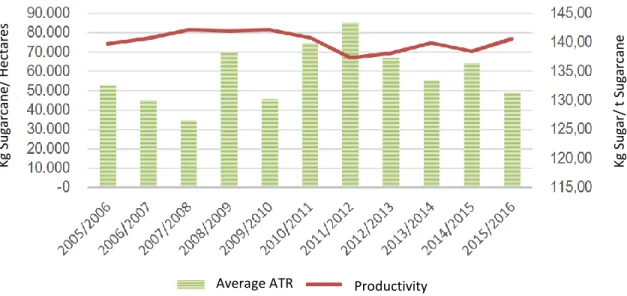
Moraes and Bacchi (2014) point out that the lack of investments in the renovation of sugarcane plantations was a decisive factor in the crisis. According to data retrieved by these authors, a renewed sugarcane plant produces 115 ts/hec against 55 ts/hec of a sugarcane plant in the sixth cut, in 2012/2013 harvest the 606 thousand hectares had not been renewed, resulted in a loss of 36,360 thousand tons of potential production
(MORAES; BACCHI, 2014). Figure 2.7 shows the average yield and the Total Recoverable Sugar (TRS - Kg Sugar/ ton Sugarcane) of the last Brazilian crops, according to Conab data (2016).
15
Figure 2.7: Average Yield and the Total Recoverable Sugar (TRS - Kg Sugar/ t Sugarcane)
Source: CONAB (2016)
The lack of external investment and the changes in the production method was not the only factor of the begin of ethanol crisis. According to Cinthia Cabral and Heloisa Lee (2016) From 2003 to 2010 the control of the price of gasoline in the country seems to have as its main goal the incentive to biofuel in the country, making it more competitive against the fossil competitor. In this period, the low level of the exchange rate (Reais per Dollar) was one of the main factors with which the government fought to keep the domestic gasoline price higher. Then, until 2014, the Brazilian government's interference in the automotive fuels market through the control of the price of gasoline restricted the increases of the gasoline price ( Figure 2.8 ) , in order to prevent negative impacts on inflation in the country. However, this policy has harmed both ethanol producers because their prices have been tied to low gasoline prices, as the state-owned company
responsible for the domestic supply of gasoline in the country (Petrobrás), which had to pay the difference between the international and domestic prices in a period when the gasoline imports exploded in the country (imports of this product in the period 2006-2010 were about 1% of imports in the period 2011-2015).
Average ATR Productivity
Kg Su gar/ t Su garca n e Kg Su garca n e/ H e cta re s
16
Figure 2.8: Brazil Gasoline price 2002-2015
Source: ANP (2016) , UNCTSD (2016)
Different surveys point high costs in the ethanol production, especially in agriculture (Nachiluk and Oliveira, 2013; Xavier, 2012). In approximate terms, sugarcane cultivation accounts for 68% of production costs in the whole chain - industry accounts for 23% and administration / marketing for 9% (XAVIER, 2012). While Bressan Filho (2010) pointed out 62% of the cost in agriculture, at 2009 values. The following cost data are illustrative:
- Sugarcane Industry Union (Unica) reports indicate an increase in the nominal cost of production of ethanol by 70% between 2007 and 2012, considering this the central factor of the crisis, in addition to the policy of containing gasoline prices (Farina,
Rodrigues and Zechin, 2014)
-studies of the Continuing Education Program in Economics and Business Management at the University of São Paulo (Pecege / USP) (Xavier, 2012) indicate that fertilizer costs increased at an average annual rate of 9.24% to 9.28% between 2007 and 2011; soil correctives rose from 11.17% to 11.74% in the same period; and herbicides and insecticides dropped in the period. Taking as an example the production of suppliers, the average total cost went from R$ 48.11/t of cane, in the 2007/2008 harvest, to
R$ 70.63/t in 2011/2012 crop for traditional cultivation areas (Xavier , 2012). The annual rate of increase oscillated according to the region and the municipalities, being between 5.5% and 11.5% per year
- according to the methodology of the Institute of Agricultural Economics (IEA), total costs ranged from R$ 36 t / hectare (ha) to R $ 74 t / ha, in the 2011/2012 harvest in the state of São Paulo (Nachiluk and Oliveira, 2013).
17
2.4. PEST Analysis
PEST Originally designed as a business environmental scan, the PEST analysis is an analysis of the external macro environment (big picture) in which a business operates. These are often factors which are beyond the direct control or influence of a business or organization, however are important to be aware of when doing product development, business or strategy planning. Earliest known reference to tools and techniques for ‘Scanning the Business Environment’ appears to be by Francis J. Aguilar (1967) who discusses ‘ETPS’ – a mnemonic for the four sectors of his taxonomy of the environment: Economic, Technical, Political, and Social. Sometime after its publication, Arnold Brown for the Institute of Life Insurance reorganized it as ‘STEP’.
Political: Political factors are basically how the government intervenes in the economy. Specifically, political factors have areas including tax policy, labour law, environmental law, trade restrictions, tariffs, and political stability.
Economic: Economic factors include economic growth, interest rates, exchange rates, inflation rate. These factors greatly affect how businesses operate and make decisions
Social: Social factors include the cultural aspects and health consciousness, population growth rate, age distribution, career attitudes and emphasis on safety. High trends in social factors affect the demand for a company's products and how that company operates.
Technological: Technological factors include technological aspects like R&D activity, automation, technology incentives and the rate of technological change.
18
P
E
S
T
Political
Economic
Social
Technological
CHAPTER THREE
Research Method
3.1 Research FrameworkThe study focuses on understanding the reasons of ethanol rise and fall in Brazil. The overall research model is illustrated in Figure 3.1. Ethanol process has four main steps: Material, Production, Distribution and Usage. Success can only be accomplished when all the steps are achieved otherwise the hole process will fail.
Figure 3.1: Research Framework Material
• Sugarcane • Haverst Costs
Production
• Sugar vs Ethanol Demand • Production Costs Distribuition • Ethanol Distribution Usage • Gasoline vs Ethanol demand
19
3.2 Qualitative Analysis
The study method is based on qualitative Analysis. The case will be divided in two main periods the rise (2003-2010) and the fall (2010-2017), each period will be divided in 4 stages, each stage will be analyzed using PEST method while only focusing in the main points:
Table 3.2 PESTLE on Ethanol Process
Rise Material Production Distribution Usage
Political Price control
Economic Investment Investment Low Taxes High oil price
Social
Technological Hybrid car
Fall Material Production Distribution Usage
Political Price control
Economical Low Investment Sugar vs Ethanol Low oil price
Social Preference
20
CHAPTER FOUR
Major Results
4.1 Brief introduction
Brazil, is the largest country in South America and Latin America, being the fifth largest in the world in a total area of 8,515,767.049 km² and sixth in population (with more than 200 million inhabitants). It is the only country in America where most of the Portuguese is spoken, as well as being one of the most multicultural and ethnically diverse nations, due to the strong immigration from various places in the world.
Delimited by the Atlantic Ocean to the east, Brazil has a coastline of 7,491 km. The country borders on all other South American countries except Chile and Ecuador. The climate of Brazil has a wide variety of weather conditions in a large area and varied topography, but most of the country is tropical.
According to a census carried out by the Brazilian Institute of Geography and Statistics (IBGE) in 2010, the population of Brazil was 190,755,799 inhabitants (22.43 habitants per square kilometer), 84.36% of the population defined as urban. The population is strongly concentrated in the Southeast (80.3 million inhabitants), the Northeast (53.1 million) and the South (27.4 million), while the two largest regions, the Midwest and the North, 64.12% of the Brazilian territory, have a total of only thirty million inhabitants. Brazil is the largest economy in Latin America, the second largest in America ( only behind the United States) and the seventh largest in the world. The country has a mixed economy with vast natural resources. Current GDP( PPP) per capita is US$ 15,919 (2017) and the GDP total is US$ 2.200 trillion. Has active sectors such as mining,
manufacturing, agriculture and services, Brazil has a workforce of more than 107 million people (6th largest in the world) and unemployment of 6.2 % (64th in the world).
According to the Confederation of Agriculture and Livestock of Brazil (CNA), the agribusiness sector accounts for 23% of the Brazilian GDP (2013). The country is a founding member of the United Nations, G20, BRICS, Community of Countries (OAS), the Common Market of the South (Mercosur), and the Union of South American Nations (UNASUR). The Organization of American States (OAS).
The Brazilian Federation is formed by the indissoluble union of three distinct political entities: the states, the municipalities and the Federal District. The classic tripartite
21
branches of government (executive, legislative, and judiciary) are officially created by the Constitution. The executive and the legislature are organized independently at all three levels of government, while the judiciary is organized only at the federal level and at the state / Federal District.
Brazil is the second largest producer of ethanol fuel only behind the United States. Together, Brazil and the United States lead the industrial production of ethanol, representing 87.8% of world production in 2010.Today the Sugarcane energy relative sector has 380 process units and 840 millions of jobs, generating GDP of US$ 58,671.28 millions
Brazil is the largest producer and exporter (48%) of sugar in the world and also the cheapest one, with a harvest of 651 million tons of sugarcane ( 2016/2017) (See Figure 4.1) in 9 million hectares (= 11.7% of the total area cultivated in Brazil). From 1993 to 2001, sugar production was more than tripled .
Figure 4.1: Sugarcane Production 2008-2017
Source: EPE 2017
Today, 55% of the sugarcane harvest, in an area of 4.4 million ha (= 5.7% of the area under cultivation in Brazil) figure 4.2, is used to produce ethanol, having increased a lot since 2001. The Brazil is the second largest producer and consumer of ethanol (with
500,000 520,000 540,000 560,000 580,000 600,000 620,000 640,000 660,000 680,000 Milion s o f t o n s
Sugarcane Production
22
28.7%), just behind the United States with 58.7%. In addition to the rapid increase in harvested areas (1955: 1.0, 1977: 2.1 million ha), productivity per hectare increased by 33% from 1977 to 75 t / ha, and ethanol production per ton of sugarcane increased by 58% (Bertrand et al., 2008).
The country is ranked as the world's first biofuel-based sustainable economy, as well as being a leader in the biofuels industry, a model for other countries. However, some authors consider that the Brazilian model is only sustainable in Brazil due to its advanced agroindustry technology and due to the enormous amount of arable land available in its territory; while according to other authors, Brazilian ethanol would be a solution only for some tropical countries in Latin America, the Caribbean and Africa.
Figure 4.2: Sugarcane Production ( Ethanol X Sugar )
Source: Análise de Conjuntura dos Biocombustíveis 2016 ( EPE)
4.2 Rise of Ethanol
This Section will analyze the Political, Economic, Social, Technological, Legal and Environmental factors of the success of ethanol during the period between 2003-2010.
23
4.2.1 Political
In 2001 the government created CIDE(Contribution of Economic Domain
Intervention) It is an tax on the importation and commercialization of gasoline, diesel and related streams and alcohol fuel and later on the tax will be invested in transport
infrastructure programs, as we can see in figure 4.3 , in 2004 the investment in the transport infrastructure surpassed R$ 1 million and later on in 2011 surpassed R$ 2 million . From 2003 to 2010 the government had control of the price of gasoline in the country seems to have as its main goal the incentive to biofuel in the country, making it more competitive against the fossil competitor. In this period, the low level of the
exchange rate (Reais per Dollar) was one of the main factors with which the government fought to keep the domestic gasoline price higher than ethanol.
The reduction of the IPI for cars in 2002 caused the automakers to realize the potentiality of this product in the automobile market, the difference of price could vary on MSRP from 1.2 % to 3.3 % ( 2004 – 2007 Table 2.2 ). According to data from Anfavea,
in the estimated fleet of 2003 vehicles flex cars accounted for 2.9% and 74.7% in 2008.
Figure 4.3: CIDE-Fuel – Investments 2004-2013
24
4.2.2 Economic
From the mid-1980s to September 2003, the inflation-adjusted price of a barrel of crude oil on NYMEX was generally under US$25/barrel. During 2003, the price rose above $30, reached $60 by 11 August 2005, and peaked at $147.30 in July 2008 (Trading Charts). Consequently, the government incentive the usage of ethanol.
According to Andre Souza Melo (2016) sugarcane industry has preference in producing sugar for the foreign market to produce ethanol for the domestic market. Analyzing the sugar Brazil market during the period , it is worth mentioning that the average
exportation prices fell sharply in 1998 and 2001, and later on showing high price in 2006 , with low sugar price in the market the ethanol seem to be more lucrative .
Figure 4.4 Export Average sugar price (US$/ton )
Source: Secex ( Alice System )
The new Hybrid car in the market and the government incentives to buy ethanol leaded high investments in the production of ethanol in 2005 8 news sugarcane process factory opened and in 2008 33 new factories as show in figure 4.5. In 2007 the Former President George W. Bush paid a visit in Sao Paulo to seek Ethanol Alliance, U.S. ethanol demand during that period was likely boosted by the effects of the Energy Policy Act of 2005, the Act increases the amount of biofuel (usually ethanol) that must be mixed with gasoline sold in the United States to 4 billion US gallons by 2006, 6.1 billion US 2009 and 7.5 billion US gallons by 2012; two years later, the Energy Independence and Security Act of 2007 extended the target to 36 billion US gallons by 2022.Consequently as we can see in table 4.1 from 2004 ethanol total value export was 79 million dollars and in 2008
increased to 2,336 million dollars. In 2010 the joint venture between Shell a country oil exploration and production and distribution of derivatives, and Cosan, the largest ethanol producer, that had previously purchased Esso's fuel distribution stations. This new
25
company, called Raízen today is the biggest exporter of sugar and the main ethanol producer
The government incentives on the sell of Hybrid cars has also a big factor, from the perspective from customer ethanol was not a stable market, 2003 is the second time ethanol tried to enter the market, consequently a hybrid car was much more attractive than other options, with the government incentives the IPI ( Industrial product tax ) to produce a hybrid car ( over 2000cc ) was 18 % ( 2004 ) and the gas car was 25% ( 2004 ) as we can see in the table 2.2 .
Fig 4.5: New Sugarcanes Factory Plants in Brazil
Source: EPE 2017
Table 4.1 Brazil Ethanol Exportation Value Dollars
Destination 2004 2005 2006 2008 2009 2010 Value Million Dollars
United States 79 70 748 756 135 186
EU-27 73 155 232 679 384 227
Total 461 743 1,437 2,366 1,338 1,013
Source: USDA, Economic Research GTI (2010)
8 24 26 33 22 14 5 2 3 0 5 10 15 20 25 30 35 2005 2006 2007 2008 2009 2010 2011 2012 2013
New Sugarcane Factory Plants
26
4.2.3 Social
The reception of the new type of hybrid car received with high acceptance, in 2004 the total of Hybrid light vehicles in Brazil was 15% after 4 Years later the total was 74.7% and today is 88%.The main reason the high acceptance of hybrid cars was mainly
because of non-dependency in one type of fuel. According to Pesquisa Direta 60% of the Hybrid car buyers main reason is due to second fuel option, and 23% for low cost wise (Figure 4.6).
Figure 4.6 Consumer main reason to buy Hybrid Car
Source: Pesquisa Direta – Instituto Olhar 2010
0% 10% 20% 30% 40% 50% 60% 70% Others Environment Technology Price Flexibility Convenience Ethanol Cost Option Ethanol & Gasoline
27
4.2.4 Technological
Prices of oil and the derivatives was on rise since the late 1990s, the price of gas rose accordingly, and ethanol became more and more attractive. But the lack of consumer confidence in the ethanol industry was high. When buying a ethanol car, the consumer would be again dependent on type of fuel. The solution found by the automobile industry was the introduction of the flex car.
Another important factor was the investment in the The Sectoral Funds of Science and Technology, created since 1999, are instruments for financing research, development and innovation projects in the country. The revenues of the Funds come from contributions levied on the result of the exploitation of natural resources belonging to the Union, portions of the Industrialized Products Tax of certain sectors and the Contribution of Intervention in the Economic Domain (CIDE) , annually FAPESP Ethanol project ( São Paulo Research Foundation ) receive R$ 30 million (2006).
Table 4.2 Ethanol Industry Investments
Private Sector (2006) Estimated value
CTC Centro de Tecnologia Canavieira R$ 45 million
Dedini R$ 19 million
Indústria de Máquinas Agrícolas (Case, John Deere, outras) R$ 15 million
Public sector ( 2006 )
Ridesa ¹ R$ 1,35 million
Embrapa (energia e etanol) ¹ R$ 13 million
IAC / Centro Cana ¹ R$ 3 million
UNICAMP ¹ R$ 3 million
UFRJ ¹ R$ 4,5 million
BNDES (Funtec) R$ 12 million
Fundos Setoriais:
CT-Energ, CT-Petro, CT-Agro recursos CNPq e FINEP R$ 22 million
FAPESP (Programa Etanol) R$ 30 million
28
4.3 Fall of Ethanol
This Section will analyze the Political, Economic, Social, Technological, Legal and Environmental factors of the Fall of ethanol during the period between 2010-2017. 4.3.1 Political
After stimulating the consumption of hydrated ethanol in the 1970s, and subsequently having encouraged the purchase of flex-fuel vehicles, the biggest challenge presented to the sector recently is the reversal of this policy directed at the ethanol industry, mainly between 2011 and the end of 2014 the control of gasoline prices. In the middle of the year 2012 the import price of gasoline was R$ 1.6 reais, but in the posts the price was R $ 1.2 reais (Figure 4.7), affecting ethanol’s competitiveness considerably as we can see in the Figure 4.8. This price control considerably affected the demand for ethanol and the collection of economic funds, consequently generating a greater debt for the country.
Figure 4.7: Brazil Gasoline price 2002-2015
29
Figure 4.8: Ethanol vs Gasoline Price and Sales Comparison
Source: EPE (2017)
Thus, in early 2015, the government interpreted that it should assist the ethanol industry, and determined the increase in the anhydrous ethanol content in gasoline from 25% to 27% in March. It is a policy that favors the sector, but it can disadvantage the consumer and create distortions in the price relationship between hydrated ethanol and gasoline C. In addition to increasing the content of anhydrous ethanol in gasoline, it ensures a
demand for ethanol, reduces production allocated to ethanol hydrate, which may have the effect of raising prices.
0% 10% 20% 30% 40% 50% 60% 70% 80% 5,000.00 10,000.00 15,000.00 20,000.00 25,000.00 30,000.00 35,000.00 40,000.00 45,000.00 50,000.00 2001 2002 2003 2004 2005 2006 2007 2008 2009 2010 2011 2012 2013 2014 2015 2016
Ethanol Vs Gasoline Sales
30
4.3.2 Economical
The gasoline price drop from US $ 3.28 per gallon in June 2008 to US $ 0.96 per gallon in December (figure 4.9), Gasoline as substitute goods to ethanol expected to increase the demand in 2008, but the gasoline consumption in Brazil didn’t increased considerably , on the contrary in 2008 the usage rate ethanol increased from 35%% to 39% in 2009 ( figure 4.6), consequently the rise of international oil price didn’t affect the gasoline price directly, but highly affected the costs of production as we can see in chapter 2.3 literature review .
Figure 4.9: Gasoline International Price US Dollars per Gallon
Source: INDEX Mundi 2018
The 2008 financial crisis found the sector vulnerable and soon after a fall in sugar prices that had occurred in 2007 (Figure 4.11). Consequently, In the 2012/2013 harvest, there was an estimated total debt accumulated of almost R $ 60 billion (figure 4.10), equivalent to 100% of the production chain's revenues. This percentage is, in fact, indicative of a worrisome situation, including estimates of continuity of negative margin in the production of hydrated ethanol.
0 0.5 1 1.5 2 2.5 3 3.5 Jan -04 A u g-04 Mar -05 O ct -05 May-06 De c-06 Ju l-07 Fe b -08 Se p -08 A p r-09 N o v-09 Ju n -10 Jan -11 A u g-11 Mar -12 O ct -12 May-13 De c-13 Ju l-14 Fe b -15 Se p -15 A p r-16 N o v-16 Ju n -17 Jan -18 U SD
31
Figure 4.10: Sugarcane sector debt estimation
Source: Adapted from Nastary (2014) Value of the 2012/2013 crop estimated by Nastary (2014). The crop 2013/2014 was estimated by the authors 4
Figure 4.11 International Sugar Price
Source: Index Mundi 2018
Sugarcane production is directly linked to the renewal of sugarcane plantation and the climate, the older the plantation, the lower its productivity, renewal the plantation is only acquired with investments. As we can see in Figure 4.13 the average age of the 2016/17 crop rose from 3.22 to 3.84 and its productivity fell from 80.5% to 75.3% , also from 2013/14 the renew and expansions was lower each year passed, showing less investment was made as we can see in figure 4.12 and 4.14
0 0.05 0.1 0.15 0.2 0.25 0.3 0.35 0.4 0.45
32
Figure 4.12 Sugarcane Productivity & Renew,Expansion plantation
Source: EPE 2017
Figure 4.13 Average number of cuts/harvests per life cycle
Source: EPE 2017
Productivity Expansion % Sugarcane plant Best outline
Renew % S u ga rc an e p la n t
Dry Season Dry Season Rainy Season
To ta l nu mbe r o f cu ts /Ha rv e sts
33
Figure 4.14 Governmental Investments in sugarcane harvest
Source: EPE ( 2017)
4.3.3 Social
The burning of the sugarcane is one of steps in cutting process , the advantages of the burning of the sugarcane cut include in several aspects: increase of the cutting speed, increase in the material density in the transport and less wear in the grinding machines, in relation to the manual cutting without burning the burning step reduce the cost,
Piracicaba the cut cost in 2012 of the process Manual planting and manual cutting without burning was of 57.83 R $ / t in contrast the cost of manual planting and manual cutting with burning was 54.22 R $ / t (figure 4.15 ). The burning has positive aspects in production but also creates difficulties for society around the plantations: soot, high water consumption, road accidents, public health and the elimination of wild animals in the area.
R$
B
ill
ion
s
Other Programs
34
Figure 4.15 Sugarcane Planting and cutting Process Cost Comparison 2012 OCT (R$/t)
Source: Nachiluk e Oliveira (2013) PM (Manual Planting) -- CMec (Mechanical Harvest) – CM Crua (Manual Harvest) – CM queimada ( Manual Harvest with burn out assistance)
The demand of ethanol inside of the country is highly affected to the price as we can see in the Figure 3.12 in 2014 to 2016 ( Total 88% small cars are Hybrid ) the price ration between ethanol went from 0.695, 0.667, 0.720 and the sales ratio between Ethanol and gasoline went 21.47%, 29.28% , 24.54%. According to Drs. Roberta Castro & Heidy Rodriges & Claudia Terezinha (2016) Brazil the gasoline prices has much more impact in the ethanol demand than the ethanol prices as we can see in the Figure 4.16, 4.17,
consequently showing the Brazilian population has higher preference in gasoline, the data collected is 2002/2003 when the hybrid car just entered the market , similar results were found by Farina et al. (2010) and Randow et al. (2010).
35
Figure 4.16 Brazil Ethanol average probability consumption (2002-2003)
Source: Análise da preferência de consumidores por etanol e gasolina no Brasil (2016 ), Roberta Castro Morizono
Figure 4.17 Brazil Ethanol average probability consumption (2002-2003)
Ethanol Price Rise Brazil
Gasoline Price Reduction Brazil
Gasoline Price Reduction North Brazil Ethanol Price Rise North Brazil
Gasoline Price Rise Brazil Ethanol Price Reduction Brazil
Gasoline Price Rise North Brazil Ethanol Price Reduction North Brazil Brazil Ethanol Average Probability consumption (2002-2003)
Price change %
Brazil Ethanol Average Probability consumption (2002-2003)
36
Source: Análise da preferência de consumidores por etanol e gasolina no Brasil (2016), Roberta Castro Morizon
4.3.4 Technological
There are no major Technological factors found that have high negative impact in the ethanol industry, only positive advancements and achievements.
4.4 Ethanol in United States of America
In the U.S, ethanol fuel is mainly used as an oxygenate in gasoline in the form of low-level blends up to 10 percent, and to an increasing extent, as E85 fuel for flex-fuel vehicles. Today Is the biggest ethanol producer in the world producing 15.8 billion gallons while Brazil production is 7 billion gallons.
4.4.1 Ethanol Policy
The Renewable Fuel Standard (RFS) is a federal program that requires transportation fuel sold in the United States to contain a minimum volume of renewable fuels. The RFS originated with the Energy Policy Act of 2005.
The first RFS program, referred as RFS1, required that 4 billion gallons of biofuel be used in 2006. This requirement was scheduled to rise to 7.5 billion gallons in 2012. These requirements were passed as part of the Energy Policy Act of 2005. The Energy
Independence and Security Act of 2007 changed and broadened these rules. The changes required by the 2007 legislation referred as RFS2. Required the use of 9 billion gallons in 2008 and scheduled a requirement for 36 billion gallons in 2022. The quota for 2022 was to allow no more than a maximum of 15 billion gallons from corn-starch ethanol and a minimum of 16 billion gallons from cellulosic biofuels.
4.4.2 Impact Ethanol in the Food Prices
According Condon, Klemick, Wolverton ( NCEE 2013) ‘’ Economic theory suggests that diverting a sizable share of corn production to ethanol for fuel will put upward pressure on corn prices. While several empirical analyses confirm this finding, the literature has reported price effects from biofuel expansion ranging from nil to over 70 percent.’’
37
4.4.3 Corn vs Sugarcane
According to Luk (2010) ‘’ The process to obtain ethanol from corn costs more because corn starch must first be converted into sugar before being distilled into alcohol;
sugarcane already contains the sugar in the form necessary to produce ethanol’’
Table 4.3 Corn Vs Sugarcane Ethanol
Characteristic US Brazil
feedstock corn sugarcane
total ethanol fuel production (2009) (million gallons) 10,750 4,200 total area used for ethanol crop (million acres) 24.71 8.90 productivity (gallons per acre) 330-424 727-870 energy balance (energy obtained / energy expended) 1.3-1.6 8.3-10.2 greenhouse gas emission reduction 10-30% 86-90%
cost of production (USD/gallon) 1.14 0.83
38
CHAPTER FIVE
Concluding Remarks
According to the Literature review and Method analysis in previous chapters, we found the reasons of ethanol fall in Brazil:
5.1. Currently ethanol industry in Brazil
The Gasoline sales have been increasing in 3 years today reaching 44 million m³ while Ethanol have been decreasing 3 years consecutive today 13 million m³ Today debt is R$100 billion with a little more R$ 100 billion in revenue per year World biggest sugar producer with 21% total participation (2017)
Second biggest ethanol producer with 27%
The sector contributed with US$ 30 billion equivalent to 1.67% of total Brazil GDP
5.2. Rise of Ethanol
During 2001-2008 the price of Oil rise and CIDE (Contribution of Economic Domain Intervention) the gasoline price raised a level that ethanol became more favorable during 2004-2005 the ethanol price in average 58 % % of gasoline price.
During the rise of price of gasoline during 2001-2003 the Automobile industry lunched a new type a product, hybrid car. Giving consumer a new type of fuel option and a innovative product. In 2003 Hybrid light vehicles only represented 2.9% later in 2006 56.4 % and in 2009 84%.
2005-2007 Ethanol Alliance with United States, Brazil receive large boost of investments, 58 new Sugarcane process mill opened in only 3 years. Exportation of ethanol went from US$ 461 million to US$ 2,366 million 2004 and 2008 respectively.
39
5.3 Fall of Ethanol
The high investments in the ethanol industry during 2005-2007 and later the 2008 crisis leaded to high debt to the ethanol mills consequently shutdown of more than 80 mills. In 2012/2013 harvest, there was an estimated total debt accumulated of almost R$ 60 billion (figure 4.4), equivalent to 100% of the production chain's revenues, and today debt is R$100 billion with a little more R$ 100 billion in revenue per year.
The rise of the International oil price in 2011-2014 leaded to all oil derivatives price rise, the Brazilian government kept the gasoline price low due to control the inflation, consequently the ethanol market struggled and the public debt raised, one of the public companies Petrobras (oil company ) raised from R$ 31 billion , R$ 117,9 billion ,R$ 506 billion respectively 2003, 2010, 2015.
In early 2015, the government raised the ethanol anhydrous in gasoline rate from to 25% to 27% due to boost the ethanol usage, but backfired due to focus
reallocation and increase of ethanol prices. 5.4 Suggestions:
Create a program fully focused in the progress of ethanol industry, one of the biggest example we have is the program Pró-Á lcool during 1973 in Brazil. Today there is a Biofuel program on hold in congress called RenovaBio, now is one of the most important periods. My suggestion for initiating this program is to main focusing in the long -medium term planning in the ethanol, biodiesel and sugar also laws protecting the development and production.
The world population exponential growth, Fuel or Food is one of the main issues in the Biofuel industry, corn one of the main ethanol sources different from sugarcane has high impact in the food chain, in addition the productivity and the efficiency of ethanol fuel corn based is not optimal, comparing sugarcane to corn in ethanol usage corn fall behind to sugarcane (Table 4.3). In the future corn fuel will have limitations giving Sugarcane fuel better prospects.
40
5.5 Restriction of the study:
The Biofuel Industry is around the whole world, this study only regards to Ethanol from Sugarcane in Brazil due to the follow reasons.
• Sugarcane is only viable with tropical weather
• Sugarcane is only viable country with large area farmable 5.6 Suggestions for future Studies
For the future studies, it may review the follow issues Consumer sensitivity in relation to ethanol
Environmental weight to the consumer
Sugarcane ethanol replacing corn ethanol feasibility Micro environment study 1998-2018
41
References
1. Análise da preferência de consumidores por etanol e gasolina no Brasil (2016 ), Roberta Castro Morizono , Heidy Rodriguez Ramos, Cláudia Terezinha Kniess 2. André de Souza Melo and Yony de Sá Barreto Sampaio (2014) IMPACTOS DOS
PREÇ OS DA GASOLINA E DO ETANOL SOBRE A DEMANDA DE ETANOL NO BRASIL
3. Associação Nacional dos Fabricantes de Veículos Automotores ( ANAFVA ) 2016
4. Carlos Eduardo Fredo (2015)- Setor Sucroalcooleiro Paulista: crise nos empregos em 2014
5. Carlos Xavier, Daniel Sonoda Custos de produção de cana-de-açúcar, açúcar e etanol no Brasil: Fechamento da safra 2012/2013
6. CBN Goiana, André Rocha President of the Union of the Ethanol Manufacturing Industry of the State of Goiás and president of the National Sugar and Energy Forum, 2017 CBN Dívida do setor sucroalcooleiro já passa dos R$ 100 bilhões Interview
7. Cinthia Cabral da Costa and Heloisa Lee Burnquist (2016) Impactos do controle do preço da gasolina sobre o etanol biocombustível no Brasil
8. EVALUATION OF FLEX FUEL VEHICLE USER PERFORMANCE IN THE CONSUMPTION OF FUELS IN BRAZIL (EPE 2013 )
9. EPE (2016) ANÁ LISE DE CONJUNTURA DOS BIOCOMBUSTÍVEIS 10. Ethanol Fuel Production Brian Luk (2010)
11. Farina et al. (2010) and Randow et al. (2010)
12. F.O. Lichts. «Industry Statistics: 2010 World Fuel Ethanol Production». Renewable Fuels Association.
13. Impacts of Ethanol Policy on Corn Prices: A Review and Meta -Analysis of Recent Evidence Nicole Condon, Heather Klemick and Ann Wolverton (2013) 14. IOGP International Association of Oil & Gas Producers 2017
15. José Goldemberg (2008) Sugarcane Ethanol
16. Leandro Gilio and Nicole Rennó Castro (2016) AVALIAÇ Ã O DE ASPECTOS LIMITANTES AO CRESCIMENTO DO ETANOL E O SETOR
SUCROENERGÉ TICO NO BRASIL
17. Lima, P. C. R. (2009) Os carros flex fuel no Brasil. Câmara dos Deputados. Nota Técnica da Câmera dos Deputados.
18. Lívia de Oliveira and Renata Barrocas (2003)VANTAGENS E
DESVANTAGENS NA QUEIMADA DA CANA,NO ESTADO DE SÃ O PAULO, BRASIL
19. Martines - Filho, J., Burnquist, H. L., & Vian, C. E. (2006). Bioenergy and the rise of sugarcane - based ethanol in Brazil.
42
20. Moraes, M. A. F. D. (2007). O mercado de trabalho da agroindústria canavieira: desafios e oportunidades. Economia Aplicada, Ribeirão Preto, 11(4), 605 - 619. 21. Moraes, M. A. F. D e Zilberman, D. (2014). Production of ethanol from
sugarcane in Brazil. Springer, Londres.
22. National Agency of Petroleum, Natural Gas and Biofuels (ANP) Anuário Estatístico 1996-2017
23. Schechtman, R. (2003). Uma nova era para o álcool. Revista Conjuntura Econômica,57(9), 42 –
24. Sergio Barros (2016) Brazil Annual Report 2016 – Global Agricultural Information Network