行政院國家科學委員會專題研究計畫 成果報告
不同升糖指數的飲食與運動對脂肪代謝的影響
計畫類別: 個別型計畫 計畫編號: NSC94-2413-H-028-003- 執行期間: 94 年 08 月 01 日至 95 年 07 月 31 日 執行單位: 國立臺灣體育學院運動健康科學學系 計畫主持人: 巫錦霖 計畫參與人員: 蔡怡姍 報告類型: 精簡報告 報告附件: 出席國際會議研究心得報告及發表論文 處理方式: 本計畫可公開查詢中 華 民 國 95 年 10 月 31 日
行政院國家科學委員會補助專題研究計畫
█
成果報告
不同升糖指數的飲食與運動對脂肪代謝的影響
The effect of different glycemic index diet and exercise on fat metabolism
計畫類別:█ 個別型計畫 □ 整合型計畫
計畫編號:NSC
94-2413-H-028-003-執行期間: 94 年 8 月 1 日至 95 年 7 月 31 日
計畫主持人:巫錦霖
計畫參與人員: 蔡怡姍
成果報告類型(依經費核定清單規定繳交):█精簡報告 □完整報告
本成果報告包括以下應繳交之附件:
□赴國外出差或研習心得報告一份
□赴大陸地區出差或研習心得報告一份
█出席國際學術會議心得報告及發表之論文各一份
□國際合作研究計畫國外研究報告書一份
處理方式:除產學合作研究計畫、提升產業技術及人才培育研究計畫、
列管計畫及下列情形者外,得立即公開查詢
□涉及專利或其他智慧財產權,□一年□二年後可公開查
詢
執行單位:國立臺灣體育學院運動健康科學系
中 華 民 國 九 十 五 年 十 月 三 十 一 日
不同升糖指數的飲食與運動對脂肪代謝的影響-中文摘要
以升糖指數(glycemic index, GI) 來分類食物中碳水化合物的來源已被廣泛的運用。再 過去十年來的流行病學的研究顯示,攝取高GI 碳水化合物的飲食,與心血管疾病,糖 尿病,肥胖症,以及一些癌症有密切的關係。上述的這些慢性疾病,與脂肪代謝異常 有高度的相關。這有可能是因為攝取高GI 的碳水化合物,導致分泌大量的胰島素,進 而促進脂肪的貯存,然而這些流行病學的研究缺乏臨床的實驗來證實。另外,在一些 研究指出,低脂高碳水化合物的飲食配合步行運動(brisk walking),能有較佳的脂肪耐 性測驗表現,但是這些飲食的設計,並未考慮其碳水化合物來源的生理效應。本研究探 討不同GI 碳水化合物的飲食與運動對於脂肪代謝的影響。六名受測者接受兩次連續三 天分別隨機的給予高或低GI 的飲食,飲食控制期結束後第四天實施口服脂肪耐性測驗 (oral fat tolerance test)。另外兩次給予受測者相同的飲食控制,並且在飲食控制期,以 50%VO2max 走路運動一小時。結果顯示運動能夠有效的降低餐後血液中的三酸甘油脂濃 度,但是在低GI或者高GI之間並沒有顯著差異。而低GI的飲食加上運動能有較佳的胰島 素敏感度。關鍵字:升糖指數,運動
The effect of different glycemic index diet and exercise on fat metabolism
Glycemic index (GI) as a classification of carbohydrate has been wildly received notice. In the past ten years, many epidemiological studies have been shown strong connection between high GI carbohydrate diet and cardiovascular diseases, diabetes, obesity, and cancers. The above chronic diseases and symptoms are highly related to abnormal fat metabolism, especially on obesity objects. This may be due to high GI carbohydrate induces massive insulin secretion to facilitate fat storage. However, these epidemiological studies are in short of clinical or experimental trials on the effect of GI diet on the fat metabolism. In addition, several studies have been shown the positive effects of low fat diet and exercise on fat tolerance performance. However, these studies did not consider the nature of carbohydrate source. Six healthy male subjects with normal weight was recruited in each study. Subjects consumed either high or low GI diet without exercise (HGI, LGI) or with exercise (HGI+EX, LGI+EX) at 50%VO2max for three days in a randomized order before undertaking the fat tolerance test (OFTT). The results showed that exercise trials were effectively attenuated postprandial lipemia. Glycemic index carbohydrate effect were no observed. However, LGI+EX may improve insulin sensitivity.Introduction
The glycaemic index (GI) was initially proposed in 1981 (Jenkins et al. 1981). The GI of a food is defined as the incremental area under the blood glucose response curve following the intake of carbohydrate-rich food containing 50g available carbohydrate (CHO), expressed as a percent of the incremental area under the curve (IAUC) of blood glucose response following the intake of 50g CHO from the standard food (glucose or white bread, GI=100) as applied to the same individual.
The GI of a mixed meal can be calculated from the contribution of single food to the whole meal. The mixed meal GI value calculation method was proposed byWolever and Jenkins (1986) as follows,
TC: Total carbohydrate content of meal (in gram) GIa, GIb, GIc, …: GI value of individual food
Wa,Wb,Wc,……: Carbohydrate content of each food (in gram)
Total GI of the meal = (Wa/TC)*GIa+ (Wb/TC)*GIb+ (Wc/TC)*GIc+….
In a report published in 1998, the FAO and WHO recommended the use of the GI as a method of categorizing CHO foods because the GI provides information on the likely physiological effects of ingested CHO. The GI has been widely used for clinical nutrition, especially for diabetics, and more recently in health promotion, because of the concerns over obesity, cardiovascular disease and specific cancers.
Recently, the GI has been used as one of the key factors for in prevention of obesity, Type II diabetes, hyperlipidaemia, cardiovascular diseases and some specific cancers in the general population (Brand-Miller et al. 2002; Pi-Sunyer, 2002; Leeds, 2002; Jenkins et al. 2002; Liu and Willett, 2002; Willett et al. 2002). It has been suggested that high GI foods are
detrimental to health due to postprandial hyperglycaemia and hyperinsulinaemia which can lead to insulin resistance (Brand-Miller 2003).
In addition to epidemiological studies, nutritional intervention studies indicate that a low GI diet might be beneficial in maintaining normal blood lipid profiles in healthy subjects, hyperlipidaemic subjects, diabetes mellitus patients, and patients with CHD (Jenkins et al.
1987; Wolever et al. 1992a; Frost et al. 1996; Frost et al. 1998; Jarvi et al. 1999). Ingestion of low GI foods may be beneficial for weight control in two ways: by promoting satiety and by promoting fat oxidation at the expense of CHO oxidation ( Holt et al. 1992; Holt et al. 1996; Wee et al.1999; Ludwig et al. 1999; Brand-Miller et al. 2002; Ludwig, 2000; Febbraio et al. 2000). Some long-term studies in human and animal models have shown the benefit of low GI foods for weight control in obese populations (Wolever et al. 1992b; Slabber et al. 1994; Kabir et al. 1998; Pawlak et al. 2001; Spieth etal. 2000).
Several studies have shown that consuming low GI carbohydrate pre-exercise meal elicit higher rate of fat oxidation when compared to ingestion of high GI carbohydrate meal during postprandial period and during subsequent exercise (Febbraio et al. , 1996; Spark et al. 1998; Kirwan et al. 1998; Wee et al., 1999; Kirwan et al. 2000; Wu et al., 2003). These evidences might indicate that short term GI diet possibly change metabolic responses especially on fat metabolism. Recently, some studies demonstrated that the short term dietary manipulation could significantly alter fat metabolism (Hardman et a, 1998; Gill et al., 2000, 2001; Koutsari and Hardman, 2001). However, these studies did not consider the GI value of carbohydrate in the diet. Therefore, the study was to investigate the effect of different GI carbohydrate diets and exercise on the fat metabolism. The study may provide a clinical evidence to support those epidemiological studies on the effect of low GI diet on fat metabolism.
An increased plasma concentration of high-density lipoprotein (HDL) cholesterol is the most consistentalteration to the lipid profile evident following a program of regular aerobic
exercise (Durstine and Haskell, 1994; Leon and Sanchez, 2001). Kurtsari and Hardman (2001) demonstrated a three-day high-carbohydrate diet (70% energy from carbohydrate)which
increased the postprandial triglycerides response to oral fat tolerance test by 35% when compared to an isoenergetic three-day mixed diet (46% energy from carbohydrate). However, 30 min of daily moderate exercise for three days during the high-carbohydrate diet
intervention prevented the carbohydrate-induced augmentation in postprandial lipemia. Several studies also demonstrated that the effects of daily exercise (60 min brisk walking) might oppose the postprandial lipemia (Gill and Hardman, 1998; Koutsari et al., 2001; Gill et al., 2000, 2001).However, these studies did not consider the GIs of the high-carbohydrate diet. This study was aimed to examine the effect of daily exercise with different GI diets on the fat metabolism.
METHODS Subjects
Six healthy, inactive subjects with normal body fat were recruited in this study. The protocol has been approved by the National Taiwan College of Physical Education Human Ethical Advisory Committee and all subjects were given their written informed consent.
Experimental design
Subjects were asked to consume either high GI or low GI diet with or without exercise for three days in a randomized order before undertaking the oral fat tolerance test (OFTT). Each trial was separated by at least one week. On the first day of the dietary control period, subjects reported to the laboratory after 10-12 hours overnight fast. After obtaining subject’s height and nude body mass, the dietary control period then began. All the foods were served by the laboratory during the three-day dietary control. Three days later, on the day four, subjects were asked to report to laboratory for the OFFT. Trial 1 and 2 was non-exercised trial (HGI and LGI), and trial 3 and 4 was exercised trial (HGI+EX and LGI+EX) .
Trial 1 and 2 HGI or LGI diet without exercise 3days OFTT
Trial 3 and 4 HGI or LGI diet with exercise OFTT
Day 1-3 Day 4 Fig 1. Trial Scheme.
Dietary control
Each subject received an isocaloric and isomacronutrient diet containing either high GI or low GI carbohydrates during three-day dietary control. The energy content depends on subject’s body mass which was set at 35 kcal/kg body mass and the macronutrients distribution is 55% carbohydrate, 15% protein, and 30% fat. As the GI values for the mixed diet is calculated by the method proposed by Wolever and Jenkins (1986), the GI values for high GI and low GI diet is 80 and 40 respectively. All the diet was prepared by the laboratory and subjects collected or consumed their meal at the laboratory. All foods used in the diet were purchased in the same supermarket and the commercial products’ macronutrtient contents were based on the information provided by the manufactures. Subjects were asked to consume the foods served from the laboratory only. Water consumption was ad libitum during the dietary control period. During the dietary control period, subjects were asked to avoid any heavy physical activity or exercise during non-exercise or exercise trials.
Oral fat tolerance test meal
Oral fat tolerance test meal comprised whipping cream, cheese, mixed nuts, muesli, white bread and butter. The amount of the macronutrients and energy were given to subjects according to their body mass (1.2g/kg fat, 1.1g/kg carbohydrate, 0.33g/kg protein, and 66 kJ/kg) (Hardman et al. 1998). All foods were purchased at the same supermarket and the macronutrient contents were provided by the manufacturers.
Preliminary exercise tests
After the first two non-exercise-trial, one week before the exercise-trial, subjects were asked to visit laboratory for two preliminary exercise tests: maximal oxygen uptake (V&O2max) test
and submaximal oxygen uptake test.
Maximal Oxygen Uptake Test: Uphill treadmill walking was used to determine theV&O2maxof each subject. The protocol is modified from Taylor et al (1955). The speed of
treadmill was kept constant throughout the test and the inclination will be increased by 2.5 % from an initial 3.5% every 3 min until the subjects reach volitional fatigue. Expired air samples will be measured using a gas analyzer (Vmax, USA).
Submaximal Walking Test: A 16 min continuous submaximal walking test, consisting of four stages, was used to determine the relationships between walking intensity and oxygen uptake (V&O2). Expired air samples was measured for determination of V&O2. A linear
regression equation was then calculated for the relationship between V&O2 and walking
intensity from the 16 min submaximal walking test. The data was to determine the walking intensity corresponding to 50% of each subject’s V&O2maxto be used in the exercise-trials.
On a separate day, one week before the trial, subjects was asked to complete a 30 min walk corresponding to 50%V&O2max in order to confirm the relative exercise intensity and to fully
familiarize them with treadmill walking and the experimental procedures.
Protocol
After the three-day dietary control (with or without exercise at 50%VO2max), subjects reported to the laboratory after a 12 hour overnight fast in the morning on the fourth day. The subjects were to void before nude body mass was obtained. Body mass of the subjects was
measured using a calibrated balance (Avery 3306 ABV) and height was measured using a stadiometer. After weighing, a cannula was inserted into an antecubital vein while the subject is lying on an examination couch.
Basal blood and gas samples were obtained after the subject has sat for 10 min. The oral fat tolerance test meal was then served, which the subject was asked to consume within 20 min. After finishing the test meal, the six hours postprandial period starts. During the postprandial period, subjects were asked to remain seated, avoiding any unnecessary physical activity. During the postprandial period, water was provided ad libitum in the first trial and then replicated in the next three oral fat tolerance tests.
Ambient temperature and relative humidity was recorded at 30 min intervals during the postprandial period using a hydrometer (Zeal, England). Temperature was maintained between 25-28℃ in all trials. All trials were held in the same laboratory under the similar environmental condition.
Blood sample collection and analysis
Blood samples were obtained from a cannula (Venflon 20G, Sweden) in the antecubital vein, which was connected to a 3-way stopcock (Connecta Ltd., Sweden) with a 10cm extension tube. The cannula was frequently flushed with a sterile sodium chloride solution (0.9% w/v) to keep it patent throughout the experiment. Blood samples were obtained with subjects in the sitting position during the postprandial period. In addition to the basal blood sample, further samples were obtained at 30min, 60min, 120min, 180min, 240min, 300min and 360min during the postprandial period.
Ten millilitres of blood was collected at each sampling time. An 8ml blood sample was put into an EDTA tube and centrifuged at 1500g’ for 10 min to obtain plasma. The remaining blood (~2ml) was placed into a non-heparinized tube and left to clot for 1 hour and then centrifuged at 1500g’ for 10 min for obtaining serum samples. Plasma and serum samples was aliquoted and then stored at –70℃ for later analysis. The plasma was analyzed for free fatty acid (FFA) (ACS-ACOD method, Wako NEFA C, Germany), triglycerides (GPO-PAP method, Randox, Ireland), glucose (GOD-PAP method, Randox, Ireland), cholesterol, high density lipoprotein-cholesterol (HDL-C). The serum insulin concentration was analysed by
enzyme-linked immunosobent assay (ELISA) by an ELISA reader (Ultramark Microplate System, Bio-Rad Ltd. , USA).
Statistical analysis
All results are presented as mean ± SEM. A two-way ANOVA (time and treatment) for repeated measures was used to analyze differences in the physiological and biochemical responses. The Tukey post-hoc test was applied to locate the differences between means when a significant difference was found. Student’s paired t-test was used for non-time dependent variables. Significance was set at the 0.05 level of confidence.
RESULTS AND DISCUSSION
Plasma triacylglycerol (TG)
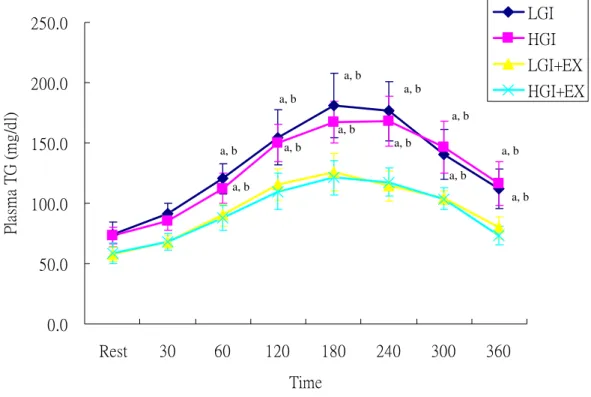
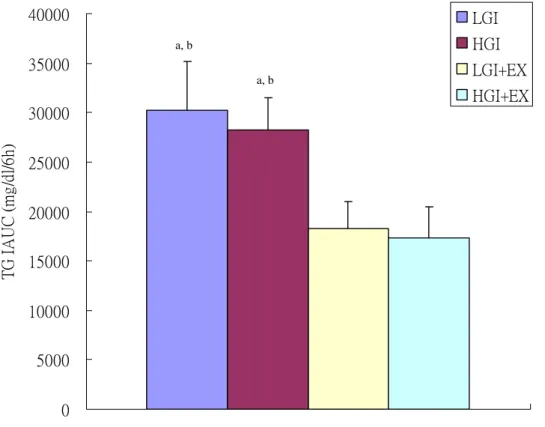
Plasma triacylglycerol (TG) concentrations were significantly higher during OFTT in the non-exercise trials, LGI and HGI, when compared to the exercised trials, HGI+EX and LGI+EX (Fig 2). The incremental area under the plasma triacylglycerol curve (IAUC) was significantly higher in the LGI and HGI than in the LGI+EX and HGI+EX (Fig 3).
0.0 50.0 100.0 150.0 200.0 250.0 Rest 30 60 120 180 240 300 360 Time Pl as m a T G ( m g/ d l) LGI HGI LGI+EX HGI+EX
Fig 2. Plasma triacylglycerol (TG) concentrations during oral fat tolerance test (OFTT).
LGI: low glycemic index diet trial. HGI: high glycemic index diet trial. LGI+EX: low glycemic index diet + exercise trial. HGI+EX: high glycemic index diet + exercise trial.
a: Significantly different from LGI+EX b: Significantly different from HGI+EX
a, b a, b a, b a, b a, b a, b a, b a, b a, b a, b a, b a, b
0 5000 10000 15000 20000 25000 30000 35000 40000 TG I A U C ( m g /d l/6 h) LGI HGI LGI+EX HGI+EX
Fig 3. Plasma triacylglycerol (TG) concentrations incremental area under the curve (IAUC) during oral fat tolerance test (OFTT).
LGI: low glycemic index diet trial. HGI: high glycemic index diet trial. LGI+EX: low glycemic index diet + exercise trial. HGI+EX: high glycemic index diet + exercise trial.
a: Significantly different from LGI+EX b: Significantly different from HGI+EX
a, b
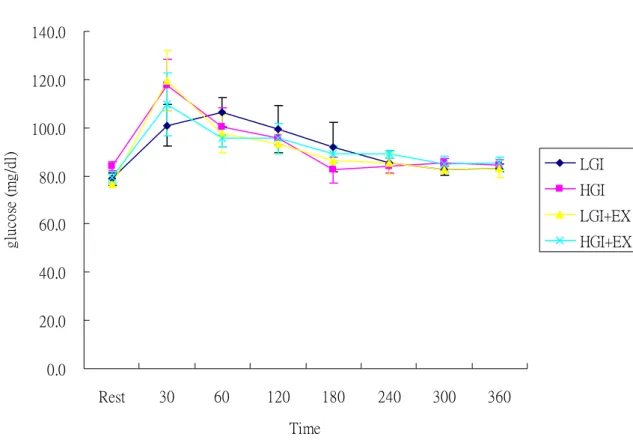
Plasma glucose
Plasma glucose concentrations were elevated and peaked at 30 min and decreased gradually during OFTT. However, there were no significant differences between trials during OFTT (Fig 4) 0.0 20.0 40.0 60.0 80.0 100.0 120.0 140.0 Rest 30 60 120 180 240 300 360 Time gl uc os e (m g/ dl ) LGI HGI LGI+EX HGI+EX
Fig 4. Plasma glucose concentrations during oral fat tolerance test (OFTT).
LGI: low glycemic index diet trial. HGI: high glycemic index diet trial. LGI+EX: low glycemic index diet + exercise trial. HGI+EX: high glycemic index diet + exercise trial.
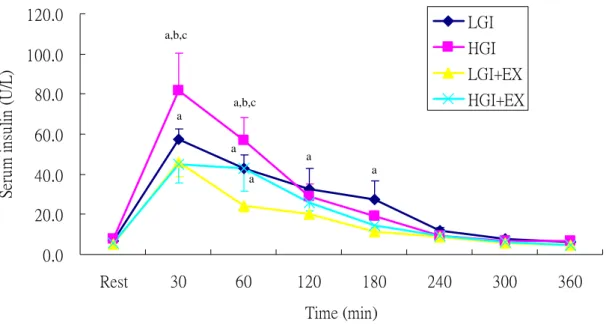
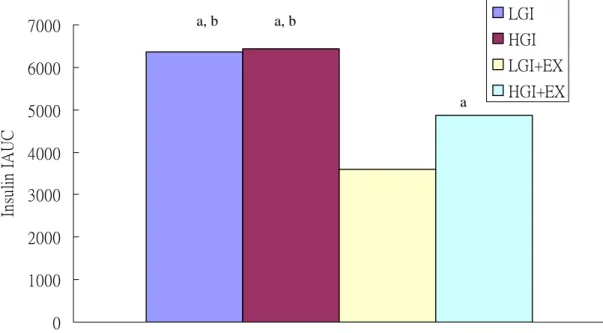
Serum insulin
Serum insulin concentrations were significantly higher in HGI trial than LGI, LGI+EX and HGI+EX trials at 30 min during OFTT (p<0.05, Fig 5). We calculated the incremental area under the insulin curve (insulin IAUC). The results showed that the LGI+EX were
significantly lower than HGI, LGI and HGI+EX (p<0.05, Fig 6)
0.0 20.0 40.0 60.0 80.0 100.0 120.0 Rest 30 60 120 180 240 300 360 Time (min) Se ru m in su lin ( U /L) LGI HGI LGI+EX HGI+EX
Fig 5. Serum insulin concentrations during oral fat tolerance test (OFTT).
LGI: low glycemic index diet trial. HGI: high glycemic index diet trial. LGI+EX: low glycemic index diet + exercise trial. HGI+EX: high glycemic index diet + exercise trial.
a: Significantly different from LGI+EX b: Significantly different from HGI+EX c: Significantly different from LGI
a,b,c a a,b,c a a a a
0 1000 2000 3000 4000 5000 6000 7000 In su lin I A U C LGI HGI LGI+EX HGI+EX
Fig 6. Serum insulin concentrations incremental area under the curve (IAUC) during oral fat tolerance test (OFTT).
LGI: low glycemic index diet trial. HGI: high glycemic index diet trial. LGI+EX: low glycemic index diet + exercise trial. HGI+EX: high glycemic index diet + exercise trial.
a: Significantly different from LGI+EX b: Significantly different from HGI+EX
a, b a, b
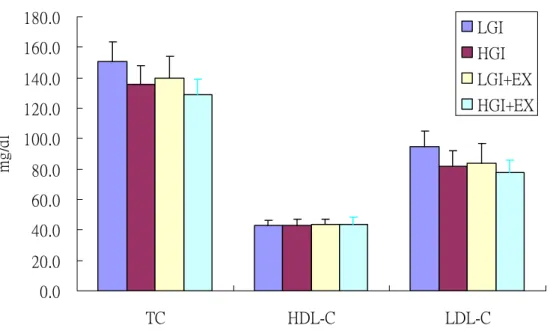
Plasma cholesterol (TC), high density lipoprotein cholesterol (HDL-C) and low density lipoprotein cholesterol (LDL-C)
Plasma TC, HDL-C and LDL-C concentrations were showed in Fig 7. There were no significant differences between trials.
0.0 20.0 40.0 60.0 80.0 100.0 120.0 140.0 160.0 180.0 TC HDL-C LDL-C mg /d l LGI HGI LGI+EX HGI+EX
Fig 7. Plasma total cholesterol (TC), high density lipoprotein cholesterol (HDL-C) and low density lipoprotein cholesterol (LDL-C) concentrations at fasting state.
LGI: low glycemic index diet trial. HGI: high glycemic index diet trial. LGI+EX: low glycemic index diet + exercise trial. HGI+EX: high glycemic index diet + exercise trial.
Conclusion
The current data suggested that consecutive 1 hour exercise for 3 days was significantly attenuated postprandial lipemia. The short term low glycemic index diets showed no influence on the postprandial lipid profile. Nevertheless, the low GI diet plus exercise might improve insulin sensitivity.
References:
Barter, P.J., Rye, K.A.. (1996) High density lipoproteins and coronary heart disease. Atherosclerosis 121,1–12.
Brand-Miller, J.C., Holt, S.H., Pawlak, D.B. and McMillan, J. (2002) Glycemic index and obesity. Am J Clin Nutr 76, 281S-5S.
Brand-Miller, J.C. (2003) Glycemic load and chronic disease. Nutr Rev 61, S49-55. Durstine, J.L., Haskell, W.L.. (1994) Effects of exercise training on plasma lipids and lipoproteins. Exerc Sports Sci Rev 22, 477–521.
FAO/WHO Expert consultation (1998) Carbohydrate in human nutrition. Geneva: Food and Agriculture Organization, World Health Organization. FAO Food and Nutrition 66.
Febbraio, M.A., Keenan, J., Angus, D.J., Campbell, S.E. and Garnham, A.P. (2000)
Preexercise carbohydrate ingestion, glucose kinetics, and muscle glycogen use: effect of the glycemic index. J Appl Physiol 89, 1845-51.
Frost, G., Brynes, A. and Leeds, A. (1999) Effect of large bowel fermentation on insulin, glucose, free fatty acids, and glucagon-like peptide 1 (7-36) amide in patients with coronary heart disease.Nutrition 15, 183-8.
Gill, J.M.R., Murphy, M.H., Hardman, A.E.. (1998) Postprandial lipemia: effects of intermittent versus continuous exercise. Med Sci Sports Exerc 30,1515–20.
Gill, J.M.R., Hardman A.E.. (2000) Postprandial lipemia: effects of exercise and energy intake restriction compared. Am J Clin Nutr 71,465–71.
Gill, J.M.R., Mees, G.P., Frayn, K.N., Hardman, A.E. (2001) Moderate exercise, postprandial lipaemia and triacylglycerol clearance. Eur J Clin Invest 31, 201–7.
glycaemic, insulin and cholecystokinin responses. Appetite 18, 129-41.
Holt, S.H., Brand Miller, J.C. and Petocz, P. (1996) Interrelationships among postprandial satiety, glucose and insulin responses and changes in subsequent food intake. Eur J Clin Nutr
50,788-97.
Jarvi, A.E., Karlstrom, B.E., Granfeldt, Y.E., Bjorck, I.E., Asp, N.G. and Vessby, B.O. (1999) Improved glycemic control and lipid profile and normalized fibrinolytic activity on a
low-glycemic index diet in type 2 diabetic patients. Diabetes Care 22, 10-8.
Jenkins, D.J., Wolever, T.M., Taylor, R.H., Barker, H., Fielden, H., Baldwin, J.M., Bowling, A.C.,Newman, H.C., Jenkins, A.L. and Goff, D.V. (1981) Glycemic index of foods: a
physiological basis for carbohydrate exchange. Am J Clin Nutr 34, 362-6.
Jenkins, D.J., Kendall, C.W., Augustin, L.S., Franceschi, S., Hamidi, M., Marchie, A.,
Jenkins, A.L. and Axelsen, M. (2002) Glycemic index: overview of implications in health and disease. Am J Clin Nutr 76, 266S-73S.
Jenkins, D.J., Wolever, T.M., Kalmusky, J., Guidici, S., Giordano, C., Patten, R., Wong, G.S., Bird, J.N., Hall, M., Buckley, G. and et, a.l. (1987) Low-glycemic index diet in
hyperlipidemia: use of traditional starchy foods. Am J Clin Nutr 46, 66-71.
Kabir, M., Rizkalla, S.W., Champ, M., Luo, J., Boillot, J., Bruzzo, F. and Slama, G. (1998) Dietary amylose-amylopectin starch content affects glucose and lipid metabolism in
adipocytes of normal and diabetic rats. J Nutr 128 , 35-43.
Kirwan, J.P., O'Gorman, D. and Evans, W.J. (1998) A moderate glycemic meal before endurance exercise can enhance performance. J Appl Physiol 84, 53-9.
Kirwan, J.P., O'Gorman, D.J., Cyr-Campbell, D., Campbell, W.W., Yarasheski, K.E. and Evans, W.J (2001) Effects of a moderate glycemic meal on exercise duration and substrate utilization. Med Sci Sports Exerc 33, 1517-23.
lipaemia attributable to a low-fat high-carbohydratediet. Br J Nutr 86, 197–205.
Koutsari, C., Karpe, F., Humphreys, S.M., Frayn, K.N., Hardman, A.E.. (2001) Exercise prevents the accumulation of triglyceride-rich lipoproteins and their remnants seen when changing to a high-carbohydrate diet. Arterioscler Thromb Vasc Biol 21,1520–5.
Leeds, A.R. (2002) Glycemic index and heart disease. Am J Clin Nutr 76, 286S-9S.
Leon AS, Sanchez OA. (2001) Response of blood lipids to exercise training alone or combined with dietary intervention. Med Sci Sports Exerc 33, S502–15.
Liu, S. and Willett, W.C. (2002) Dietary glycemic load and atherothrombotic risk. Curr
Atheroscler Rep 4, 454-61.
Ludwig, D.S. (2000) Dietary glycemic index and obesity. J Nutr 130, 280S-283S.
Ludwig, D.S., Majzoub, J.A., Al-Zahrani, A., Dallal, G.E., Blanco, I. and Roberts, S.B. (1999) High glycemic index foods, overeating, and obesity. Pediatrics 103, E26
Pawlak, D.B., Bryson, J.M., Denyer, G.S. and Brand-Miller, J.C. (2001) High glycemic index starch promotes hypersecretion of insulin and higher body fat in rats without affecting insulin sensitivity. J Nutr 131, 99-104.
Pi-Sunyer, F.X. (2002) Glycemic index and disease. Am J Clin Nutr 76, 290S-8S.
Sparks, M.J., Selig, S.S. and Febbraio, M.A. (1998) Pre-exercise carbohydrate ingestion: effect of the glycemic index on endurance exercise performance. Med Sci Sports Exerc 30, 844-9.
Slabber, M., Barnard, H.C., Kuyl, J.M., Dannhauser, A. and Schall, R. (1994) Effects of a low-insulin-response, energy-restricted diet on weight loss and plasma insulin concentrations in hyperinsulinemic obese females. Am J Clin Nutr 60, 48-53.
Spieth, L.E., Harnish, J.D., Lenders, C.M., Raezer, L.B., Pereira, M.A., Hangen, S.J. and Ludwig, D.S. (2000) A low-glycemic index diet in the treatment of pediatric obesity. Arch
Pediatr Adolesc Med 154, 947-51.
Wee, S.L., Williams, C., Gray, S. and Horabin, J. (1999) Influence of high and low glycemic index meals on endurance running capacity. Med Sci Sports Exerc 31, 393-9.
Willett, W., Manson, J. and Liu, S. (2002) Glycemic index, glycemic load, and risk of type 2 diabetes. Am J Clin Nutr 76, 274S-80S.
Wolever, T.M. and Jenkins, D.J. (1986) The use of the glycemic index in predicting the blood glucose response to mixed meals. Am J Clin Nutr 43, 167-72.
Wolever, T.M., Jenkins, D.J., Vuksan, V., Jenkins, A.L., Buckley, G.C., Wong, G.S. and Josse, R.G. (1992a) Beneficial effect of a low glycaemic index diet in type 2 diabetes. Diabet
Med 9, 451-8.
Wolever, T.M., Jenkins, D.J., Vuksan, V., Jenkins, A.L., Wong, G.S. and Josse, R.G. (1992b) Beneficial effect of low-glycemic index diet in overweight NIDDM subjects. Diabetes Care
15, 562-4.
Wu, C., Nicholas, C., Williams, C., Took, A. and Hardy, L. (2003) The influence of high-carbohydrate meals with different glycaemic indices on substrate utilisation during subsequent exercise. Brit J Nutr 90: 1049-1056.
計畫成果自評
Although we experienced the difficulty of subject recruitment and shortage of fund on some hormone assays, the project was successfully complete. We have already published part of the data in the 32th Taiwan Nutrition Society Annual meeting at Hungkuang University in
Taichung.(不同升糖指數的飲食與運動對於餐後血脂肪濃度之影響,中華民國營養學會第 三十二屆年會暨學術研討會,PD-1, pp 161)
The current obtained data is preparing a manuscript to submit to American Journal Clinical
附錄一
出國報告書
參加 2006 年第十一屆歐洲大學運動科學年會(The 11
thAnnual Congress of
European College of Sport Science)出國報告書
服務機關:國立台灣體育學院運動健康科學學系
出 國 人
職 稱:副教授
姓 名:巫錦霖
出國地區:Lausanne, Switzerland
出國期間:7/5-7/8, 2005
目 錄
一、前言: 會議解說與參加目的……… 2
二、舉辦城市與地點簡介……… 5
三. 會議特色……… 7
四、學習的成果: 重點發展領域……… 9
五、結語……… 10
附錄一:
發表論文海報………
11
一、前言: 會議解說與參加目的
每年一度的運動科學界的盛事—歐洲大學運動科學學會(ECSS)第十一屆年會 (The 11th Annual Congress of European College of Sport Science) —今年假有奧運首都的瑞士洛 桑(Lausanne)舉行。 按照傳統慣例,此次會議共計四天, 於 7 月 5 日展開序幕而於 7 月 8 日結束。此次會議 規模龐大,共計超過 2000 名來自世界各地學者與會,超過一千篇運動科學相關論著與 研究論文被發表,而參與的人員來自全球的 66 個國家,堪稱國際上運動科學的盛會。 本人有幸代表國立台灣體育學院參與此一學術盛會,以下就本人於此研討會之參與過程, 會議內容, 課程, 與參訪活動做一摘要報告。 圖:大會會場
圖:報到處 (Registration desk)
由於參加的人數眾多,報到處的規模也相當大,是根據姓氏的英文字母來排列,雖然報 名參與的人數非常多,但是主辦單位仍然能夠有條不紊的讓與會者迅速,而且順利的完 成報到手續。
圖:與 Professor Michael Glesson 及英國學者於會場合照
二、舉辦城市與地點簡介
第十一屆歐洲大學運動科學學會(ECSS)年會,今年假夙有奧運之首都-洛桑 (Lausanne) 的舉行。洛桑的位置正於歐洲的心臟,距離日內瓦僅 40 英里,位於日內瓦湖畔,是一 個依山傍水的美麗城市,不僅如此,洛桑更是許多運動項目的總會設立的地點,而且 IOC 的博物館正設置在洛桑。 圖:日內瓦湖畔 圖:鳥瞰洛桑圖:開幕典禮
三. 會議特色
此次研討會極具規模,整個會議共持續四天,在議程方面,每天都根據不同的專題進行 口頭發表(oral presentation),海報發表(posters),各領域的主要專題報告(Keynote speakers in different symposia),以及 workshops 等特別演講。 由於發表的論文數量非常多,於同 一時間,同時有 4-6 個演講廳同時舉行 Oral Presentation 或者專題演講,並且在海報發 表方面,分為四天的發表,發表論文數量超過 1200 篇,因此參加者必須準備充分,並 依大會手冊及論文摘要,只能選擇去參加某一個特定的講演,或者觀看海報的發表。 此外大會為了讓更多的年輕的運動科學研究者參與,特別安排了設有青年研究論文獎, 由主辦單位挑出本次大會中,優秀的論文,發給優秀論文以及研究獎金獎勵 。 圖:會場外觀
圖:會場外一隅 此外大會並且安排了有廠商的展覽,參加展覽的廠商,運動相關產業,運動科學儀器, 運動傷害治療,運動營養補充劑,運動相關書籍書商等等,總共有超過 100 個參展廠商, 規模之相當龐大。 在純學術活動之餘, 大會也舉辦許多活動, 例如開幕當晚的歡迎酒會,表演之夜,以及 划船活動等等。
圖:晚宴之夜
四、學習的成果: 重點發展領域
經過這幾天密集的聽講還有與其他國家學者的共同討論,發現真是受益良多,很難得有 機會參與這麼國際性的會議,與這麼多從事運動科學研究的人才共聚一堂, 從這些天 的學習與腦力激盪所得的經驗之下,對於運動科學的趨勢發展,有下列幾點發現與感想: 1. 運動科學都不能僅從單一面向來討論, 因為不管是運動生理、運動心理、運動生化、 或者運動營養等等,每一個環節都需要詳加研究,而每一個研究者,都能夠在所興 趣的領域上鑽研,並且藉由此種國際性的會議,來對談與交流,使每個研究者永遠 走在尖端上。 2. 從整個會議上,仍不難看出目前仍然重視競技運動,即運動員的表現,因為其所呈 現的研究結果能夠對運動員的表現產生直接的貢獻,另外一部分為健康管理,這包 運動保健,運動傷害防護與治療,因此基本科目如運動生理學與運動力學都是此次 會議發表的大宗。 3. 在運動科學的領域上,已經由巨觀的角度,往微觀方向移動,本次的研討會中已經 有一部分的論文探討基因的部分,很多過去無法解答的問題,可能在藉由分子生物的方法,而有所突破。
圖:本人海報發表
五、結語
此次會議規模龐大,會議本身提供了一個很好的學習,拓展視野與文化交流的機會,學 者彼此之間的互動也非常的可貴, 我這次參與不但遇到很多台灣過去的老師們,也有 幸有機會與在英國的 Professor Michael Gleeson 再次對談,並且與過去在認識的國外學 者再次聚首,透過彼此的在學術上交流與研究心得上的交換,獲得了很多寶貴的建議。