Short Paper
Abundance index for longline fishery targeting
spawning Pacific bluefin tuna Thunnus orientalis in
south-western North Pacific Ocean
Hui Hua LEE* AND Chien Chung HSU
Institute of Oceanography, National Taiwan University, Taipei, Taiwan
KEY WORDS: abundance index, catch per unit effort, generalized linear model, Pacific bluefin tuna.
Pacific bluefin tuna Thunnus orientalis is a highly migratory species, distributing throughout the
Pacific Ocean.1This species is among the quality
tunas of high economic value and has been histori-cally exploited mainly by Japanese, US, Mexican and Taiwanese fleets. Approximately 10% of catches were made by the Taiwanese fleet after
1999;2particularly, the individuals caught were all
giant spawners.3,4Taiwanese small-scale longliners
(vessels < 100 t) target the stock in the
south-western North Pacific from late April through June. Because of the significant catch of spawners, any assessment of this stock should include data from the Taiwanese fleet.
Many reports have been issued to describe the stock status of the Pacific bluefin tuna during the past two decades; however, other than biological studies, there have been few stock assessments with the abundance index derived from Japanese fleets
and purse seiners in the eastern Pacific Ocean.2
Because this species is exposed to multiple fisheries over most fishing grounds, historical statistics from different fishing parties is essential. To assess and propose management measures for the Pacific bluefin tuna, collection of catch and effort data as well as development of a reliable abundance index to represent the spawning stock are urged for the Taiwanese fishery. Therefore, the objective of this study was to model a time-series catch per unit effort (CPUE) that can be used as an index of abun-dance for the Taiwanese fishery from 1999 to 2004.
Daily catch data from auction records and time records of vessels in and out, which can trace the fishing effort of each vessel, were collected and compiled at Tungkang port, where most bluefin tuna are landed. Two criteria were used in screen-ing the daily record. First, catch with matchscreen-ing effort information for a vessel was screened. Second, the time difference between date of auction and date of disembarking from port was no more than three days to obtain quality fish meat for vessels without freezers. According to interviews with captains of small-scale longline vessels, approximately 1200–1600 hooks per day can be deployed regardless of vessel size. Large vessels can store more fish than small vessels and may stay at sea longer. Fishing effort was then converted from fishing days to number of hooks operated with an assumed average of 1400 hooks lifted daily. The estimated fishing days were decreased by two days because the vessel took approximately one day to travel from Tungkang port to the fishing ground and vice versa.
Catch and effort information were summarized as CPUE. Based on the assumption that catch is proportional to the product of fishing effort and density, the ability to use CPUE as an index of abundance depends on being able to remove the influences of factors that change fishing efficiency among vessels and cause differences between trips
for the same vessel other than abundance.5 A
generalized linear model (GLM)6 was applied to
remove the influential factors and, in the present analysis, the available factors for each vessel trip compiled in the catch and effort data include year (1999–2004), month (May and June) and size of
*Corresponding author: Tel: 886-2-2362-2987. Fax: 886-2-2366-1198. Email: [email protected]
Received 27 December 2006. Accepted 16 October 2007. FISHERIES SCIENCE2008; 74: 1336–1338
vessel (grouped as 10–19, 20–49 and 50–100 t). Considering all bluefin fisheries from the western North Pacific, the Taiwanese fishery appears to be a local fishery with a marked fishing season even though the detailed fishing positions are not avail-able; therefore, spawning bluefin density was assumed to be spatially homogeneous.
Independent variables considered for the GLM are fishing year, month, size of vessel and two-way interaction between month and size of vessel. The dependent variable is the logarithm of CPUE assuming a Gaussian error distribution. To avoid zero CPUE when taking the natural logarithmic transformation, a positive constant was added to all CPUEs, while maintaining or achieving
normal-ity of the transformed data.7Test runs with
differ-ent values of the constant were carried out to see which yielded results that are close to the normally distributed residuals. The assumption of a GLM is that the relationship between the expected ln(CPUE) and the independent variables is linear. The full model is given by equation 1:
ln
(
CPUEijk+c)
= + +m Yi Mj+ +Sk Mj× +Sk eijk, (1)where m is overall mean, c is a constant that is
decided in test runs, Yiis the effect of year i, Mjis
the effect of month j, Skis the effect of size of vessel
k, Mj¥ Skis the two-way interaction term between
month j and size of vessel k, andeijkis an error term
with N(0, s2). Due to the difficulty of explaining
interaction between year factor and other factors, only the interaction between month and size of vessel was considered.
A stepwise analysis of deviance was performed to determine the set of systematic factors and interactions that significantly explained most of
the observed CPUE variability. Thec2statistic was
used to test the significance of an additional factor
in the model.8 Final selection of explanatory
factors was conditional on significance of the c2
test and per cent change in deviance as each factor
is added to the model. The ln(CPUE+ c) was
esti-mated as the least-squares mean of the factors selected and then back-transformed to derive the standardized CPUE. The analyses were run with GENMOD and GLM procedures (SAS Institute, Cary, NC, USA).
The normality of residuals from the transformed data by adding different constants was visually diagnosed by comparing quantile of residuals with the 45° reference line on the Q–Q plot (data not shown), indicating that the plot derived by adding either 1 or 0.01 as a constant departed from the line more than that by adding 0.1 or 10% of overall mean. These data suggest that both 0.1 and 10% of overall mean as a constant capture the normality of residuals, but the value of 0.1 shows better fit of data than 10% of overall mean.
Results of deviance estimated from stepwise regression are presented in Table 1 indicating that factors of year, month and the size of the vessel
were significant for thec2test (P< 0.0001). Among
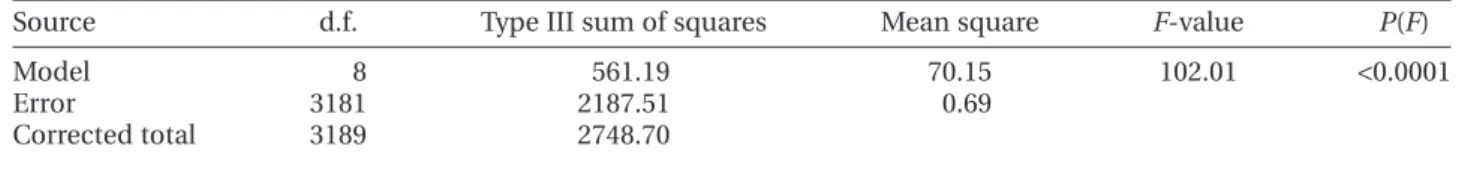
these factors, year, month or size of vessel explained more than 1% of deviance. Therefore, factors of year, month and size of vessel were selected into the GLM. The analysis of variance (anova) results are shown in Table 2.
CPUE estimated by the GLM is shown in Figure 1. The annual abundance index sharply declined from 0.46 fish per 1000 hooks in 1999 to 0.14 fish per 1000 hooks in 2002, and remained constant at 0.2 fish per 1000 hooks in 2003 and 2004.
The process attempts to remove most of the annual variations in the data that are not attributed to changes in abundance and the annual index reflects population abundance. In this study, the selected factors explained approximately 20% of variance of the data (Table 1) and the explanatory
power of the model (r2) was 0.2 (Table 2). Maunder
and Punt9indicated that the explanatory power is
not always satisfactory and it can be increased by involving more explanatory variables. Accordingly, the explained variation is not the absolute quantity to judge the reliability of the index of abundance. Instead, it is more important to consider whether Table 1 Analysis of deviance of explanatory variables in generalized linear model
Model d.f. Deviance Change deviance % of deviance P(c2)
Intercept 3189 2748.70 <0.0001
Y 3184 2508.26 240.44 8.75 <0.0001
Y+ M 3183 2210.19 298.07 11.88 <0.0001
Y+ M + S 3181 2187.51 22.68 1.03 <0.0001
Y+ M + S + M ¥ S 3179 2187.27 0.24 0.01 0.8412
Per cent deviance refers to the percentages of change in deviance divided by deviance in previous model, and P(c2) values indicate the 5%c2probability between consecutive models.
d.f., degrees of freedom;M, month effect; M¥ S is the two-way interaction term between month and size of vessel; S, effect of size of vessel; Y, year effect.
Abundance index of spawning bluefin tuna
FISHERIES SCIENCE
1337the time series of abundance index accurately reflects changes in catchability and fisheries. First,
decreases in catches from the longline fisheries2
are consistent with our result shown in Figure 1, which is low abundance of bluefin tuna in 2002. Second, abundance indices of spawning fish
caught by Japanese costal longliners also
decreased from 1999 to 2002.2 Third, decreased
abundance is consistent with falling spawning
stock biomass after the mid-1990s.2 Therefore, it
was concluded that the standardized CPUE in this study is a useful abundance index for spawning bluefin tuna targeted by the Taiwanese small-scale longline fishery.
The rapid development of the Taiwanese small-scale longline fishery targeting spawning stock brought about high fishing pressure on the bluefin in recent 10 years. Taking into account the size-specific seasonality of the fishery, the index of
abundance estimated in the present study could provide important information to advance future stock assessment.
ACKNOWLEDGMENT
This study is a result of work sponsored by the National Science Council under grant NSC93-2313-B-002-055 to CC Hsu.
REFERENCES
1. Bayliff WH. A review of the biology and fisheries for north-ern bluefin tuna, Thunnus thynnus, in the Pacific Ocean.
FAO Fish. Tech. Pap. 1994; 336: 244–295.
2. Anonymous. Report of the Fourth ISC Meeting of the Pacific
Bluefin Tuna Working Group. Interim Scientific Committee for Tuna and Tuna-Like Species in the North Pacific Ocean.
ISC/06/Plenary/7, ISC, Shizuoka. 2006.
3. Hsu CC, Liu HC, Wu CL, Huang ST, Liao HK. New informa-tion on age composiinforma-tion and length-weight relainforma-tionship of bluefin tuna, Thunnus thynnus, in the southwestern North Pacific. Fish. Sci. 2000; 66: 485–493.
4. Chen KS, Crone P, Hsu CC. Reproductive biology of female Pacific bluefin tuna Thunnus orientalis from south-western North Pacific Ocean. Fish. Sci. 2006; 72: 985–994.
5. Gulland JA. Fish Stock Assessment: A Manual of Basic
Methods. Wiley, New York. 1983.
6. Nelder JA, Wedderburn RWM. Generalized linear models.
J. R. Stat. Soc. Se. A 1972; 137: 370–384.
7. Berry DA. Logarithmic transformations in anova.
Biomet-rics 1987; 43: 439–456.
8. McCullagh P, Nelder JA. Generalized Linear Models, 2nd edn. Chapman & Hall, London. 1989.
9. Maunder MN, Punt AE. Standardizing catch and effort data: a review of recent approaches. Fish. Res. 2004; 70: 141–159.
Table 2 Analysis of variance (anova) table for selection model in generalized linear model
Source d.f. Type III sum of squares Mean square F-value P(F)
Model 8 561.19 70.15 102.01 <0.0001 Error 3181 2187.51 0.69 Corrected total 3189 2748.70 r2, explanatory power= 0.2042. d.f., degrees of freedom. CPUE (number of fi sh / 1,000 hooks) 0.0 0.1 0.2 0.3 0.4 0.5 0.6 0.7 0.8 0.9 1.0 1999 2000 2001 2002 2003 2004 CPUE (number of fi sh / 1,000 hooks) 0.0 0.1 0.2 0.3 0.4 0.5 0.6 0.7 0.8 0.9 1.0 1999 2000 2001 2002 2003 2004 CPUE (number of fi sh / 1,000 hooks) 0.0 0.1 0.2 0.3 0.4 0.5 0.6 0.7 0.8 0.9 1.0 1999 2000 2001 2002 2003 2004
Fig. 1 Estimated (bars) and observed (䊉) catch per unit effort (CPUE) of Pacific bluefin tuna targeted by Taiwan-ese longline fishery. Bars, standard error.
1338