Lower operation voltage in dual-frequency
cholesteric liquid crystals based on the
thermodielectric effect
Yu-Cheng Hsiao1 and Wei Lee2,*
1Department of Physics, National Taiwan University, Taipei 10617, Taiwan,
2Institute of Imaging and Biomedical Photonics, College of Photonics, National Chiao Tung University, Guiren Dist., Tainan 71150, Taiwan
Abstract: Dual-frequency cholesteric liquid crystal (DFCLC) devices
characteristically require high operation voltage, which hinders their further development in thin-film-transistor driving. Here we report on a lower-voltage switching method based on the thermodielectric effect. This technique entails applying a high-frequency voltage to occasion dielectric oscillation heating so to induce the increase in crossover frequency. The subsequent change in dielectric anisotropy of the DFCLC allows the switching, with a lower operation voltage, from the planar state to the focal conic or homeotropic state. The temperature rise incurred by the dielectric heating is described.
©2013 Optical Society of America
OCIS codes: (230.2090) Electro-optical devices; (230.3720) Liquid-crystal devices.
References and links
1. A. B. Golovin, S. V. Shiyanovskii, and O. D. Lavrentovich, “Fast switching dual-frequency liquid crystal optical retarder, driven by an amplitude and frequency modulated voltage,” Appl. Phys. Lett. 83(19), 3864–3866 (2003). 2. P.-T. Lin, X. Liang, H. Ren, and S.-T. Wu, “Tunable diffraction grating using ultraviolet-light-induced spatial
phase modulation in dual-frequency liquid crystal,” Appl. Phys. Lett. 85(7), 1131–1133 (2004).
3. Y.-C. Hsiao, C.-Y. Wu, C.-H. Chen, V. Ya. Zyryanov, and W. Lee, “Electro-optical device based on photonic structure with a dual-frequency cholesteric liquid crystal,” Opt. Lett. 36(14), 2632–2634 (2011).
4. Y.-C. Hsiao, C.-T. Hou, V. Ya. Zyryanov, and W. Lee, “Multichannel photonic devices based on tristable polymer-stabilized cholesteric textures,” Opt. Express 19(24), 23952–23957 (2011).
5. Y.-C. Hsiao, Y.-H. Zou, I. V. Timofeev, V. Ya. Zyryanov, and W. Lee, “Spectral modulation of a bistable liquid-crystal photonic structure by the polarization effect,” Opt. Mater. Express 3(6), 821–828 (2013).
6. M. Xu and D.-K. Yang, “Dual frequency cholesteric light shutters,” Appl. Phys. Lett. 70(6), 720–722 (1997). 7. C.-Y. Huang, K.-Y. Fu, K.-Y. Lo, and M.-S. Tsai, “Bistable transflective cholesteric light shutters,” Opt. Express
11(6), 560–565 (2003).
8. J. Ma, L. Shi, and D.-K. Yang, “Bistable polymer stabilized cholesteric texture light shutter,” Appl. Phys. Express 3(2), 021702 (2010).
9. M. Xu and D.-K. Yang, “Electrooptical properties of dual-frequency cholesteric liquid crystal reflective display and drive scheme,” Jpn. J. Appl. Phys. 38(3), 6827–6830 (1999).
10. F.-C. Lin and W. Lee, “Color-reflective dual-frequency cholesteric liquid crystal displays and their drive schemes,” Appl. Phys. Express 4(11), 112201 (2011).
11. Y.-C. Hsiao, C.-Y. Tang, and W. Lee, “Fast-switching bistable cholesteric intensity modulator,” Opt. Express 19(10), 9744–9749 (2011).
12. C.-H. Wen and S.-T. Wu, “Dielectric heating effects of dual-frequency liquid crystals,” Appl. Phys. Lett. 86(23), 231104 (2005).
13. Y. Yin, S. V. Shiyanovskii, A. B. Golovin, and O. D. Lavrentovich, “Dielectric torque and orientation dynamics of liquid crystals with dielectric dispersion,” Phys. Rev. Lett. 95(8), 087801 (2005).
14. Y. Yin, S. V. Shiyanovskii, and O. D. Lavrentovich, “Electric heating effects in nematic liquid crystals,” J. Appl. Phys. 100(2), 024906 (2006).
15. Y. Yin, S. V. Shiyanovskii, and O. D. Lavrentovich, “Thermodielectric bistability in dual frequency nematic liquid crystal,” Phys. Rev. Lett. 98(9), 097801 (2007).
16. M. Schadt, “Dielectric heating and relaxations in nematic liquid crystals,” Mol. Cryst. Liq. Cryst. (Phila. Pa.) 66(1), 319–336 (1981).
17. H. K. Bücher, R. T. Klingbiel, and J. P. VanMeter, “Frequency‐addressed liquid crystal field effect,” Appl. Phys. Lett. 25(4), 186–188 (1974).
18. H. Xianyu, S.-T. Wu, and C.-L. Lin, “Dual frequency liquid crystals: a review,” Liq. Cryst. 36(6–7), 717–726 (2009).
19. C.-Y. Tang, S.-M. Huang, and W. Lee, “Dielectric relaxation dynamics in a dual-frequency nematic liquid crystal doped with C.I. Acid Red 2,” Dyes Pig. 88(1), 1–6 (2011).
20. H.-H. Liu and W. Lee, “Time-varying ionic properties of a liquid-crystal cell,” Appl. Phys. Lett. 97(2), 023510 (2010).
21. Y. A. Cengel, J. M. Cimbala, and R. H. Turner, Fundamentals of Thermal-Fluid Sciences, 4th ed. (McGraw-Hill, 2011).
22. T. L. Bergman, A. S. Lavine, F. P. Incropera, and D. P. DeWitt, Fundamentals of Heat and Mass Transfer, 7th ed. (Wiley, New York, 2011).
23. A. C. Metaxas, Foundations of Electroheat: A Unified Approach (Wiley, 1996).
24. G. Solladié and R. G. Zimmermann, “Liquid crystals: A tool for studies on chirality,” Angew. Chem. Int. Ed. Engl. 23(5), 348–362 (1984).
1. Introduction
Dual-frequency nematic liquid crystals (DFNLCs) exhibit an attractive property that their frequency-revertible dielectric anisotropy Δε changes from positive to negative with rising frequency beyond the crossover frequency fc. Based on this feature, DFNLCs have been
suggested for uses in fast-switching optical devices [1] and diffraction gratings [2]. Additionally, dual-frequency cholesteric liquid crystals (DFCLCs), often made of mixtures of DFNLCs and chiral dopants (CDs), are characterized by their optical bistability and hold great promise for photonic applications [3–5] including light shutters [6, 7] and displays [8– 10]. Conventionally, the switching from the optically stable, transparent planar (P) state to the optically stable, light-scattering focal conic (FC) state in a cholesteric liquid crystal is achieved by applying an AC voltage pulse. Unfortunately, the transition from the FC to P state is not accomplishable as a direct switch but requires an intermediate state; i.e., through the homeotropic (H) or transient P state. Recently, we have demonstrated the direct two-way switching between the P and FC states in DFCLCs, permitting a much shorter response time for potential applications as light shutters [11] and video-rate color reflective displays [10]. It is a pity that all DFCLC devices suffer from one common problem—the need of high operation voltage. In this work, we explore the thermodielectric physics behind a DFCLC system and employ this dielectric heating effect to switch the cell from the P to the FC or H state by a lower voltage.
Often regarded as a nuisance and a big concern for dual-frequency liquid crystal (DFLC) devices, the thermodielectric effect; namely, the dielectric heating phenomenon, has been studied in the past [12–18]. When an electric field E is applied across a liquid crystal (LC) cell, it exerts a torque on the LC director ˆn that depends on dielectric anisotropy Δε = ε∥ – ε⊥,
where the dimensionless “constants” ε∥ and ε⊥ are the relative permittivity components
corresponding to the cases of ˆn || E and ˆn ⊥ E, respectively. For a DFLC, Δε is an explicit function of frequency f. When a low-frequency (f < fc) electric field is applied, Δε is positive
and the director tends to be parallel to the field direction. On the contrary, Δε becomes negative and the director tends to be perpendicular to the field as the DFLC is subject to a high-frequency (f > fc) driving signal. Here fc, the most important parameter, increases
sensitively with elevating temperature. The thermodielectric effect is determined by the efficiency of absorption of electromagnetic energy by the dielectric bulk through reorientation of the LC molecular dipoles, which is particularly pronounced at high frequencies (f > fc). The
imaginary part of the dielectric function manifests the extent of the electromagnetic absorption
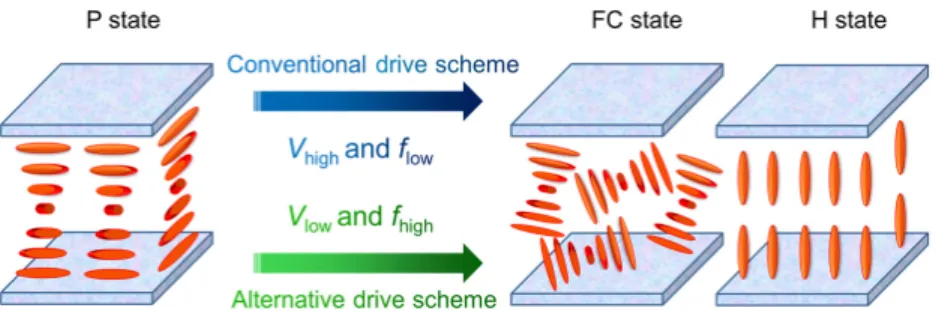
Fig. 1. Schematic of three CLC configurations and comparative drive methods to switch the DFCLC to the optically stable FC or voltage-sustained H state from the optically stable P state.
and of the resulting generation of heat leading to the increase in fc. The
thermodielectro-induced change in Δε subsequently reverses the sign at the high frequency (f < fc). This
thermo-prompted molecular standing force can switch the P state to the FC or H state in a DFCLC at a lower high-frequency voltage compared with the high low-frequency operation voltage in the conventional drive scheme [6] as schematically shown in Fig. 1.
2. Experimental
The DFNLC material adopted in this study was MLC-2048 (Merck) with the clearing point 110 °C and Δε = 2.8 at 1 kHz and 25 °C. The CD used was S-811 (Merck), which was dispersed in the LC host at concentrations of 0–15 wt%. The DFCLCs were introduced in empty planar-alignment cells by the capillary action in isotropic phase. Each cell was composed of two 1.1-mm-thick indium–tin-oxide glass substrates coated with alignment layers, yielding a cell gap d of 11.6 ± 0.5 μm. Knowing that square waves contain higher-order Fourier frequency components, we elected to apply square-wave voltage for direct sense of the amplitude. The rubbed planar alignment layers allowed unambiguous identification of the initial P state. The ambient temperature T0 was fixed at 27 °C by a
temperature controller. In order to avoid the temperature gradient in the cell, we inserted a pair of ~1-mm-thick plastic strips between the cell and the hot plate to stabilize the surrounding air at 27 °C. The temperature of the cell surface, Ts, was measured with a digital
thermometer whose thermocouple was attached to the outer surface of the cell. The frequency-dependent complex dielectric function ε′ – iε″ was acquired with a computer-controlled precision LCR meter (Agilent E4980A) [19], using a 0.5 Vrms sinusoidal probe
voltage, which was lower than the Fréedericksz threshold voltage [20].
3. Results and discussion
Figure 2 shows the measured real (ε′) and imaginary (ε″) parts of the dielectric function of a DFCLC cell in the frequency range from 1 kHz to 1 MHz. Note that the bias voltages, 0 and 40 V, permitted the measurements of the vertical and parallel dielectric components, ε⊥ and
ε∥, respectively. One can observe that fc is ca. 20 kHz in the conditions of 5 wt% CD and 300
K. The spectra can be roughly divided into three main frequency ranges. Firstly, the low-frequency regime (f < 1 kHz) reveals the induced polarization due to space charge; here the ionic behavior is dictated by the electrode and interface polarizations [20]. Secondly, the frequency range between 1 and 100 kHz is associated with the dielectric orientation behavior of the LC molecules [13]. Finally, the dielectric spectra at frequencies around 1 MHz are dominated by the pseudo-relaxation originating from the cell composition and configuration [19]. For a given DFCLC (with a specific CD concentration), the temperature dependence of
Fig. 2. Dielectric dispersion of a DFCLC sample consisting of 5 wt% CD at 300 K. a c 0 B exp E , f A k T = − (1)
where A0 is a material constant, Ea represents the activation energy of the dielectric relaxation
related to the rotation along the short molecular axis, kB stands for the Boltzmann constant,
and T denotes the absolute temperature. The heat flow rate Qout at the glass–air interface
between the cell surface and the surrounding air follows the equation
out ( s 0),
Q =hA T −T (2)
where h is the heat transfer coefficient of ~20 Wm−2K−1 for the glass substrate [21] and A is
the heat-transfer surface area of 1 cm2 in this study. Let’s ignore the small temperature
gradient in the LC bulk, the average temperature T of the LC in thermal equilibrium can be written as [22]
(
)
0 1 B (i s 0),
T T− = + T −T (3)
where Bi is the dimensionless Biot number of the glass plate about 0.02, which is negligible to readily deduce T = Ts. Assume that the electric field is homogeneous in the cell for
simplicity. The dielectric heating power density P of the LC bulk is thus given by [23]
2 2 0 rms 0 2 2 ( ) ( ) f V , P E d π ε ε ω ω ε ε ω′′ ′′ = ⋅ ⋅ = (4)
where ω is the angular frequency and ε0 is the permittivity of free space. In this work, the
pretilt angle (< 2°) is small enough, so the imaginary part of the complex dielectric permittivity is practically equal to ε ε0 ⊥′′ in the P state. Figure 3 depicts ε⊥′′ as a linear function
of the CD concentration c at 100 kHz:
( )c c,
ε⊥′′ = +α β (5)
where α = 0.016 and β = 0.169 wt%−1 by least-squares fitting. In our experiment, ε
⊥″ did not
explicitly vary with T. Also note that c was lower than 16 wt%, beyond which the DFCLC cell became difficult to operate.
expressed as Qin = P d A / 2 = Qout [15]. Combination of Eqs. (2)–(5) permits the equilibrium
temperature of the LC to proceed to
(
) (
)
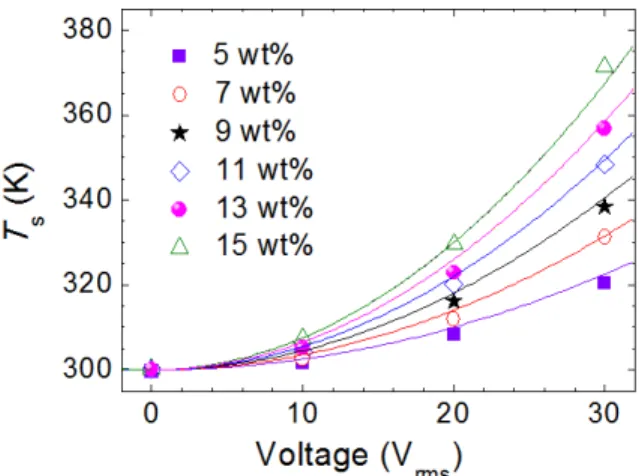
2 rms 2 0 0 rms 1 Bi , f A c V T T T f cV hd π + α β+ γ = + ≈ + (6)where both Bi and α, in comparison with 1 and β c, respectively, are ignored in the approximation. The relation 2
s 0 rms
T T T f cV
Δ = − ∝ is clearly confirmed by the experimental data as shown in Fig. 4. One can see that the dielectric heating effect is more drastic in the samples with higher CD concentrations as manifested by the higher temperatures measured. It is also clear from Fig. 4 that the experimental data are in good agreement with the simulated results predicted by Eq. (5).
Here one should be reminded that the helical pitch is more generic in comparison with the concentration of the CD S-811 in the DFCLC host MLC-2048. The cholesteric pitch p in μm can be written as [24]
Fig. 3. Imaginary-part dielectric constant at 100 kHz as a function of the CD concentration. The straight line is the best fit to the experimental data represented by the symbol.
Fig. 4. Voltage (100 kHz)-dependent dielectric heating in DFCLC with various CD concentrations. The symbols show the experimental results and the curves are derived theoretically from the approximation given by Eq. (5).
Fig. 5. Voltage-dependent transmittance at operation frequencies of (a) 1 kHz and (b) 100 kHz. Inset: the photograph of the DFCLC cell showing the transition process with various zones separately in the P state (yellow), FC state (gray) and H state (dark) under crossed polarizers.
1 , p c r β = ⋅ ⋅ (7)
where β stands for the helical twisting power of the dopant and r represents the enantiomeric excess. In the dilute-solution or low-CD-concentration condition, the above equation can be simplified, allowing c to be reasonably substituted by 0.086/p in this study (β = 11.6 μm−1).
Such conversion in rewriting Eqs. (5) and (6) and replotting Figs. 3 and 4 can lead to alternative presentations and would be more significant, providing physical insight in characterization of other cholesteric material systems.
Figure 5 illustrates the electro-optical properties of a DFCLC cell (with 9 wt% CD) between crossed polarizers at 1 kHz and 100 kHz. When the low-frequency (1 kHz) voltage is applied, the LC bulk shows positive Δε, and the cell is initially at the P state. Through a range of increasing voltages, the DFCLC exhibits three main optical intensity states. The brightest is the initial P state and the FC state appears subsequently at ~13–30 Vrms. Finally the texture
appears to be the H state when the voltage is over ~30 Vrms as presented in Fig. 5(a). In the
voltage ramp-down route, the texture changes from the H to FC state and the cell retained the bistable FC state. However, when the driving voltage operates at the high frequency (100 kHz), the LC exhibits negative Δε. Continuous supply of high-frequency voltage causes severe dielectric heating and, in turn, the increase in fc, eventually inducing the positive
dielectric torque. Consequently, the texture of the DFCLC transforms from the P state to FC or H state even when the voltage is as low as ~15 Vrms (Fig. 5(b)). Based on this effect, the
operation voltage required for switching the P state off is cut by half compared with that in the conventional drive scheme.
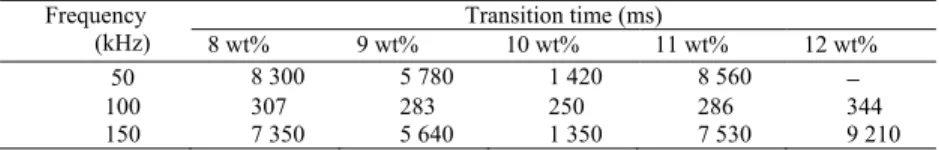
The thermoinduced dielectric shifting usually takes time and the optimized condition must be obtained. The transition times, defined as the time interval between 10% and 90% of the minimum-to-maximum transmittance difference, are displayed in Table 1. The transition time increases in general for a given lower frequency (say, 50 kHz) due to the weaker heating effect and a higher applied frequency (150 kHz) gives rise to the increased transition time, too, because of the long time to shift fc to significantly go beyond the higher frequency. The
whelming CD content (12 wt% in this study) produces the large viscous force to prolong the transition. Noticeably, the shortest switching time is obtained from the sample with 10 wt% CD driven by a voltage at 100 kHz.
Table 1. Transition Times from the Planar State to the Homeotropic State in DFCLCs with Various Chiral-Dopant Concentrations at 15 Vrms at Three Different Frequencies
Frequency (kHz) Transition time (ms) 8 wt% 9 wt% 10 wt% 11 wt% 12 wt% 50 8 300 5 780 1 420 8 560 − 100 307 283 250 286 344 150 7 350 5 640 1 350 7 530 9 210 4. Conclusions
To conclude, interesting properties of dielectric heating in DFCLCs have been investigated. In a high-frequency electric field, the dielectric heating leads to the increases in temperature as well as in crossover frequency, reversing the sign of dielectric anisotropy at the very frequency and subsequently changing the optical state. By using this technique, a DFCLC can be switched from the P state to FC or H state with a relatively low driving voltage at the expense of switching time. Such approach can be employed in applications of smart-window technologies where the operation time is not a big concern. With the lowness of voltage in desire, this study further reveals an alternative conception of realization of DFCLC displays.
Acknowledgments
This research is financially supported by the National Science Council of the Republic of China (Taiwan) under Grant No. NSC 101-2112-M-009-018-MY3.