Structural ordering transition and repulsion of the giant LO-TO splitting
in polycrystalline Ba
xSr
1ÀxTiO
3Shou-Yi Kuo, Wen-Yi Liao, and Wen-Feng Hsieh
Institute of Electro-Optical Engineering, National Chiao Tung University, 1001 Tahsueh Rd., Hsinchu 30050, Taiwan
共Received 5 November 2000; revised manuscript received 23 April 2001; published 20 November 2001兲 We report Raman and x-ray diffraction studies of polycrystalline BaxSr1⫺xTiO3 共BST兲 prepared by the sol-gel technique in the range of x⫽0 to 1.0. Other than a tetragonal to cubic phase transition at composition
x⬇0.75 of the BST powders detected by x-ray diffraction and Raman spectroscopy, a new structural ordering
transition around x⬇0.4⫺0.5 is observed due to the atomic arrangement. By taking the anharmonic coupling between the three A1(TO) modes into account, the observed repulsion of the giant LO-TO splitting is a result of decreasing cell dimension and strengthening the electron-phonon coupling. The results help us to explain the weakening of the ferroelectricity in the BST tetragonal phase as x decreases. The anomalous inconsistency in our experimental results and theoretical prediction are attributed to the lack of detailed information of dynami-cal effective charges in the BaxSr1⫺xTiO3compounds.
DOI: 10.1103/PhysRevB.64.224103 PACS number共s兲: 61.10.Nz
I. INTRODUCTION
Barium strontium titanate (BaxSr1⫺xTiO3, BST兲 is a
di-electric material with excellent didi-electric properties such as high dielectric constant, small dielectric loss, low leakage current, and large dielectric breakdown strength. BaTiO3 is a
ferroelectric perovskite1with Curie temperature Tcat 393 K, while SrTiO3 is a quantum paraelectric
2
whose dielectric constant continues to increase upon cooling down to about 4 K, below which it levels off due to zero-point quantum fluc-tuations. Thus, it is known that one can control the Tc of
BST by adjusting the ratio of Ba/共Ba⫹Sr兲 by the approxi-mate relation3 Tc(K)⫽360x⫹40, of which a structural
change from centrosymmetric cubic to noncentrosymmetric tetragonal phase at room temperature when x⬇0.75.
Single crystal BaTiO3 is known to undergo several phase
transitions at ambient pressure as a function of temperature using x-ray diffraction, Raman, and infrared spectroscopies.4 – 8The ferroelectric transition occurs as a re-sult of balance between long-range Coulomb interaction and short-range forces. Particularly, the Coulomb interaction can make the ferroelectric instability to details of domain struc-ture, defect and boundary conditions.9Another direct effect of such interaction is the splitting of longitudinal optical
共LO兲 and transverse optical 共TO兲 phonons. The calculation of
the Born dynamical effective charges, which reflect the local dipole moments developed as atoms being moved, has been performed in ABO3 cubic perovskite compounds by Zhong et al.9
Because of the close relationship between ferroelectricity and lattice dynamics, Raman spectroscopy provides a poten-tially valuable technique for the study of ferroelectric mate-rials. It is highly sensitive to local structure and local sym-metry. Compared with other techniques, Raman spectroscopy has two advantages. First, it is a nondestructive method which does not need any special treatment of samples, and second it provides a convenient way of in situ observation of changes in the structure with high spatial resolution as a function of temperature, polarization, pressure10and electric
field.11 Venkateswaran et al.10 have reported that there are two structural phase transformations through Raman spectra, one at 2 GPa corresponds to the tetragonal to cubic phase transition and the other at 5GPa is still a puzzle. However, the existence of the BaTiO3Raman spectrum in the
paraelec-tric phase has been reported at high pressure11up to 8.6 GPa, and high temperature6 up to 350 °C. These results had been explained as due to the disorder in the positions of Ti atoms in the polycrystalline samples that breaks the Raman selec-tion rules.
Although there have been a number of Raman and infra-red experiments as a function of temperature and pressure on the BaTiO3 since the 1960s,12–14there is very little work on
the BaxSr1⫺xTiO3 system. In addition, the vibrational
prop-erties of BaTiO3 studied by Raman measurements and its
temperature dependence of the coupling parameters have been obtained based on the coupled-phonon model. In order to avoid influences of the volume when temperature changed, the composition-dependent experiment of BaxSr1⫺xTiO3 has an advantage over temperature in study-ing the effect of phase transition on the couplstudy-ing of the pho-non states. Recently, BaxSr1⫺xTiO3 system prepared by
solid-state reaction shows the lattice parameter as a function of x closely follows Vegard’s law.3,15 However, the samples prepared by sol-gel technique did not show the same tendency.16 In this paper, we present the x-ray diffraction
共XRD兲 and Raman study of polycrystalline BaxSr1⫺xTiO3 powders with x varying from 0 to 1. The lattice constants were calculated from XRD ⫺2 scans and the detailed Raman studies were analyzed by coupled-phonon model. From the spectra, the characteristics of the tetragonal-to-cubic phase transition and a new observed structural ordering are discussed.
II. EXPERIMENT
In our experiments, the sol-gel technique was employed for preparing BaxSr1⫺xTiO3polycrystalline powders to yield samples with high composition accuracy and homogeneity.16 We first boiled acetic acid to 120 °C for producing dehy-PHYSICAL REVIEW B, VOLUME 64, 224103
drated solvent. A proper amount of barium acetate and stron-tium acetate共99% purity from Gransman Inc.兲 was dissolved in dehydrated acetic acid at 90 °C and was sufficiently stirred for 20 min. Titanium isopropoxide and some di-ethanol were then added to the solution and were stirred for another 20 min. We dried and solidified the solution by illuminating with a 400 W infrared lamp for two days. The resulting white solid was heated to 165 °C for an hour and then was ground into powders. We then sintered the powders at 1000 °C for 150 min in an Al2O3 boat. This sintering temperature is far below the melting point of any composition of BST which is required for the conventional solid-state reaction.
X-ray powder diffraction patterns were obtained using SHIMADZU XD-5 diffractometer and monochromated high intensity Cu-␣line of wavelength 1.5405 Å over the range 20°⭐2⭐75° by using with both step-scanning mode of integration time 1 sec with 0.01 degree per step and a con-tinuous 2 scan of 4°/min. The patterns were then Gaussian fitted to get the diffraction peaks and widths. We obtain ba-sically the same results from different scanning modes. Thus, we only show the patterns of continuous scan mode in the following section. For Raman measurement, the 488 nm line of an Ar⫹laser, which is far from resonance with band-gap energy of BaxSr1⫺xTiO3, was used as the excitation source.
The scattered light was analyzed using a SPEX 1877C triple spectrograph equipped with a cooled CCD 共PHOTOMET-RICS CC200兲 at ⫺90 °C. It is not possible to obtain polar-ized spectra because there is no preferred orientation of the polycrystalline samples. Thus, all spectra reported in this study are unpolarized from polycrystalline BaxSr1⫺xTiO3.
III. RESULTS AND DISCUSSION
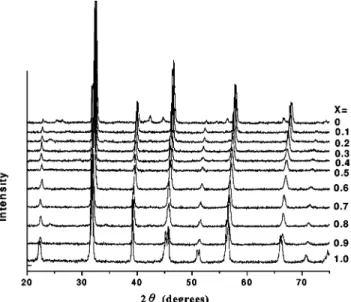
Figure 1 shows x-ray diffraction 共XRD兲 patterns of the samples with various x values obtained by the aforemen-tioned sol-gel processes. The resulting XRD patterns were then analyzed with Rietvelt refinement procedure.17 In this procedure, we used the tetragonal structure for all BST
com-pounds to obtain the lattice constants of the a axis and c axis. When BST’s belong to the tetragonal system, the initial data of 共101兲, 共110兲, 共111兲, 共112兲, 共211兲, 共202兲, and 共220兲 planes together with the JCPDS data are input to the XLAT program17 共a personal computer program for the refinement of lattice constants兲, whereas, only one of the degenerate peaks关e.g., 共101兲 and 共110兲 are degenerate兴 are used for the cubic phases. The results were plotted in Fig. 2 with the statistical residuals being less than 0.1%. The lattice con-stants of our synthesized BaTiO3 polycrystalline powder
agree well with previous literature18,19as 4.003 and 3.897 Å for SrTiO3. We found, in Fig. 2共a兲, both the lattice constants of the a axis and c axis follow the Vegard’s law for 0⬍x
⭐0.4, but off the Vegard’s law for x⬎0.4 where an obvious
discontinuity at x⬇0.7 corresponds to the well-known tetragonal-cubic phase transition. It also can be seen that the ratio of c/a almost equals to 1 when x⭐0.75 from Fig. 2共b兲, then drastically increases from 1 as further increasing x. It further confirms the tetragonal-cubic phase transition around
x⬇0.7⫺0.75. The other turning point around x⬇0.4⫺0.5
has not been reported for BaxSr1⫺xTiO3. Similar behavior
has also been observed in our previous data of the effective FIG. 1. Powder XRD patterns of BaxSr1⫺xTiO3 samples with
various x values.
FIG. 2. The lattice constants a and c of BaxSr1⫺xTiO3 after
second harmonic generation coefficients and birefringence of these samples,16 therefore, it is believed this result is not an experimental artifact.
The Raman spectra of BaxSr1⫺xTiO3polycrystalline
pow-ders taken at room temperature are plotted in Fig. 3 for vari-ous x values. Furthermore, we have increased the acquisition time of the cubic phase BST by 6 times, labeled in the figure, for x⬍0.7. First of all, we found in pure BaTiO3 powder
there is a dip at 180 cm⫺1 which was assigned to A1(TO1) phonon mode, a broad band centered at 260 cm⫺1 corre-sponds to A1(TO2) phonon mode, a sharp peak at 305 cm⫺1 is attributed to the B1and E(TO⫹LO) modes, and the
asym-metric broad band near 520 cm⫺1corresponds to E(TO) and
A1(TO3) modes. Finally, the highest frequency peak near
720 cm⫺1was observed, in which both A1(LO) 共the hardest
LO mode兲 and E(LO) character seems to be present. In ad-dition to the aforementioned phenomena, the Raman peaks at 305 and 720 cm⫺1are specific to the tetragonal phase of the BaTiO3 as described in Ref. 6. Our polycrystalline
speci-mens are randomly oriented so do not admit the polarization selection between A1 and E modes. The observed Raman peaks of the BaTiO3polycrystalline agree well with the
pow-der Raman spectra reported by Osada et al.8 and with the reported for polycrystalline thin film grown by rf sputtering.20
As x decreases from 1 to 0.7, the sharp peak at 310 cm⫺1 does not show evidently frequency shift but weakens and disappears when x⬍0.7. Whereas, the A1(LO)/E(TO) mode
at 720 cm⫺1 monotonously increases in its frequency as varying x from 1 to 0.7 and disappears at x⬇0.7. In addition, the appearance of spectral dip at 180 cm⫺1, which corre-sponds to the softest A1(TO) mode, has been explained as an
interference due to the anharmonic coupling between the three A1(TO) phonons.
11
In addition to the dip, the broad band near 260 cm⫺1
关A1(TO2)兴 shifts to low frequency for 0.7⬍x⬍1, and then
to higher frequency for even lower x. The asymmetric broad band near 500– 600 cm⫺1 consisting of an E(TO) mode at 518 cm⫺1 and a A1(TO3) mode on the high frequency
shoulder14has a remarkable change in its lineshape. The ob-served Raman spectra became noisy when x⬍0.7. It is inter-esting to note that the BaxSr1⫺xTiO3undergoes a phase
tran-sition from ferroelectric to paraelectric phase when x⬇0.7. The broadened spectra observed in the paraelectric phase in-dicates that the Raman selection rule is relaxed ascribed to the disorder in the positions of the Ti atoms in the unit cells of the polycrystalline samples.13,19The Raman results would show the instantaneous symmetry of our specimens if it is lower than the cubic.
In order to ascertain the influence of the coupling effect, Sood21 and Chaves et al.22 have considered the anharmonic coupling effect to distinguish three individual phonon modes in earlier Raman studies on BaTiO3, SrTiO3, AlPO4 and a-quartz. The Raman line shape can be expressed as
I共兲⫽A关n共兲⫹1兴Im关T*GT兴, 共1兲
where the inverse matrix response is
G⫺1共兲⫽⍀2⫺2I⫺i⌫. 共2兲
关n()⫹1兴 is the usual Bose-Einstein factor, A is a constant, and T is a vector involving Raman scattering amplitudes. In this equation I is the unit matrix,⍀2the force constant ma-trix, and ⌫ the damping matrix are expressed as follows:
⍀2⫽
冉
1 2 12 2 0 12 2 2 2 23 2 0 23 2 3 2冊
,⌫⫽冉
⌫1 2 0 0 0 ⌫22 0 0 0 ⌫3 2冊
共3兲with i andi j (i, j⫽1•••3) being the frequencies of
un-coupled modes and the coupling strength between modes i and j. It has been assumed the coupling between1 and3
is negligible with 13⫽0.
Although we observed disappearance of A1(TO1) dips
and broadening of A1(TO3) mode as x⬍0.5 from Fig. 3, in
order to fit well with measured spectra, we still used the coupled-phonon model to fit the observed Raman spectra in the whole composition range and obtained the fitting param-eters. Using similar simulation procedure described in Ref. 21, we first subtracted the spectra by a second order polyno-mial which fits to the base line of the spectra and used the elements of ⌫, ⍀2, and T as adjusting parameters of the FIG. 3. Unpolarized Raman spectra of polycrystalline
BaxSr1⫺xTiO3 关x from 0 to 1 and the dashed line represent the
simulated specta I()兴.
calculated I() to obtain the least squares among 120–330 cm⫺1 and 480– 650 cm⫺1 related to the three A1(TO) and E(TO) modes.
The fitted parameters were plotted in Fig. 4 and came up with the following features when x decreases from 1 to 0.共i兲
1 continuously soften and 3 displays a trend toward the
higher value with two discontinuities occurred around x at 0.75 and 0.5.共ii兲2slightly decreases as varying x from 1 to
0.75 and then monotonically increases.共iii兲 The linewidth ⌫1
and ⌫3 show the similar behavior having distinct
disconti-nuities near x⫽0.5. Moreover, ⌫2 of the A1(TO2) mode
reaches a local maximum at x⬇0.75 due to tetragonal to cubic phase transition then increases when x⬍0.5. 共iv兲 The coupling constant 12is almost constant in the range of 0.5 ⬍x⬍1 and progressively increases as x⬍0.5. 共v兲 Whereas,
23is almost 2–3 times larger than12 and shows a
notice-able turning point near x⬇0.7. To sum up the statements above, we found that x⬇0.7⫺0.8 is the well-known tetrag-onal to cubic phase transition and a new transition occurs at
x⬇0.4⫺0.5, in which the fitting parameters, e.g.,12, ⌫1,
⌫2, and⌫3, show some variation that is consistent with the
x-ray diffraction, second-harmonic generation, and birefrin-gence measurements.16 The severe broadening of the line-widths 共or high phonon decaying rates兲 and decreasing in amplitudes of three A1(TO) modes reflect the selection rule
of Raman cross section that the characteristic of these modes vanish in cubic phase. In addition, we believe that the disap-pearance and broadening of Raman modes around 518 cm⫺1
关E(TO)兴 and 180 cm⫺1 are also indicatives of some struc-tural reordering taking place near x⬇0.5.
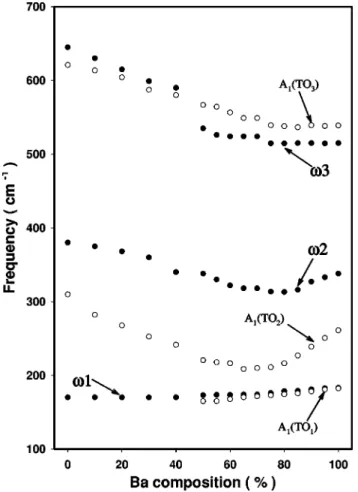
Figure 5 shows the plot of as-read peak positions from the data as well as the values of three A1-symmetry TO modes obtained from the coupled-phonon model. It can be seen that the composition-dependent frequency shifts of decoupled
1, 2and3have similar tendency with the as-read ones.
However, the stronger coupling (23⬎12) between A1(TO2) and A1(TO3) causes the repulsion of these modes,
especially it brings about the A1(TO2) undergoing a
mini-mum around x⬇0.7.
Figure 6 shows the peak of A1(LO3) mode at 720 cm⫺1
and A1(TO1) mode versus Ba composition. It indicates a
linear splitting of these two modes in the tetragonal phase. According to the calculation of Born effective charges of
ABO3 perovskites by Zhong et al.,9we comprehend that the
calculated mode effective charge for the softest TO mode is the largest as listed in Table III of Ref. 9. It means that the softest mode will couple most strongly with the electric field. Due to strong mode mixing via Coulomb interaction, the softest TO 关A1(TO1)兴 mode is most closely associated with
the hardest LO 关A1(LO3)兴 mode that gives rise to a giant
LO-TO splitting in ABO3 compounds, especially for the
ferroelectric phonon modes. From Fig. 1共b兲, the cell dimen-sion of BaxSr1⫺xTiO3 decreases when x changes from 1 to
FIG. 4. The fitted parameters plotted as a function of x 共Ba
composition兲. FIG. 5. The as-read peak positions from the data as well as the values obtained from the fit of the data to the coupled-phonon model共drawn by solid symbols兲 are plotted as a function of x 共Ba composition兲.
0.7. The decrease of cell dimension strengthens coupling of the A1(TO1) mode and A1(LO3) mode by
DmnLO⫽DmnTO⫹4e ⍀
Zm*Zn*
⬁共0兲, 共4兲
where D is the dynamical matrix,⍀ the volume of the unit cell, and Z* the Born effective charge. It has been known that the Coulomb interaction will play a very important role in the occurrence of ferroelectricity.23In other words, it was demonstrated that this feature is associated with the exis-tence of an anomalously large destabilizing dipole-dipole in-teraction, sufficient to compensate the stabilizing short-range forces and induce the ferroelectric instability. Thus, as ex-pected and from our Raman and XRD studies, BaxSr1⫺xTiO3
undergo a transition from tetragonal to cubic phase at x
⬇0.75. We have verified from Fig. 5 the increase of giant
LO-TO splitting as decreasing x will weaken the ferroelec-tricity as the first-principle calculation by Zhong et al.9It can be seen that the differences between the LO and TO frequen-cies denoting the Coulomb interaction arose from the last term in Eq. 共4兲. The variation of the cell dimension ⍀ 关see Figs. 1共a兲 and Fig. 3 of Ref. 16兴 in tetragonal phase would lead the LO-TO splitting to become nonlinear which is dif-ferent from our linear result. The inconsistency may be due to strong coupling between three A1(TO) modes and lack of
detailed information on the dynamical effective charges for BaxSr1⫺xTiO3 compounds.
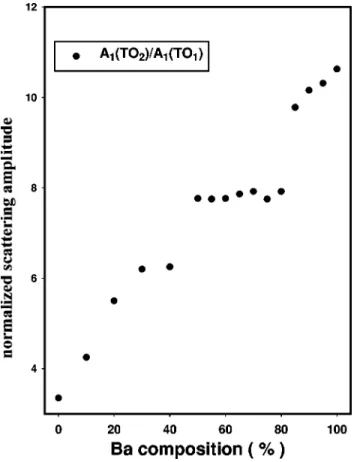
The normalized scattering amplitudes T2/T1 are shown in Fig. 7 as a function of x 共Ba mole fraction兲. It is noted that
the tendency is similar to the effective nonlinearities reported by Chen et al.7 Figure 8 shows the projections of A1(TO1)
and A1(TO2) vibration modes of perovskite structure. The
oxygen atoms and cation oscillate oppositely in the A1(TO2) mode. Unlike the A1(TO2) mode, the TiO6 octahedron and
Ba共Sr兲 atoms vibrate in opposite directions at TO1 mode. It is well known that BaTiO3 belongs to the displacement type
of ferroelectric material and it is believed that the BaxSr1⫺xTiO3 is of the same type. The spontaneous
polar-ization Ps can be expressed as Ps⫽P0
⬘
•⌬z, where ⌬zde-notes the displacement of ions from the symmetric positions which are occupied in the paraelectric phase. From the dis-cussion above, we infer that the A1(TO2) mode is more
sen-sitive to the dipole displacement than the A1(TO1) mode. It
can be seen from Fig. 7 that the normalized T2/T1 lower its
values as decreasing x. In the meanwhile, there is a discon-tinuity occurred near x⬇0.7⫺0.8 and it is closely related to the tetragonal to cubic phase transition.
From the x-ray and Raman measurements on polycrystal-line BaxSr1⫺xTiO3 presented in Figs. 1–7, we deduce that
there are two structural rearrangements; one between x at 0.7 and 0.8 which corresponds to the well-studied ferroelectric to paraelectric phase transition and the other at x near 0.5 which has not been reported for BaxSr1⫺xTiO3 system. In the
paraelectric phase of the BST, the Raman spectra imply that this phase does not have perfect cubic symmetry but has some disorder which break the symmetry and permit Raman activity. The reported results by Naik et al. of high-pressure Raman experiments of polycrystalline BaTiO3has show
evi-FIG. 6. The LO-TO splitting of the A1(LO) and A1(TO1)
modes for BaxSr1⫺xTiO3at x⬎0.7. FIG. 7. The normalized scattering amplitudes of
A1(TO2)/A1(TO1) as a function of Ba composition.
dence for a new structural phase transformation near 5 GPa. Further experiments indicated the observed changes in the Raman spectra need not be due to contributions from rhom-bohedral, orthorhombic and hexagonal phases.
The spontaneous polarization of a ferroelectric crystal had been shown varying with temperature according to24 Ps ⫽a
冑
Tc⫺T, while the second-order nonlinear optical 共NLO兲coefficient had been proposed proportional to the spontane-ous polarization of a ferroelectric crystal.25 Since Tc obeys
the approximate relationship as3 Tc (K)⫽360x⫹40 in
BaxSr1⫺xTiO3, we expect to observe the NLO coefficient
which varies with the mole fraction of Ba by the square-root law as well. However, in the previous study,16 we observed that the trend of NLO coefficient and birefringence versus x had similar behavior to the cell dimension. The NLO coeffi-cient and birefringence of BaxSr1⫺xTiO3 linearly depend on
the cell dimension other than obeying the square-root law. The anomalous discrepancy between the experimental results and prediction of the references 24 and 25 maybe results from the dynamical effective charges9should be regarded as composition dependence.
The turning point arround x⬇0.4⫺0.5 observed in XRD and Raman analyses may be caused by the atomic arrange-ment during the sample growth procedure. Due to the Ba atom possesses larger radius than Sr, the introduction of Ba to substitute Sr will surely enlarge the lattice denoted in XRD that normally obeys the Vegard’s law.3,15Let us discuss the lattice change due to Ba atomic substitution starting from the pure SrTiO3 crystal (x⫽0). According to the thermody-namics, the free energy of BST should be minimized when keeping on substituting Sr by Ba, the excess Ba atoms would avoid occupying the nearest-neighbor positions.
Since SrTiO3 crystal belong to cubic structure, it has the
basis of
Sr: 共0,0,0兲, Ti: 共1/2,1/2,1/2兲,
3 O: 共1/2,1/2,0兲; 共1/2,0,1/2兲; 共0,1/2,1/2兲 in a unit cell and with three primary lattice vectors aជ
⫽(1,0,0), bជ⫽(0,1,0), and cជ⫽(0,0,1), respectively. Assume
the first substituting Ba atom occupies at the coordinate (0,0,0) in a specific unit cell. The coordinates of (⫾1,⫾1,
⫾1) are those of isomorphic lattices belonging to the
neigh-boring unit cells; thus, the successive substituting Ba atoms tend to sit at one of the next nearest-neighboring positions in the unit cell to suppress the lattice expansion. Otherwise, the lattice will be dramatically elongated to raise the free energy. While x⫽0.5, half of the Sr atoms have been replaced by Ba atoms to force Ba to sit next to each other and suddenly increase its lattice constants 关see Fig. 2共a兲兴. The observed turning points in lattice constants along with the phonon fre-quencies and coupling constants from XRD and Raman spectra is a result of cell distortion around x⫽0.4⬃0.5. Our BST powders are prepared by sol-gel technique at room tem-perature, and the atom arrangement may have been deter-mined during the gelation. Although the powder samples were sintered at 1000 °C, we believe that the temperature is far below the melting point of BST and will not provide enough free energy for atom rearrangement. The free energy supplied by the thermal energy during sample preparation could lead two Ba atoms to sit next to each other at Ba content around x between 0.4 –0.5 rather than at x⫽0.5 that was illustrated above for zero temperature. On the other hand, the extra thermal energy would have relaxed the lattice to cause atomic rearrangement when the BST powders were synthesized under high temperature by using solid-state re-action method.3,15Thus the previous reported XRD and Ra-man measurements did not show the same consequence.
IV. CONCLUSION
In summary, we have investigated the XRD and Raman spectra of BaxSr1⫺xTiO3 prepared by sol-gel method. The
lattice constants of the BaxSr1⫺xTiO3 were estimated from
XRD spectra and the phase transition behavior was exam-ined. The analysis of the Raman and XRD spectra under various mole fractions of Ba indicates that there are at least two structural phase transitions. The first one occurring at x
⬇0.7 corresponds to the transition from tetragonal to cubic
phases. The second transition occurs around x⬇0.4⫺0.5 which has not been reported in previous studies by solid-state reaction method. We explained that the experimental evidence might be due to the atomic arrangement of samples during sol-gel preparation at lower temperature compared to that prepared by the conventional solid-state reaction method. The coupled-phonon model has been used to deter-mine the composition dependence of mode frequencies, line-FIG. 8. Projections of A1(TO1) and A1(TO2) vibration modes
widths, transition amplitudes, and coupling parameters. Since no Raman activity is expected in the cubic phase, the observation of the Raman spectra at the region is attributed to the presence of disorder. The observed repulsion of LO-TO splitting is a result of decreasing cell dimension and strengthening the electron-phonon coupling. The anomalous
inconsistency in our experimental results and prediction of Refs. 24, 25, and 9 may be due to lack of detailed informa-tion on the dynamical effective charges for BaxSr1⫺xTiO3
compounds. Further molecular dynamical study is under-way to determine the mechanism of the observed structural ordering.
1H. P. Roaksby and H. D. Megaw, Nature 共London兲 155, 484 共1945兲.
2K. A. Muller and H. Burkard, Phys. Rev. B 19, 3593共1979兲. 3V. V. Lemanov, Phys. Solid State 39, 318共1997兲.
4F. Jona and G. Shirane, Ferroelectric Crystals共Pergamon, New York, 1962兲.
5J. A. Sanjurjo, R. S. Katiyar, and S. P. S. Porto, Phys. Rev. B 22, 2396共1980兲.
6R. Naik, J. J. Nazarko, C. S. Flattery, U. D. Venkateswaran, V. M. Naik, M. S. Mohammed, G. W. Auner, J. V. Mantese, N. W. Schubring, A. L. Micheli, and A. B. Catalan, Phys. Rev. B 61, 11 367共2000兲.
7C. Li, Z. Chen, and H. Lu, J. Appl. Phys. 86, 4555共1999兲. 8
M. Osada, M. Kakihana, and W. Cho, Appl. Phys. Lett. 75, 3393 共1999兲.
9W. Zhong, R. D. King-Smith, and D. Vanderbilt, Phys. Rev. Lett.
72, 3618共1994兲.
10U. D. Venkateswaran, V. M. Naik, and R. Naik, Phys. Rev. B 58, 14 256共1998兲.
11I. A. Akimov, A. A. Sirenko, A. M. Clark, J. H. Hao, and X. X. Xi, Phys. Rev. Lett. 84, 4625共2000兲.
12A. Pinczuk, W. Taylor, and E. Burstein, Solid State Commun. 5, 429共1967兲.
13J. L. Parsons and L. Rimai, Solid State Commun. 5, 423共1967兲. 14M. DiDomenico, S. H. Wemple, and S. P. Porto, Phys. Rev. 174,
524共1968兲.
15V. V. Lemanov, E. P. Smirnova, P. P. Syrnikov, and E. A. Tara-kanov, Phys. Rev. B 54, 3151共1996兲.
16W. K. Chen, C. M. Cheng, J. Y. Huang, and W. F. Hsieh, J. Phys. Chem. Solids 61, 959共2000兲.
17A computer program for Rietveld analysis of x-ray and neutron powder diffraction patterns共http://www-structure.llnl.gov兲. 18Y. A. Abramov, V. G. Tsirelson, V. E. Zavodnik, and I. D. Brown,
Acta Crystallogr., Sect. B: Struct. Sci. 51, 942共1995兲.
19S. A. Howard, J. K. Yau, and H. U. Anderson, J. Appl. Phys. 65, 1492共1989兲.
20B. Wang, L. D. Zhang, L. Zhang, Y. Yan, and S. L. Zhang, Thin Solid Films 354, 262共1999兲.
21A. K. Sood, N. Chandrabhas, D. V. S. Muthu, and A. Jayaraman, Phys. Rev. B 51, 8892共1995兲.
22A. Chaves, R. S. Katiyar, and S. P. S. Porto, Phys. Rev. B 10, 3522共1974兲.
23J. D. Axe, Phys. Rev. 157, 429共1967兲.
24G. A. Smolensky, J. Phys. Soc. Jpn. 28, 26共1970兲. 25F. Wang, Phys. Rev. B 59, 9733共1999兲.