行政院國家科學委員會專題研究計畫 成果報告
中風病人全面性日常生活功能評估量表之發展
計畫類別: 個別型計畫 計畫編號: NSC93-2314-B-002-284- 執行期間: 93 年 08 月 01 日至 94 年 07 月 31 日 執行單位: 國立臺灣大學醫學院職能治療學系 計畫主持人: 薛漪平 共同主持人: 王文中 報告類型: 精簡報告 處理方式: 本計畫可公開查詢中 華 民 國 94 年 10 月 27 日
1
another article about quality of life questionnaire in stroke patients soon.
A Rasch analysis of a self-perceived change in quality of life scale in patients with mild stroke
Abstract
A Rasch analysis was used to assess the unidimensionality and appropriateness of the scoring level of a 13-item self-perceived change in quality of life scale (CQOL) for stroke patients. A total of 158 patients with mild stroke completed the CQOL themselves at home. The results showed that a unidimensional CQOL can be created by deleting the three items related to speaking, vision, and thinking. The 4 scoring categories of the shortened scale were deemed appropriate from the analysis. These results provide preliminary evidence of the 10-item CQOL in assessing self-perceived change in quality of life in stroke patients. Further studies are needed to examine the test-retest reliability, criterion validity, and responsiveness of the 10-item CQOL in stroke patients.
Introduction
Stroke patients can be impaired in the physical, social, emotional, and other health-related quality of life (HRQOL) domains [1]. Even among patients with good functional recovery, many still decline substantially after discharge from the hospital and have very poor HRQOL for several years [2, 3]. Longitudinal research into the HRQOL of stroke survivors is therefore warranted.
Although self-perceived change in HRQOL is critical in the patient-centered approach to outcome measurement [4, 5], few HRQOL indices directly assess patient's own perceptions of clinically important changes. Williams and coworkers [6] developed the Stroke-Specific Quality of Life Scale (SS-QOL) and found that there were 12 domains that were reliable, valid, and responsive in stroke patients: energy, family roles, language, mobility,mood, personality, self-care, social roles, thinking, vision,upper extremity function, and work/productivity. These authors constructed a 13-item scale (i.e., the 12 items based on the aforementioned 12 domains and an item relating to the overall QOL), called the change of QOL (CQOL). The patients were asked to rate the items, compared with their QOL prior to stroke, as ‘a lot worse = 1’, ‘somewhat worse = 2’, ‘a little worse = 3’, or ‘the same = 4’. The CQOL currently is the only instrument measuring stroke patients’ self-perceived change in HRQOL. However, its psychometric properties in stroke patients were largely unknown.
Rasch analysis is useful in testing whether items from a test measure a
unidimensional construct [7, 8], which is required to justify the summation of scores. It is also useful in determining appropriateness of the scoring levels of a scale, which refers to whether or not participants can be differentiated by their responses as clearly as the levels allow [9]. In addition, Rasch analysis provides the person separation statistic and targeting information [10, 11]: The former can be used to evaluate the extent to which a
questionnaire can distinguish those with different levels of HRQOL, and the latter, to examine the extent to which the items of a questionnaire are of appropriate difficulty for the participants studied. This study used a Rasch analysis to assess the unidimensionality, appropriateness of the scoring level, person separation, and appropriateness for the sample (targeting) of the CQOL for stroke patients.
Lin 2
Methods
Subjects
Participants were recruited from the registry of the Quality of Life after Stroke Study in Taiwan between December 1, 1999 and December 31, 2001. Details of the selection procedures have been reported elsewhere [12].
Instruments
The Chinese version of the CQOL was used in this study. The CQOL was translated from English into Mandarin Chinese based on general procedure [13]. The Canadian Neurological Scale (CNS) was used to assess severity after stroke [14]. The score ranges from 0 to 11.5. The Barthel Index (BI) is a measure of the severity of basic activities of daily living (ADL) function [15]. The total score is a simple additive summary score across 10 items. Its score ranges from 0 to 20.
Procedure
The patients completed the CQOL questionnaire themselves at home. Initial stroke severity was ascertained from applying the CNS retrospectively to medical records. An occupational therapist administered the BI to the patients and their caregivers in a face-to-face interview.
Data analysis
The unidimensionality of the CQOL was examined using the Rasch rating scale model [8] with the WINSTEPS computer program [16]. To examine the
unidimensionality of the CQOL, the infit and outfit statistics were used to examine whether the data fit the model’s expectation. Items with infit or outfit mean square error (MNSQ) greater than 1.3 indicated potential misfits [11, 17]. Furthermore, when items fit the model’s expectation, the residuals (observed scores minus expected scores) should be randomly distributed. A principal component analysis was conducted to verify whether any dominant component existed among the residuals. If dominant components were found, the unidimensionality assumption was violated.
We examined the Rasch estimates of the intersection parameters of each item of the CQOL to see if the scaling levels were adequate. Whether the items of the CQOL cover the full range (extent) of self-perceived change in HRQOL was verified by examining the gaps between the item difficulties along the item hierarchy. In addition, the person
separation statistic refers to the ratio of spread in item difficulties to the error in estimating them. A value ≥ 2.0 is acceptable [10]. Furthermore, the average person measure was used to determine the extent to which the set of items is of appropriate difficulty for the patients. An absolute average person measure ≥ 0.5 indicates slight mistargeting [10].
Results
A total of 158 patients who had a stroke within the previous 6 to 12 months and who were living in the community participated in this study. The patients had mild to moderate severity at admission as shown by their CNS scores. The BI scores indicated that patients were slightly limited in basic ADL. Detailed characteristics of these patients are shown in Table 1.
Three items (i.e., speaking, vision and thinking) were found to be poor-fitting (both infit and outfit MNSQs larger than 1.3) and were deleted from further analysis. Table 2 shows the estimates of overall difficulties, infit MNSQ and outfit MNSQ for the 10 remaining items. A principal component analysis on the standardized residuals of Rasch-transformed scores revealed no dominant principal component (the first and the second components accounted for only 25% and 16% of the residual variances,
respectively). These results suggested that the shortened 10-item CQOL constitutes a unidimensional construct measuring self-perceived change in HRQOL.
The Rasch estimates of the three intersection parameters were -1.16, -0.54 and 1.70, respectively, all with a standard error of 0.09. As the range of the intersection parameters (2.86) was rather wide compared with the standard deviation for person measures (1.99), the 4-level scaling of the shortened 10-item CQOL was considered appropriate.
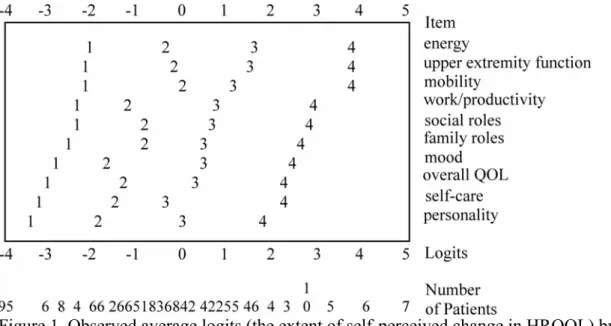
No floor or ceiling effects were found since only 16 (10%) of the 158 patients had extreme scores (7 receiving the highest possible score and 9 receiving the lowest possible score). The person separation index (3.12) was satisfactory, indicating that the scores on the shortened 10-item CQOL could distinguish four distinct levels (strata) of change in HRQOL. Furthermore, the average patient measure was close to zero (-0.03), indicating that the items were well targeted to the sample [10]. Figure 1 shows that the estimated perceived changes of the patients were well scattered throughout the possible score range of the shortened 10-item CQOL and that there were no substantial gaps between the item difficulties (the extent of change in HRQOL) along the item hierarchy.
Lin 4
Discussion
Our study found that a unidimensional CQOL can be created by deleting the three items related to speaking, vision, and thinking. The total score of the shortened CQOL scale can be used to represent, on a single dimension, a patient's perception of change in HRQOL. A higher score indicates a smaller degree of self-perceived change in HRQOL before and after stroke. From the substantive point of view, it often does not make sense to combine items from separate (or distinct) domains to gauge performance on a single scale. However, the shorten scale for the overall CQOL for stroke patients proposed in this study was supported by the Rasch analysis and it can be expected to yield more precise estimates of changes in QOL for stroke patients at a given level of limitation, and translate into clinically sound decision regarding treatment.
The energy item was located in the highest part of item difficulty (with highest difficulty logit), indicating the greatest self-perceived change in HRQOL as compared with the rest of the items, while personality had the lowest difficulty logit. The ordering of the items of shortened CQOL generally follows clinical expectations (e.g., the patients perceived more change in “mobility” and “work/productivity” than in “self-care”). These results are useful in a patient-centered approach. For example, the ordering of the items can help determine treatment priority in clinics. The clinicians may establish their
treatment plans based on the extent and hierarchy of change in HRQOL perceived by their patients.
The validity of assessing change in HRQOL over time may be threatened if stroke patients experience a response shift in perceptions and internal standards [18,19]. They may judge their subjective health to be relatively stable despite large changes in objective measures of health, or alternatively, judgments of health may change in a situation where there is no objective change in health, because the standard of good health has shifted according to new information. In addition, the implicit theories of change in subjective judgments of change from a previous state may have an influence on assessing change in HRQOL over time [18]. Accordingly, further studies are needed to examine how response shift and the implicit theory of change affect the measurement of change in HRQOL.
Our results provide good evidence of unidimensionality and appropriateness of scaling of the shortened 10-item CQOL in mild stroke patients. In addition, the 10 items were well targeted to the sample and covered a comprehensive range of self-perceived change in HRQOL in our patients. To comprehensively validate the shortened 10-item CQOL, further studies are needed to validate the scale in stroke patients with
characteristics different from those recruited for this study (e.g., patients having had a stroke within 6 months and patients with moderate or severe disability) and to examine its test-retest reliability, criterion validity and responsiveness. Furthermore, because patients’ cognitive function plays an important role in assessing their self-perceived change in HRQOL, cognitive function, especially memory, of the subjects should be assessed in future validation studies.
References:
1. Kim P, Warren S, Madill H, Hadley M. Quality of life of stroke survivors. Qual Life Res 1999; 8: 293-301.
2. Sturm JW, Donnan GA, Dewey HM, Macdonell RA, Gilligan AK, Srikanth V, Thrift AG. Quality of life after stroke: the North East Melbourne Stroke Incidence Study (NEMESIS). Stroke 2004; 35: 2340-2345.
3. Carod-Artal J, Egido JA, Gonzalez JE, de Siejas V. Quality of life among stroke survivors evaluated 1 year after stroke. Experience of a stroke unit. Stroke 2000; 31: 2995–3000.
4. Buck D, Jacoby A, Massey A, Ford G. Evaluation of measures used to assess quality of life after stroke. Stroke 2000; 31: 2004-2010.
5. Doyle PJ. Measuring health outcomes in stroke survivors. Arch Phys Med Rehabil 2002; 83 Suppl 2: S39-43.
6. Williams LS, Weinberger M, Harris LE, Clark DO, Biller J. Development of a stroke-specific quality of life scale. Stroke 1999; 30: 1362-1369.
7. Rasch G. Probabilistic models for some intelligence and attainment tests. Chicago: MESA Press, 1980.
8. Wright BD, Masters GN. Rating scale analysis. Rasch measurement. Chicago: MESA Press, 1982.
9. Wright BD, Mok M. Rasch models overview. J Appl Meas 2000; 1: 83-106.
10. Duncan PW, Lai SM, Bode RK, Perera S, DeRosa J. Stroke Impact Scale-16: A brief assessment of physical function. Neurology 2003; 60: 291-296.
11. Prieto L, Alonso J, Lamarca R. Classical test theory versus Rasch analysis for quality of life questionnaire reduction. Health Qual Life Outcomes 2003; 1: 27.
12. Mao HF, Hsueh IP, Tang PF, Sheu CF, Hsieh CL. Analysis and comparison of the psychometric properties of three balance measures for stroke patients. Stroke 2002; 33: 1022-1027.
13. Aaronson N, Alonso J, Burnam A, Lohr KN, Patrick DL, Perrin E, Stein REK. Assessing health status and quality of life instruments: attributes and review criteria. Qual Life Res 2002; 11: 193-205.
14. Goldstein LB, Chilukuri V. Retrospective assessment of initial stroke severity with the Canadian Neurological Scale. Stroke 1997; 28: 1181-1184.
15. Mahoney FI, Barthel DW. Functional evaluation: the Barthel Index. Md State Med J 1965; 14: 61-65.
16. Linacre JM. WINSTEPS Rasch Measurement Computer Program. Chicago, IL: 2003. 17. Wright BD. Reasonable mean-square fit values. In: Wright BD, Linacre JM, eds.
Rasch measurement transactions. Part 2. Chicago: MESA, 1994.
18. Norman G. Hi! How are you? Response shift, implicit theories and differing epistemologies. Qual Life Res 2003; 12: 239-249.
19. Ahmed S, Mayo NE, Wood-Dauphinee S, Hanley JA, Cohen SR. Response shift influenced estimates of change in health-related quality of life poststroke. J Clin Epidemiol 2004; 57: 561-570.
Lin 6
Table 1. Characteristics of the patients with stroke (N = 158) Characteristics
Gender Male 61%
Age Mean years (SD) 62.7(11)
Diagnosis Cerebral hemorrhage
Cerebral infarction 112 (71%) 46 (29%)
Side of hemiplegia Right 44%
CNS score at admission Median (lower-upper quartile) 8 (6.5-10.5) Days after stroke at interview Mean (SD) 257 (92) Assessment results in the community
BI score Median (lower-upper quartile) 100 (95-100) 10-item CQOL raw score Median (lower-upper quartile) 15 (6-24)
Table 2. Difficulty (extent of self-perceived change in HRQOL), standard error (SE), and infit and outfit statistics of the modified 10-item CQOL
Item* Difficulty
logit SE Infit MNSQ MNSQ Outfit
Energy 1.10 0.14 1.29 1.47
Upper extremity function 1.00 0.14 0.81 0.74
Mobility 0.97 0.14 0.89 1.15
Work/productivity 0.19 0.13 0.97 0.92
Social roles 0.18 0.13 0.96 0.80
Family roles 0.01 0.13 1.04 0.86
Mood -0.53 0.13 1.00 1.13
Overall quality of life -0.63 0.13 0.92 0.82
Self-care -1.01 0.13 0.92 0.82
Personality -1.28 0.13 1.20 1.31
Lin 8
Figure 1. Observed average logits (the extent of self-perceived change in HRQOL) by scaling level of each item of modified 10-item CQOL and patient distribution. The items are arranged in descending order of self-perceived change in HRQOL. The scaling levels (1, 2, 3, and 4) indicate ‘a lot worse’, ‘somewhat worse’, ‘a little worse’, and ‘the same’, respectively. The axis at the bottom of the figure (as well as the one on top) indicates the location of persons on the logit scale. The two rows of digits beneath indicate the number of persons at that location, with the top row standing for units of 10 and the bottom one, units of one.