A New Approach for Determining the
Stability of Recombinant Human Epidermal
Growth Factor by Thermal Fourier Transform
Infrared (FTIR) Microspectroscopy
http://www.jbsdonline.com Abstract
Based on Fourier transform infrared (FTIR) microspectroscopy, the conformation of rhEGF under the influence of pH, heat treatment, chaotropic salts, concentration of salt and protein structure perturbants was studied. The FTIR spectrum of rhEGF showed that major sec-ondary structures from amide I bands composed of 40.6% β-sheets, 25.0% reverse turns, 16.5% random coils, 13.0% loops and 4.9% side-chain structures. At extreme pH conditions (pH < 4 and pH > 8), there were changes in intensity of the bands attributed to loop (1658 cm-1) and random coil structures, and these bands shifted to lower wavenumbers, indicating
changes in protein conformation. Thermal denaturation of rhEGF occurred at 40-76 ºC and the formation of intermolecular β-aggregates was revealed by the FTIR spectra. Thermal-irreversible property of rhEGF after second-heating treatment suggested that rhEGF has a poor thermal stability. While investigating the stability of rhEGF in the presence of chaotropic salts, anions induced protein unfolding of rhEGF more significantly than cations. The optimal stabilizing effect was found at the 2 M NaCl added to rhEGF, and expressed the structure of rhEGF more stable on the many components. The bands of loop structure (1654 cm-1), β-sheet (1638 cm-1) and intermolecular antiparallel β-aggregation formation (1694,
1619 and 1612 cm-1) seem to be “marked” to be more sensitive in determining
environ-mental changes of rhEGF for FTIR microspectroscopy.
Key words: Recombinant human epidermal growth factor; FTIR microspectroscopy; Protein aggregation; Thermodynamics; Preformulation.
Introduction
Epidermal growth factor (EGF) is a single-chain polypeptide of 53 amino acid residues (Mw= 6045) and contains three intramolecular disulfide bridges that are required for biological activity (1). It has been well-recognized that EGF stimu-lates initiation of DNA synthesis, cell replication, activation of RNA and protein synthesis (2). In addition, EGF can enhance the proliferation and keratinization of epithelial tissues (3, 4), inhibit gastric acid secretion in stomach (5), and accelerate wound healing (6, 7), On the other hand, based on its biological activity, several approaches are in progress to develop pharmaceutical formulations that allow administration of EGF effectively, including addition of protease inhibitors, modi-fications in chemical structure or formulation design. For example, ointment (8), gel (9, 10), microsphere (11), and microemulsion (12) are employed in the drug delivery systems. Since Komorya and co-workers first reported that the B-loop fragment of EGF is the specific binding site and plays an important role on bio-logical activity, the research of modern scientists has thrown new light on the sub-ject (13). Thus, in order to develop these products successfully, it must be consid-ered whether the integral loop structures of EGF that were related to these
activi-Journal of Biomolecular Structure & Dynamics, ISSN 0739-1102 Volume 22, Issue Number 1, (2004) ©Adenine Press (2004)
Chih-Hui Yang
Pao-Chu Wu
Yaw-Bin Huang
Yi-Hung Tsai
* Graduate Institute of Pharmaceutical Sciences Kaohsiung Medical University No. 100 Shih-Chuan 1st Road Kaohsiung 807 Taiwan, R.O.C.101
*Phone: 886-7-3121101 ext. 2261 Fax: 886-7-3210683 Email: [email protected]ties are still exhibited after being manufactured. Furthermore, the physicochemi-cal and biologiphysicochemi-cal characteristics of EGF in the formulation and changes in the con-dition that occur over a period of time must be evaluated.
There are a number of specific biophysical techniques published in the literature for analysis of EGF. These assays include NMR (14-16), X-ray crystallography (17), electronic circular dichroism (E-CD) (18), and infrared (IR) spectroscopy (19). However, there still exists some drawbacks such as a costly high-field NMR require-ment, time consuming, sample difficulty to be crystalline and low signal-to-noise ratios for NMR, X-ray, E-CD and IR, respectively. Thus, it is necessary to develop a more practical and efficient method for determination of the conformation changes of EGF. Since Susi, H. et al. applied FTIR as a novel technology for determination of the global secondary structure proteins in 1985, it has been widely and rapidly applied in biochemistry for the examination of conformational changes of protein in many aspects (20). FTIR spectroscopy has become a powerful, sensitive and valu-able tool for monitoring conformation changes of proteins under different conditions (21, 22). FTIR is versatile and thereby has distinct advantages over other tech-niques, in that it can be used to investigate the changes of protein structure in many states such as aqueous solution, semisolid, solid, gel and biological fluid. Moreover, it can be used to investigate protein structure changes during aggregation/gelation in
situ. To the best of our knowledge, no one has applied FTIR technology to study the
stability of EGF. Herein we now apply a novel technology on FTIR microspec-troscopy assay as a developmental tool in stability evaluation of rhEGF under the influence of various environmental conditions including: pHs, heat treatment, chaotropic salts, concentration of salt and protein structure perturbants.
Materials and Methods
Materials
Recombinant human EGF was purchased from Sigma Chem. Co. (St. Louis, MO, USA). All other reagents used are commercially available and were of the highest grade.
Sample Preparation
In order to evaluate the effect of pH on spectral characteristics of rhEGF, the 0.1% rhEGF solutions with desired pH (pH 2.2, 3.0, 4.0, 5.0, 6.0, 7.2, 8.0, 9.0 and 10.0) were prepared by McIlvaine buffer solutions at room temperature. The protein mixtures were stirred for an hour at room temperature to allow the pH to equilibrate and produce a complete effect. The different amount of protein structure pertur-bants (sodium dodecyl sulfate, dithiothreitol, tritonX-100 and dithiothreitol) and chaotropic salts (potassium chloride, bromide, iodide and sodium chloride) were added to the rhEGF dispersions to give the required concentration. For infrared spectroscopic analysis, 10 µl of rhEGF mixtures (0.1% w/v) were allowed to dry on a CaF2window with 13 mm of diameter as reported previously (23). The spec-tra of the buffer dried were used as background.
To study the thermal effect on the characteristics of rhEGF, the heating experiment was conducted with a microscopic FTIR/DSC temperature controller (PerKin-Elmer, USA) and the IR spectra were recorded at increasing time periods. 10 µl of rhEGF solution (0.1% w/v) was dropped onto the platinum sample pan.
FT-IR Microscopic Studies
FTIR spectra of rhEGF were collected using a PerKin-Elmer (Norwalk, CT, USA) System 2000 FTIR spectrometer equipped with a germanium on KBr bcamsplitter and both room temperature deuterated triglycine sulfate (DTGS), and liquid nitrogen-cooled mercury-cadmium-telluride (MCT) detectors using transmission technique.
102
This spectrometer is attached to a PerKin-Elmer infrared microscope that has its own small element MCT detector. Samples of rhEGF were measured as thin film on a CaF2window. All spectra were examined in 256 scans with a resolution of 4 cm-1at
ambient temperature (25 ºC). Each protein sample was measured at least three times and averaged to produce a signal spectrum for subsequent data process. For micro-scopic FTIR/DSC spectromicro-scopic studies, dried film samples of rhEGF were coated on the sample pan and placed into the DSC temperature-controlled sample holder. This DSC sample holder was then set in the microscopic FTIR spectrometer (FTIR Spectrum GX, PerKin-Elmer Co., USA) equipped with an MCT detector. The rate of heating for the DSC was set at 3 ºC/min in ambient conditions and then heated from 20 to 120 ºC for first- and second-heating processes. The DSC heating calen-dar and IR spectra could be recorded at the same time. Each spectrum obtained in the experiment was carried out at 16 scans and with a resolution of 4 cm-1.
FTIR Data Analyses
The data acquisition and handling was analyzed and recorded using the Infrared Data Manager software (PerKin-Elmer, USA). Second-derivative spectral analysis and Fourier self-deconvolution were applied to establish the position of the over-lapping components of the amide I band and assign them to different secondary structures. The quantitative contribution of each band to the total amide I region were determined by Gaussian curve-fitting performed using the program GRAMS/32 AI 6.00 from Galactic Industries (USA). The fitting adjustment was achieved until the synthetic curve matched the experimental one with a precision factor of ≤ 1%. The percentage of a component was computed to be the fractional area of the corresponding peak, divided by the sum of the areas of all the peaks. Results and Discussion
Spectral Assignment of rhEGF
Figure 1 shows the typical spectrum of rhEGF in the amide I (1700-1600 cm-1)
band (A), Fourier self-deconvoluted spectra (B) and its second derivative (C). In this region, which is mainly due to the C=O stretching vibration and to a small extent to C-N stretching vibration of the peptide bond, the band is sensitive to the secondary structure of protein. Figure 1A shows a maximum near 1645 cm-1with
shoulders obvious near 1654 and 1638 cm-1. Figure 1B and C show additional
bands near 1684, 1677, 1666, 1660, 1654, 1645, 1638, 1632, 1624, and 1613 cm -1. Furthermore, the assignments of components shown in the amide I band for
rhEGF are as follows: the bands at 1677, 1638, 1632, 1624 and 1613 cm-1 are
assigned to the β-sheets; the bands at 1684, 1666 and 1660 cm-1 are due to the
reverse turns; the band at 1654 cm-1is associated to the loop structure; the band at
1645 cm-1is assigned to the random coil structure (19).
103
Stability of RhEGF by FTIR
Wavenumber (cm-1) 1600 1700 Absorbance a b c 1613 1645 1654 1624 1632 1684 1677 1666 1660 1638
Figure 1: The typical (A) original infrared spectrum,
(B) Fourier self-deconvoluted spectra, and (C) the sec-ond derivative of rhEGF in amide I region in H2O.
The quantitative contribution of each band to the total amide I region was deter-mined by Gaussian curve-fitting (Figure 2), and summarized in Table I. These results suggested that native rhEGF contains β-sheets (40.61%), reverse turns (24.95%), random coils (16.49%), and loops structures (13.02%).
Effect of pH
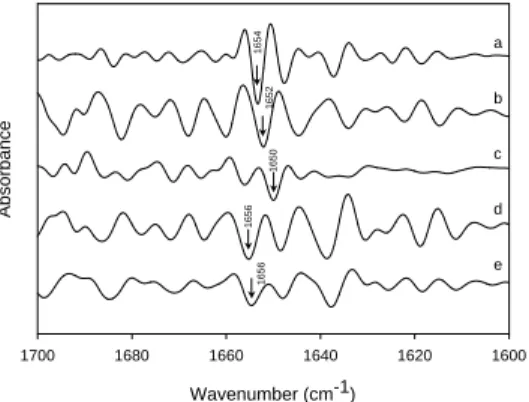
The degree of protonation of the various side chain groups can reflect the stability of the native protein structure. Consequently, pH-dependent conformational changes can be a sign of differences in interchain interactions due to changes in the ionization state of individual amino acid side-chains (24). In this study, the pH induced the change of wavenumber of the amide I band in the original infrared spectra of rhEGF in Figure 3. The rhEGF exhibits a native form at pH 7 and a reversible transition at pH 4; thereby, it can be attributed that the isoelectric pH range of rhEGF is about 4.6 (25). However, individual peaks for these vibrational transitions are severely overlapped in FTIR spectra. In order to get a complete structural analysis, the comparisons of the second derivative spectra in the amide I region between the ranges of pH 2.2-9 were made and are shown in Figure 4. In the buffer system, the bands shifted to higher wavenumbers. At pH 4-7, the spec-tra of rhEGF exhibited greater intensity in the 1630-1660 cm-1region than that of
at highly acid and alkaline pH values. The higher intensity of loop structure (1658 cm-1) was observed especially in pH 7.2 and thus indicated that it exists in the
sta-ble conformation condition. In addition, the loops (1658 cm-1) and random coil
104
Yang et al.
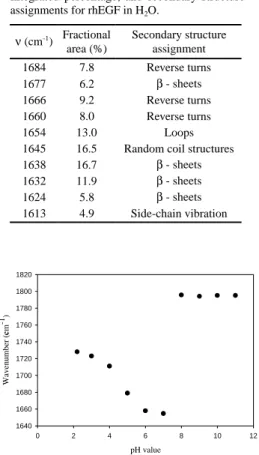
Table I
Amide I component band positions, relative integrated percentage, and secondary structure assignments for rhEGF in H2O.
ν (cm-1 ) Fractional area (%) Secondary structure assignment 1684 7.8 Reverse turns 1677 6.2 β - sheets 1666 9.2 Reverse turns 1660 8.0 Reverse turns 1654 13.0 Loops 1645 16.5 Random coil structures 1638 16.7 β - sheets 1632 11.9 β - sheets 1624 5.8 β - sheets 1613 4.9 Side-chain vibration
Figure 2: Resolution-enhanced amide I
band profile in the spectrum of rhEGF in H2O with the curve-fitted individual
Gaussian components. pH value 0 2 4 6 8 10 12 Wavenumber (cm -1) c 1640 1660 1680 1700 1720 1740 1760 1780 1800 1820
Figure 3: The pH-induced change of the wavenumber
from the Amide I region in the infrared of rhEGF as a function of pH. Wavenumber (cm-1) 1600 1700 Absorbance a d e f g h c b 1651 1658
Figure 4: Calculated second-derivative FTIR spectra of rhEGF in the amide I region between the range of pH 2.2-9. (a) pH 2.2; (b) pH 3.0; (c) pH 4.0; (d) pH 5.0; (e) pH 6.0; (f) pH 7.2; (g) pH 8.0; (h) pH 9.0.
structures (1651 cm-1) shifted to lower values (1656 and 1649 cm-1) from pH 2.2
to 9. The band near 1687 cm-1, assigned as intermolecular antiparallel β-sheets
stretching vibrations, increased in intensity at acidic pHs (pH 2.2 and 3), but no marked changes were observed at alkaline pHs. Moreover, except for the band of 1687 cm-1, the intensity of all the other bands progressively decrease in the both
alkaline and acidic pHs, suggesting a loss of secondary structure, perhaps due to a partial unfolding as the hydrogen bonds defining the structure are broken. The band of exposed β-strands shifts from 1622 to 1619 cm-1was also observed in acid
(pH 2.2-3) and alkaline (pH 8-9) states. Most proteins are stable over a specific pH range, normally near the isoelectric pH value, where repulsive forces are quite low and therefore the proteins remain in a native state. At higher or lower pH values, large net charges were induced and increased the repulsive forces, resulted in unfolding of proteins which might also be attributed to rupture of hydrogen bonds and a breakup of hydrophobic interaction (26, 27). When pH was under 8, all mol-ecules revealed a loss of signal with large precipitates visible in rhEGF sample. Thus the loss of signal might simply be triggered by precipitates rather than unfold-ing. However, rhEGF under the buffer condition below pH 4, the rhEGF sample appeared clear. So the loss of the signal could reflect unfolding.
According to the results, three positive evidences can be revealed. First, rhEGF presents a stable conformation between the pH ranges of 4-7.2, especially in pH 7.2. Extreme acids and alkaline pHs cause the unstable condition of rhEGF, main-ly unfolding, denaturation and aggregation. Second, the pH-induced chemical shifts of protons reflect sensitively the local conformational change of proteins that is accompanied by the change of the electrostatic properties of the proteins. Third, FTIR can effectively record the pH-induced conformation changes of rhEGF.
Effect of Heat Treatments
Three-dimensional plot of the transmission FTIR spectra of rhEGF within 3600-2800 and 1800-1000 cm-1, as a function of temperature, is shown in Figure 5. The
char-acteristic bands in the spectrum included the peak at 3290, 1645 and 1538 cm-1which
correspond to N-H stretching of amide A of protein, random coil structures of amide I, and amide II N-H bending as well as C-N stretching, respectively. In addition, the peaks between 1150 and 1264 cm-1correspond to amide III C-N stretching and N-H
bending vibration. The results showed that the peaks of the amide I (1645 cm-1) and
amide II (1538 cm-1) were shifted to 1652 and 1514 cm-1in the first heating process.
In order to explore whether the thermal denaturation is reversible, the temperature was cooled and the corresponding infrared spectra were recollected after heating to 120 ºC. Figure 6 presents the second-derivative FTIR spectra of rhEGF without buffer as a function of temperature within the heating and cooling process. The intensity of absorption bands at 1694, 1619 and 1612 cm-1, which were indicative
of an aggregated peptide aligned in intermolecular antiparallel β-aggregation con-formation, significantly increased when the temperature was higher than 40 ºC. In
105
Stability of RhEGF by FTIR
Figure 5: Three-dimensional plots of the transmission
FTIR spectra of rhEGF within 3600-2800 cm-1 and
addition, a rapid decrease intensity of loop structure and random coil bands (1654 and 1645 cm-1) and a corresponding increase was noted in the intensity of the β
-sheet structure band at 1638 cm-1 with increasing temperature. At 120 ºC, we
observed that the band of loop structure transferred to β-sheet structure. These observations suggest that the rhEGF is either aggregated in a very loose loop struc-ture, which allows contact to the protons, or that equilibrium exists between the aggregated and the unordered structures noticed in the spectrum. The FTIR data also revealed that thermal aggregation occurred at temperatures (over 100 ºC) well above that of protein denaturation, indicating that aggregation is preceded by ther-mal denaturation. In the cooling process, the incensement of β-sheet band (1638 cm-1) and formations of intermolecular β-aggregation (1694, 1619 and 1612 cm-1)
are still exhibited, suggesting that the thermal denaturation is irreversible. Moreover, the thermal-irreversible property of rhEGF after second-heating treat-ment was also observed, and thus suggests that rhEGF has a poor thermal stability. In order to interpret the thermal stability of rhEGF clearly, the maximum absorption value of the deconvoluted amide I band as a function of temperature and its deriva-tive curve are shown in Figure 7. It could be seen that rhEGF was quite stable below 30 ºC and began to unfold above 40 ºC. The transition midpoint Tmof rhEGF was at 55.5 ºC, and the complete denaturation of rhEGF might occur above 76 ºC.
For monomeric proteins, such as EGF, thermal aggregation is normally preceded by denaturation, following the scheme N↔D→A, where N denotes native tein, D, denatured molecule, and A, the aggregate (28). The heat stability of pro-teins is controlled by their balance of polar and nonpolar residues (29), with high-er heat stability (highhigh-er Td) of proteins having higher proportions of nonpolar residues. EGF is a typical soluble protein and does not contain an unusually high content of hydrophobic side chain (30). This could affirm the results that rhEGF has low denaturation temperature.
The characteristics of thermal effects of rhEGF could be emphasized from the results of FTIR. First, the irreversible thermal denaturation properties of rhEGF were revealed according to the formation the bands of β-sheet (1638 cm-1) and
106
Yang et al.
Wavenumber (cm-1) 1600 1700 1654 1645 1694 1694 1619 1612 1619 1612 1638 20°C 40°C 60°C 80°C 100°C Heating 120°C 100°C 80°C 60°C 40°C 20°C CoolingFigure 6: The second-derivative stacked FTIR spectra
of the amide I band of rhEGF in H2O as a function of
temperature between heating (20-120 ºC) and cooling (100-20 ºC) process. Temperature (oC) 20 40 60 80 100 120 -dA/dT B 41°C 55.5°C 76°C Temperature (oC) 20 40 60 80 100 120 Absorbance A
Figure 7: Thermal behavior of rhEGF as
measured for the amide I component band. Band intensities (A) and its derivative curve (B) are plotted as a function of temperature.
intermolecular β-aggregation (1694, 1619 and 1612 cm-1). Second, the
manufac-turing of rhEGF must be controlled below the unfolding point of 40 ºC since rhEGF has a poor thermal stability.
Effect of Chaotropic Salts
Salts were used as the buffer system in the fabrication process. Thus, a good choice of the buffer system could provide a useful purpose as not only a solvent but also an increasing stability. Chaotropic ions (those ions which favor the transfer of apo-lar groups to water) provide a highly effective means for the resolution of mem-branes and multicomponent enzymes and for increasing the water solubility of par-ticulate proteins and nonelectrolytes. The action of chaotropic agents is related to their effect on the structure and lipophilicity of water (31). Figure 8 shows the sec-ond-derivative spectra of rhEGF dispersions in 1.0 M salts. The band of loop struc-ture (1654 cm-1) markedly decreased and shifted to lower wavenumbers (1652 and
1651 cm-1) is shown in Figure 8b and c. There dramatically formed the two bands
of β-aggregated strands at 1691 and 1694 cm-1and that indicated the higher
sta-bility of rhEGF presented in sodium than potassium ion of the cations. By contrast, Figure 8c, d and e indicated to us the structure changes of rhEGF under the anions that the band of loop structure (1654 cm-1) progressively decreased and shifted to
lower wavenumbers (1651 and 1647 cm-1in KCl, KBr and KI). There were
fur-ther changes of the group of 1.0 M potassium iodide (Figure 8e) that we noticed about the β-sheet (1677 cm-1) and reverse turn (1666 cm-1) bands disappeared and
the band of β-aggregated strands near 1691 and 1694 cm-1collected into one big
band at 1690 cm-1. From the result, the structure changes of chaotropic effect on
rhEGF were mostly in anion rather than cation. The degree of change (protein unfolding) in 1.0 M potassium salts solution of rhEGF followed the order Cl-> Br -> I-according to the chaotropic or lyotropic series of anions (31).
Salts have been demonstrated to affect hydrophobic and electrostatic interactions of protein through a modification of water structure. In the lyotropic series, Cl-and Br-can promote salting-out and aggregation due to higher molar surface tension, which may stabilize protein conformation. In contrast, I- destabilizes anions because of their steric hindrance and higher hydration energy, which promote unfolding, dissociation and salting-in of proteins (32).
Thus, the phenomenon of chaotropic effects provided a way for us to choose the buffer system that was adapted to stabilizing the rhEGF formulations. As the chaotropic or lyotropic series of anions increased, the stability of rhEGF would be decreased.
Effect of Concentrations of Salt
The effect of NaCl concentration on second derivative spectra of rhEGF dispersions is shown in Figure 9. The peak of loop structure (1654 cm-1) shifted to lower
wavenumbers (1652 and 1650 cm-1) in the 0.5 and 1.0 M NaCl dispersion. In
con-trast, when the concentration of NaCl was above 1.0 M, the peak shifted to a high-er wavenumbhigh-er (1656 cm-1). The Gaussian curve-fitting results of each component
are displayed in Table II. At lower concentrations of NaCl, the intensity of side
107
Stability of RhEGF by FTIR
Wavenumber (cm-1) 1600 1620 1640 1660 1680 1700 Absorbance b d c a e 1654 1652 1650 1656 1656
Figure 9: Effects of salt concentrations on
second-derivative FTIR spectra of rhEGF. (a) control (no salt); (b) 0.5 M NaCl; (c) 1.0 M NaCl; (d) 2.0 M NaCl; (e) 3.0 M NaCl. Wavenumber (cm-1) 1600 1620 1640 1660 1680 1700 Absorbance a c d e b 1690 1654 1652 1651 1651 1647 1666 1677 1694 1691
Figure 8: Stacked plot of second-derivative FTIR spectra of rhEGF in the presence of 1.0 M chaotropic salts. (a) control; (b) NaCl; (c) KCl; (d) KBr; (e) KI.
Table II
The composition of secondary structure in rhEGF with different salt concentration by Gaussian curve-fitting.
NaCl
concentration Loop
Random coil
Reverse
turn β-sheets Side-chain Control 13.0 % 16.5 % 25.0 % 40.6 % 4.9 %
0.5M 11.9 % 14.3 % 30.4 % 29.2 % 14.2 % 1.0M 11.1 % 9.5 % 20.9 % 44.7 % 13.8 % 2.0M 14.4 % 13.4 % 30.7 % 37.3 % 4.2 % 3.0M 13.0 % 12.0 % 39.3 % 29.0 % 6.7 %
chain vibration bands increased dramatically, but no marked changes were observed at higher concentrations of NaCl. These observations suggested that the reorgani-zation of protein structure due to the electrostatic response or induction of alteration of water structure around the protein, enhanced the hydration of the protein mole-cules (33). On the other hand, at the concentrations of NaCl above 1.0 M, the sol-ubility of protein decreased, due to a “salting-out” phenomenon, which caused the aggregation or precipitation of protein molecules due to lack of water molecules in the competition between the protein and ions for water (26). The results demon-strate that the optimal stabilizing effect was found at the 2 M NaCl add to rhEGF.
Effect of Protein Structure Perturbants
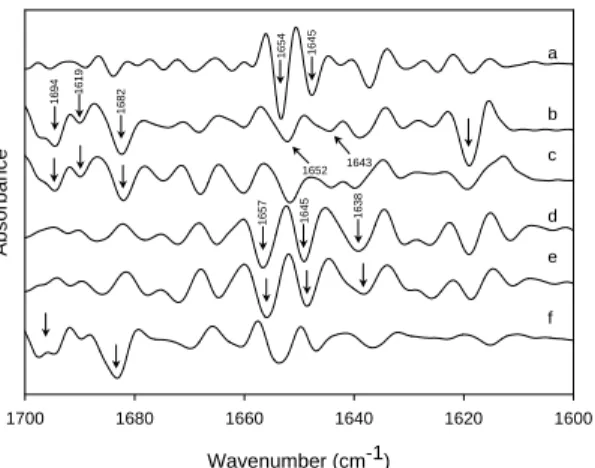
Structure perturbants are used in protein formulation studies to extract protein for quantitative analysis of encapsulation. The structure perturbants not only broke the outer membrane, but also caused the protein structure changes for calculating error percentage of encapsulation. The effects of protein structure perturbants including the denaturing agents sodium dodecyl sulfate (SDS) and TritonX-100, and the sulfhydryl reducing agents dithiothreitol (DTT) on the FTIR spectral characteristics of rhEGF are shown in Figure 10. In the presence of Triton X-100, the intensity of the loop structure and random coil bands (1654 and 1645 cm-1) significantly
decreased and shifted to 1652 and 1643 cm-1. As well, the band of exposed β-strands
(1619 cm-1) was found to increase in accordance to increasing the percentage of
Triton X-100, thus suggesting a reorganization of rhEGF structure. In addition, the intensity of reverse turn (1682 cm-1) and the formation of β-aggregation (1694 cm-1)
band were also observed. Although TritonX-100 is a nonionic detergent and widely used in biochemical applications to soluble proteins, it still should be considered to have an influence on rhEGF structure. In contrast, DTT caused the intensity of loop structure to slightly decrease, was accompanied by shifts of peak to higher wavenum-ber (from 1654 to 1657 cm-1), and increased the intensity of β-sheet (1638 cm-1) band
without the fraction change of DTT. DTT is a reducing agent, which can reduce the disulfide bond of cystinyl residues to sulfhydryl groups. Thus, DTT can break up disulfide linkages of the protein oligomers to form a destabilized conformation (32). rhEGF in the presence of SDS, obviously decreased in the loop structure band and increased the reverse turn (1682 cm-1) and β-aggregation (1694 cm-1) bands were
observed. Furthermore, the bands of the β-sheet (1677 cm-1) and reverse turn (1666
cm-1) connected together and decreased in intensity, suggesting that rhEGF
under-went unfolding. SDS is an anionic detergent, which interacts with the hydrophobic regions of protein molecules through its dodecyl hydrocarbon chain, leading to ionic repulsion, destabilization and unfolding of polypeptides (34).
Structure perturbants not only broke the formulation but also caused some structure damage of the rhEGF from FTIR results. Furthermore, it should necessarily be considered in calculating error percentage of encapsulation via the structure changes of rhEGF caused by the protein structure perturbants induced.
108
Yang et al.
Wavenumber (cm-1) 1600 1620 1640 1660 1680 1700 Absorbance b d e f a c 1645 1643 1652 1654 1694 1682 1657 1645 1638 1619Figure 10: Effects of protein structure perturbants on second-derivative FTIR spectra of rhEGF. (a) control (no perturbant); (b) 1% Triton X-100; (c) 3% Triton X-100; (d) 10 mM DDT; (e) 25 mM DDT; (f) 10 mM SDS.
Conclusion
In this work we demonstrate the effectiveness of FTIR microspectroscopy in con-formation changes of rhEGF prepared from various environmental factors. The major evidences could be supported our hypothesis as the following: (i) the effect of FTIR Spectroscopy on rhEGF needed not only a few samples but also a very low concentrated sample of rhEGF; (ii) the convenience of thermal FTIR microspectroscopy on rhEGF provided a real-time recording of thermal-induced structure changes in situ; (iii) the bands of loop structure (1654 cm-1), β-sheet
(1638 cm-1) and intermolecular antiparallel β-aggregation formation (1694, 1619
and 1612 cm-1) were sensitive to the FTIR monitoring. These changes were found
at the evaluation of pH, heat treatment, chaotropic salts, concentration of salt, and protein structure perturbants to rhEGF.
As a potential cytokine element, rhEGF will be subjected to various processing conditions during pharmaceutical manufacturing, leading to conformational and structural changes in the protein. It is essential to monitor these changes because they could be either beneficial or detrimental in terms of the active or functional properties of the processed pharmaceutical systems. As demonstrated by the advantages of FTIR spectroscopy listed in this study, it should be a valuable ana-lytical tool for monitoring the structural changes in rhEGF during processing. Acknowledgements
This work was supported by the National Science Council of Taiwan (NSC- 90-2314-B-037-027).
References and Footnotes
109
Stability of RhEGF by FTIR
1. 2. 3. 4. 5. 6. 7. 8. 9. 10. 11. 12. 13. 14. 15. 16. 17. 18. 19. 20. 21. 22. 23. 24.
Carpenter, G., Cohen, S. Annu. Rev. Biochem. 48, 193-216 (1979). Cohen, S. Cancer 51, 1787-91 (1983).
Brown, G. L., Schultz, G., Brightwell, J. R., Tobin, G. R. Surg. Forum. 35, 565-567 (1984). Brown, G. L., Curtsinger, L., Brightwell, J. R., Ackerman, D. M., Tobin, G. R., Polk, H. C., George-Nascimento, C., Valenzuela, P., Schultz, G. S. J. Exp. Med. 163, 1319-1324 (1986). Bower, J. M., Camble, R., Gregory, H., Gerring, E. L., Willshire, I. R. Experientia. 31, 825-826 (1975).
Brown, G. L., Nanney, L. B., Griffen, J., Cramer, A. B., Yancey, J. M., Curtsinger, I. L., Holtzin, L., Schultz, G. S., Jurkiewicz, M. J., Lynch, J. B. N. Engl. J. Med. 321, 76-79 (1989). Lee, A. R. C., Suzuki, Y., Jung, K. H., Nishigaki, J., Hamai, Y., Shigematsu, A. Proceedings
of the Controlled Release Society 23, 325-326 (1996).
Chvapil, M., Gaines, J. A., Gilman, T. J. Burn Care Rehabil. 9, 279-284 (1988). DiBiase, M. D., Rhodes, C. T. Drug Dev. Ind. Pharm. 22, 823-831 (1996).
Sheardown, H., Clark, H., Wedge, C., Apel, R., Rootman, D., Cheng, Y. L. Curr. Eye Res.
16, 183-190 (1997).
Han, K., Lee, K. D., Gao, Z. G., Park, J. S. J. Control Release 75, 259-269 (2001). Celebi, N., Turkyilmaz, A., Gonul, B., Ozogul, C. J. Control Release 83, 197-210 (2002). Komoriya, A., Hortsch, M., Meyers, C., Smith, M., Kanety, H., Schlessinger, J. Proc. Natl.
Acad. Sci. USA 81, 1351-1355 (1984).
Cooke, R. M., Wilkinson, A. J., Baron, M., Pastore, A., Tappin, M. J., Campbell, I. D., Gregory, H., Sheard, B. Nature 327, 339-341 (1987).
Carver, J. A., Cooke, R. M., Esposito, G., Campbell, I. D., Gregory, H., Sheard, B. FEBS
Lett. 205, 77-81 (1986).
Hommel, U., Harvey, T. S., Driscoll, P. C., Campbell, I. D. J. Mol. Biol. 227, 271-282 (1992). Higuchi, Y., Morimoto, Y., Horinaka, A., Yasuoka, N. J. Biochem. 103, 905-906 (1988). Narhi, L. O., Arakawa, T., McGinley, M. D., Rohde, M. F., Westcott, K. R. Int. J. Pept.
Protein Res. 39, 182-187 (1992).
Prestrelski, S. J., Arakawa, T., Wu, C. S., O’Neal, K. D., Westcott, K. R., Narhi, L. O. J. Biol.
Chem. 267, 319-322 (1992).
Susi, H., Byler, D. M., Purcell, J. M. J. Biochem. Biophys. Methods 11, 235-40 (1985). Jiang, H., Song, Z., Ling, M., Yang, S., Du, Z. Biochim. Biophys. Acta. 1294, 121-128 (1996). Bouchard, M., Zurdo, J., Nettleton, E. J., Dobson, C. M., Robinson, C. V. Protein Sci. 9, 1960-1967 (2000).
Ruckebusch, C., Nedjar-Arroume, N., Magazzeni, S., Huvenne, J. P., Legrand, P. J. Mol.
Struct. 478, 185-191 (1999).
110
Yang et al.
25. 26. 27. 28. 29. 30. 31. 32. 33. 34.Matrisian, L. M., Planck, S. R., Magun, B. E. J. Biol. Chem. 259, 3047-52 (1984). Morrissey, P. A. M., O’Neill, D. M. In Development in Food Proteins, Vol. 5, pp. 195-256. Ed., Hudson, B. J. F. Elsevier Applied Science: London, U.K. (1987).
Privalov, P. L., Khechinashvili, N. N. J. Mol. Biol. 86, 665-84 (1974).
Lemmon, M. A., Bu, Z., Ladbury, J., Zhou, M., Pinchasi, D., Lax, I., Engelman, D. M., Schlessinger, J. EMBO J. 16, 281-294 (1997).
Bigelow, C. C. J. Theor. Biol. 16, 187-211 (1967).
Holladay, L. A., Savage, C. R., Jr., Cohen, S., Puett, D. Biochemistry 15, 2624-33 (1976). Hatefi, Y., Hanstein, W. G. Proc. Natl. Acad. Sci. USA 62, 1129-1136 (1969).
Meng, G. T., Ma, C. Y. Food Chem. 73, 453-460 (2001). Arakawa, T., Timasheff, S. N. Biochemistry 21, 6545-52 (1982).
Steinhardt, J. Protein-ligand Interaction, pp. 412-426. de Gruyter: Berlin, Germany (1975).
Date Received: September 24, 2003