of the 1999 Taiwan Earthquake on Mortality
CHANG-CHUAN CHAN,
SCD, YI-PING LIN,
MS, CAGS, HSIU-HSI CHEN,
PHD,
TA-YUAN CHANG,
MS, TSUN-JEN CHENG,
MD, SCD, AND LI-SHENG CHEN,
MSPURPOSE: To investigate the patterns of immediate seismic deaths and post-earthquake mortality changes in the disaster area after the September 21, 1999 Taiwan earthquake.
METHODS: We used the data of 1,826 seismic deaths to elucidate the immediate seismic effects on mortality patterns, and to determine the association between seismic death rates and house damage among 23 townships in the disaster area. We used standardized mortality ratios (SMRs) to estimate the changes in mortality of all natural causes (ICD-9: 1–799) in the 12 months after the earthquake.
RESULTS: For the 1,826 seismic deaths, two leading causes of death were asphyxiation and intracranial injury and the death rates were higher among the female and elderly population. Township-specific seismic death rates were proportional to the proportion of completely collapsed houses. SMRs decreased six months after the earthquake for all residents and female adults aged 45 years and over.
CONCLUSIONS: The immediate effects of the Taiwan earthquake included a higher proportion of female and elderly seismic deaths and an association between seismic death rates and earthquake damages in the disaster area. The prolonged effect of the earthquake on mortality in the post-earthquake year was a decrease in mortality for all residents except male adults.
Ann Epidemiol 2003;13:502–508. 쑕 2003 Elsevier Inc. All rights reserved.
KEY WORDS: Earthquake, Mortality, Damage, SMR, Natural Disaster.
INTRODUCTION
At 0147 hours on September 21, 1999, a powerful earth-quake of magnitude 7.3 on the Richter scale (moment magnitude (Mw)⫽ 7.6) (1)struck central Taiwan. In the ensuing five days, thousands of aftershocks with several greater than 6.0 on the Richter scale were felt (1). Ac-cording to the mortality data from the Taiwan Department of Health, a total of 2,347 deaths were attributable to acute physical injury, fall, or being trapped by objects dislodged during the tremors of the first quake and the following after-shocks of the September 21, 1999 earthquake. Judging by its scale and the total number of deaths, it is believed to be the worst earthquake in 20th century Taiwan.
Previous epidemiologic studies on earthquake-related mortality had identified good associations between seismic deaths and housing structures in earthquakes (2–9). The long-term effects of an earthquake on mortality attributed to natural causes and cardiovascular disease had also been
From the Institute of Occupational Medicine and Industrial Hygiene (C.-C.C., T.-Y.C., T.-J.C.); Institute of Health Policy and Management (Y.-P.L.); and Institute of Preventive Medicine, College of Public Health, National Taiwan University, Taipei, Taiwan 100 (H.-H.C., L.-S.C.).
Address correspondence and reprint requests to: Dr. Chang-Chuan Chan, Rm. 1447, No.1, 1stSec., Jen-ai Rd., Taipei, Taiwan 100. Tel.:⫹886 2 2322 2362, Fax:⫹886 2 2322 2362. E-mail:[email protected]
Received May 28, 2002; accepted January 22, 2003.
쑕 2003 Elsevier Inc. All rights reserved. 1047-2797/03/$–see front matter
360 Park Avenue South, New York, NY 10010 doi:10.1016/S1047-2797(03)00040-1
reported(10–13). The demographic patterns of mortality due to the immediate or prolonged effects of earthquakes, however, were inconsistent in previous studies.
For the immediate effects of earthquakes on mortality, higher age-specific mortality rates for the elderly were re-ported in Japan (7, 9)and the US (3). Seismic mortality rates were higher for the young and the elderly in Guatemala (5). Females were reported to have higher seismic mortality rate in a Japanese study (7). As for the deaths from all causes and from heart disease following the 1988 earthquake in Armenia, unadjusted death rates increased with age and were higher among males(10).
In this study, we analyzed the immediate effects of the 1999 Taiwan earthquake on mortality by identifying the timing, location, and causes of seismic deaths in the earth-quake. The demographic patterns of seismic deaths were revealed by age and gender-specific mortality. We also ex-tended our follow-up observation on mortality for one year after the earthquake to investigate the prolonged effects of earthquakes on deaths by natural causes.
METHODS Mortality Data
Our study focused on the analysis of computerized mortality data and population statistics from the disaster area between
Selected Abbreviations and Acronyms ICD-9⫽ International Classification of Diseases, Ninth Revision SMR⫽ standardized mortality ratio
SE⫽ standard error
1996 and 2000 and corresponding structural damage dataat-tributed to the September 21, 1999 earthquake. The disaster area included 23 townships in the Nantou County (all of its 13 townships) and the Taichung County (10 out of 21 townships) and a 1999 mid-year population of 1,388,741. We obtained data on earthquake damage from the Taiwan Na-tional Fire Administration. The degree of housing damage (completely collapsed or partially collapsed) was defined and measured by the local governments in Taiwan shortly after the earthquake. Three administrative levels–the town-ship, the county, and the central government–performed thorough damage assessment on houses in the disaster area after the earthquake. Completely collapsed houses were de-fined as those that had to be torn down and rebuilt for future occupancy. Partially collapsed houses were those that needed to be repaired for continuing occupancy. The degree of housing damage was used in many publicly and privately funded post-earthquake welfare programs after the 1999 Taiwan earthquake.
The computerized mortality data were obtained from the Taiwan Department of Health. The data included date of birth, gender, time and date of death, and cause of death coded by the International Classification of Diseases, Ninth Revision (ICD-9). The accuracy of cause-of-death coding in Taiwanese mortality data has been validated in a previous study(14). Even in the chaotic situation after the earthquake, special efforts were performed by the Taiwan Department of Health to confirm the accuracy of diagnosis and ICD coding of all seismic deaths by medical examin-ers. Seismic deaths were defined as deaths attributable to acute physical injury in the earthquake; heart attacks or stress-related events were excluded. We obtained population statistics between 1996 and 2000 from the Taiwan Ministry of the Interior to calculate mortality in this study.
To elucidate the immediate seismic effects on mortality, we collected and analyzed the mortality data attributed to the direct effect of the earthquake (ICD-9: E909) in the disaster area. There were a total of 1,862 seismic deaths in the 23 townships. The timing, cause of death and its gen-der distribution among these 1,862 seismic deaths were further explored. Ninety-two percent of these deaths (n⫽ 1,717) occurred on the day of the earthquake, with 99% (n⫽ 1,845) occurring within the month following the earthquake. We used sixteen 5-year age strata, ranging from 0–4 to 75⫹ years, to plot the age and gender-specific seismic
death rates. The age and gender-specific mortality of all-causes (ICD-9: 1–999) in the same time period (9/21–10/ 20) between 1996 and 1998 were also plotted as reference. We calculated township-specific crude death rates for each of the 23 townships in the disaster area. The severity of earthquake damage in each township was defined as the proportion of partially and/or completely collapsed houses among all registered houses. These township-specific data were used to determine whether seismic death rates were affected by the severity of housing damage in the disaster area.
To investigate the prolonged effects of the earthquake on mortality in the disaster area, we used monthly standardized mortality ratios (SMRs) to diagnose post-earthquake mortal-ity changes. Twelve monthly SMRs (from October, 1999 to September, 2000) were calculated for deaths of all natural causes (ICD-9: 1–799). We used averaged monthly mor-tality between 1996 and 1998 and mid-year populations in 1999 or 2000 to calculate the expected monthly deaths for October to December of 1999 and January to September of 2000 in the post-earthquake period. The post-earthquake monthly SMRs were obtained by dividing observed by ex-pected deaths in each of the 12 months. The SMRs of all ages, adults over 45, and gender stratification were estimated to identify certain susceptible sub-populations in the post-earthquake months.
Statistical Analysis
We used a Poisson regression model with gender and county as main effects to investigate whether crude seismic death rates differed significantly by gender and county in the disas-ter area. We used another Poisson regression model with the impact of earthquake (before earthquake⫽ 0 and after earthquake⫽ 1) and gender (female ⫽ 0 and male ⫽ 1) as main effects, and an interaction term of gender*earthquake to further elucidate whether the gender pattern of mortality changed between 9/21/1999 and 10/20/1999 after the earth-quake. We also used Poisson regression to explore the associ-ation of township-specific crude seismic death rates and the severity of earthquake damage in the disaster area. We first built a full model with the proportions of both completely-and partially-collapsed houses in each of 23 townships as independent variables. We then constructed two sub-models with either the proportion of completely collapsed houses (sub-model 1) or the proportion of partially col-lapsed houses (sub-model 2) as an independent variable. The likelihood ratio tests were used to compare the full model with sub-models and the statistical significance level was set at 0.05. The genmod procedure of generalized linear model in SAS 8.1 version was used to perform Poisson regression modeling in this study.
RESULTS
Township-specific earthquake damage and the crude seismic death rates in the earthquake disaster area are presented in Table 1. Wide variations in earthquake damage and corresponding death rates are apparent. Among the 378,864 houses in the disaster area, 19.4% were designated as com-pletely collapsed and another 15.0% as partially collapsed after the earthquake. The proportion of completely col-lapsed houses ranged from⬍0.1% to 53.2% among the 23 townships. On average, the earthquake damage in Nantou County (23.1% of completely collapsed houses) was more severe than Taichung County (15.7% of completely col-lapsed houses). The range for the variation in the partially collapsed housing, however, is not as wide as that observed for the completely collapsed housing.
The crude seismic death rate was 134 per 10,000 in the entire disaster area. The crude seismic death rates varied from 5 to 1,060 per 10,000 among the 23 townships. The crude seismic death rates for females were 169 and 130 per 10,000 and 135 and 116 per 10,000 for males in Nantou and Taichung counties respectively. Nantou County (152
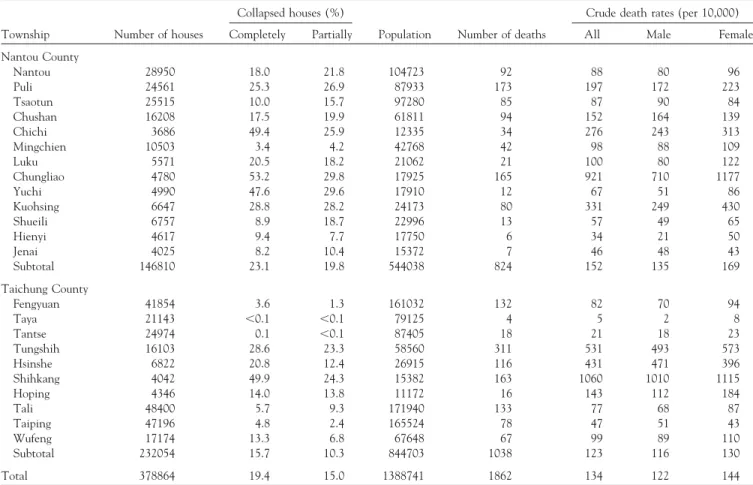
TABLE 1. Township-specific severity of housing damage and crude death rates for 1,862 seismic deaths in the disaster areaa
of the 1999 Taiwan earthquake
Collapsed houses (%) Crude death rates (per 10,000)
Township Number of houses Completely Partially Population Number of deaths All Male Female Nantou County Nantou 28950 18.0 21.8 104723 92 88 80 96 Puli 24561 25.3 26.9 87933 173 197 172 223 Tsaotun 25515 10.0 15.7 97280 85 87 90 84 Chushan 16208 17.5 19.9 61811 94 152 164 139 Chichi 3686 49.4 25.9 12335 34 276 243 313 Mingchien 10503 3.4 4.2 42768 42 98 88 109 Luku 5571 20.5 18.2 21062 21 100 80 122 Chungliao 4780 53.2 29.8 17925 165 921 710 1177 Yuchi 4990 47.6 29.6 17910 12 67 51 86 Kuohsing 6647 28.8 28.2 24173 80 331 249 430 Shueili 6757 8.9 18.7 22996 13 57 49 65 Hienyi 4617 9.4 7.7 17750 6 34 21 50 Jenai 4025 8.2 10.4 15372 7 46 48 43 Subtotal 146810 23.1 19.8 544038 824 152 135 169 Taichung County Fengyuan 41854 3.6 1.3 161032 132 82 70 94 Taya 21143 ⬍0.1 ⬍0.1 79125 4 5 2 8 Tantse 24974 0.1 ⬍0.1 87405 18 21 18 23 Tungshih 16103 28.6 23.3 58560 311 531 493 573 Hsinshe 6822 20.8 12.4 26915 116 431 471 396 Shihkang 4042 49.9 24.3 15382 163 1060 1010 1115 Hoping 4346 14.0 13.8 11172 16 143 112 184 Tali 48400 5.7 9.3 171940 133 77 68 87 Taiping 47196 4.8 2.4 165524 78 47 51 43 Wufeng 17174 13.3 6.8 67648 67 99 89 110 Subtotal 232054 15.7 10.3 844703 1038 123 116 130 Total 378864 19.4 15.0 1388741 1862 134 122 144
aThe disaster area included all 13 townships in Nantou County, and 10 out of 21 townships in Taichung County.
deaths per 10,000) had significantly higher crude seismic death rate than Taichung County (123 deaths per 10,000) by Poisson regression analysis (p⬍ 0.05). Females also had significantly higher crude seismic death rates than males in each county and in the entire disaster area.
In Table 2, we found township-specific crude seismic death rates was significantly associated with the proportion of completely collapsed houses (χ2⫽ 384.96, p ⬍ 0.001), but was not significantly associated with the proportion of partially collapsed houses (χ2⫽ 2.03, p ⫽ 0.213) among 23 townships in the disaster area. The results indicated that completely rather than partially collapsed houses had better prediction for crude seismic death rates during the 1999 Taiwan earthquake. The relative rate ratios were estimated at 1.05 (95% CI: 1.05–1.06) for the percentage of com-pletely collapsed houses, i.e. 1% increase in comcom-pletely col-lapsed houses would increase 5% crude seismic death rates in the disaster area.
Among the 1,862 seismic deaths, 1,441 (77%) were pro-nounced dead in their collapsed homes, 165 (9%) died on their way to referral hospitals, 136 (7%) died in the referral hospitals, and 130 (7%) died in the evacuation area or were
TABLE 2. The association between township-specific crude seismic death rates and the severity of earthquake damage in the disaster areaaby Poisson regression models
Likelihood Models Independent variables Estimate (SE)b ratio test Full model Completely collapsed 0.050 (0.003) —
houses
Partially collapsed 0.006 (0.004) — houses
Sub-model 1 Completely collapsed 0.053 (0.001) χ2(1)⫽ 384.96,
houses p⬍ 0.001
Sub-model 2 Partially collapsed 0.074 (0.003) χ2
(1)⫽ 2.03,
houses p⫽ 0.213
aThe disaster area included all 13 townships in Nantou County, and 10 out of 21
townships in Taichung County.
bSE⫽ standard error.
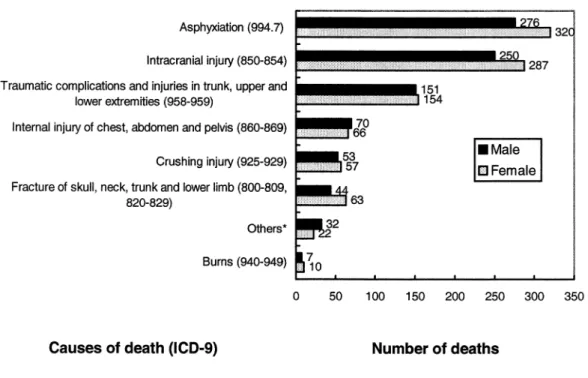
data missing. As shown inFigure 1, there were six major causes of deaths, coded by ICD-9, for the 1,862 seismic deaths in the disaster area–asphyxiation (32%), intracranial injury (29%), traumatic complications and injuries in trunk, upper and lower extremities (16%), internal injury of chest,
FIGURE 1. Major causes of death for the 1,862 seismic deaths (ICD-9: E909) in the disaster area. The disaster area included all 13 townships in Nantou County, and 10 out of 21 townships in Taichung County.
abdomen and pelvis (7%), crushing injury (6%), and frac-ture of skull, neck, trunk and lower limb (6%). These six major causes accounted for 81% of total seismic deaths in the disaster area. Burn-related deaths accounted for less than 1% of total seismic deaths in the 1999 Taiwan earthquake.
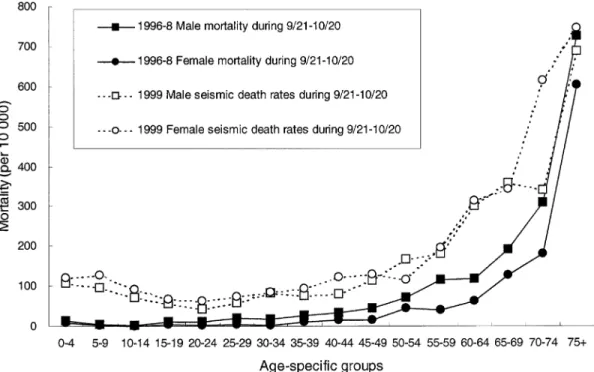
The age and gender distributions of seismic death rates in the first month (9/21–10/20, 1999) are illustrated in Figure 2. Seismic death rates in the first month of earthquake increased from young to the very old, as they were in the all-cause mortality in the same time period between 1996 and 1998. The ratio of seismic death rates was 3.3 between adults aged over 45 years and those aged less than 45 years. By contrast, the mortality ratio was 13.5 between adults aged over 45 years and those aged less than 45 years between 1996 and 1998. The gender pattern of seismic death rates, however, was different from that of the 1996 to 1998 all-causes mortality. In 1996 to 1998 all-all-causes mortality, males had higher mortality than females. By contrast, females had higher seismic death rates than males in the post-earthquake
FIGURE 2. Age and gender specific seismic death rates during 9/21–10/20, 1999, in the disaster area and the all-cause mortality in the same time period in 1996–98. The disaster area included all 13 townships in Nantou County, and 10 out of 21 townships in Taichung County.
month. The male/female rate ratios were 0.85 for seismic deaths in 1999, and 1.68 for all-causes deaths in 1996 to 1998. The change of gender pattern in mortality after the earthquake was significant by Poisson regression analysis (p⬍ 0.05).
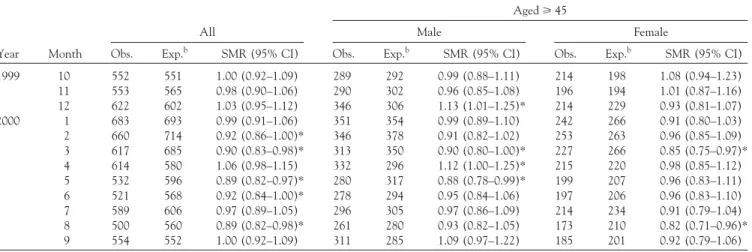
The post-earthquake changes in mortality of all natural causes in the disaster area are shown inTable 3. For residents of all ages in the disaster area, the SMRs had no significant changes for the first five post-earthquake months. However, the SMRs decreased significantly in the 6th, 8th, and 11th month after the earthquake. Stratified by age and gender, we found the SMRs decreased significantly in the 6th and 11thmonth for female adults aged over 45. By contrast, the SMRs increased significantly in the 3rdmonth but decreased significantly in the 8thmonth after the earthquake for male adults aged over 45.
DISCUSSION
The high percentages of asphyxiation, intracranial injury, and traumatic complications among seismic deaths in the Taiwan earthquake were possibly due to the failure in per-forming timely search-and-rescue efforts in collapsed build-ings. Typical dwellings in Taiwan are 2 to 4 floors high
with a pedestrian corridor and open space at the ground level. Many seismic victims in the 1999 Taiwan earthquake were trapped in the collapsed buildings with the disappear-ance of the ground floor(15). Furthermore, the disaster area of Nantou and Taichung counties was located in the remote and mountainous areas of Taiwan. After the earthquake, im-passable roads and disrupted communication systems posed further difficulties in carrying out rapid search-and-rescue efforts(16).
Contrary to what occurred in the 1995 Great Hansin-Awaji earthquake in Japan(7), mortality due to burns was comparatively low (⬍1%) in the 1999 Taiwan earthquake. This difference might be attributed to differences in the timing of the earthquake, and variation in materials used for buildings in Taiwan and Japan. The 1999 Taiwan earth-quake occurred around midnight when domestic fuel use was low. In addition, most buildings in Taiwan were masonry. By contrast, the 1995 Great Hansin-Awaji earthquake occurred in an area with a relatively large number of wooden buildings, and it happened in the early morning when domestic cooking and indoor heating was taking place in many households.
The fact that the seismic death rate was positively associ-ated with the percentage of completely collapsed houses in our study indicates the need to improve earthquake-resistance design of buildings in Taiwan. A control system based on semi-active stiffness and electromagnetic friction dampers is recommended to improve the safety of building
TABLE 3. Post-earthquake monthly SMRs of all-nature causes (ICD-9: 1–799) in the disaster areaaafter the 1999 Taiwan earthquake
Aged⭓ 45
All Male Female
Year Month Obs. Exp.b SMR (95% CI) Obs. Exp.b SMR (95% CI) Obs. Exp.b SMR (95% CI)
1999 10 552 551 1.00 (0.92–1.09) 289 292 0.99 (0.88–1.11) 214 198 1.08 (0.94–1.23) 11 553 565 0.98 (0.90–1.06) 290 302 0.96 (0.85–1.08) 196 194 1.01 (0.87–1.16) 12 622 602 1.03 (0.95–1.12) 346 306 1.13 (1.01–1.25)* 214 229 0.93 (0.81–1.07) 2000 1 683 693 0.99 (0.91–1.06) 351 354 0.99 (0.89–1.10) 242 266 0.91 (0.80–1.03) 2 660 714 0.92 (0.86–1.00)* 346 378 0.91 (0.82–1.02) 253 263 0.96 (0.85–1.09) 3 617 685 0.90 (0.83–0.98)* 313 350 0.90 (0.80–1.00)* 227 266 0.85 (0.75–0.97)* 4 614 580 1.06 (0.98–1.15) 332 296 1.12 (1.00–1.25)* 215 220 0.98 (0.85–1.12) 5 532 596 0.89 (0.82–0.97)* 280 317 0.88 (0.78–0.99)* 199 207 0.96 (0.83–1.11) 6 521 568 0.92 (0.84–1.00)* 278 294 0.95 (0.84–1.06) 197 206 0.96 (0.83–1.10) 7 589 606 0.97 (0.89–1.05) 296 305 0.97 (0.86–1.09) 214 234 0.91 (0.79–1.04) 8 500 560 0.89 (0.82–0.98)* 261 280 0.93 (0.82–1.05) 173 210 0.82 (0.71–0.96)* 9 554 552 1.00 (0.92–1.09) 311 285 1.09 (0.97–1.22) 185 201 0.92 (0.79–1.06)
aThe disaster area included all 13 townships in Nantou County, and 10 out of 21 townships in Taichung County.
bWe used averaged monthly mortality in 1996–1998 to calculate expected monthly deaths for October to December in 1999 (based on the 1999 mid-year populations), and
for January to September in 2000 (based on the 2000 mid-year populations). *Significant at P⬍ 0.05.
structures against near-field earthquakes, such as the North-ridge, the Great Hansin-Awaji, and the Taiwan earth-quakes(17).
The distribution of death rates by age resembles a “J” shape in our study, a finding that has been reported in many previous studies (5, 7, 9). Elderly people were the most vulnerable group in this earthquake. The fact that women had higher seismic death rates in most age groups in the earthquake was similar to the findings in Japan(7). The fact that earthquakes disproportionately afflicted elderly people and women worldwide indicates that we should provide specific preparedness measures for these vulnerable popula-tions in future earthquakes.
The increase of mortality from natural causes and heart disease 6 months after an earthquake has been reported in Armenia (10). In this study, the prolonged effects of the 1999 Taiwan earthquake on mortality in the disaster area were somewhat inconsistent. The post-earthquake mortality of natural causes increased only in males over 45 years of age in the third month after the earthquake. The mortality of natural causes actually decreased in the post-earthquake months for residents of all ages and females over 45 years of age.
To further explore the prolonged health effects of the 1999 Taiwan earthquake, we have set up a public health surveillance program in Taiwan to monitor the post-earthquake changes in mortality and morbidity. We have also established cohorts of public employees and survivors in Nantou County for long-term follow-up of earthquake-related health effects. We hope our current findings will be helpful in reducing the public health impacts of future earthquakes in Taiwan and in all other earthquake-prone areas in the world.
This study was sponsored by contracts awarded by the Department of Health, and the Nantou County, Taiwan.
REFERENCES
1. Lee JC, Chu HT, Angelier J, Chan YC, Hu JC, Lu CY, et al. Geometry and structure of northern surface ruptures of 1999 Mw = 7.6 Chi-Chi Taiwan Earthquake: influence from inherited fold belt structures. Journal of Structural Geology. 2002;24:173–192.
2. Baba S, Taniguchi H, Nambu S, Tsuboi S, Ishihara K, Osato S. The great Hanshin earthquake. Lancet. 1996;347:307–309.
3. Peek-Asa C, Kraus JF, Bourque LB, Vimalachandra D, Yu J, Abrams J. Fatal and hospitalized injuries resulting from the 1994 Northbridge earthquake. Int J Epidemiol. 1998;27:456–465.
4. Peek-Asa C, Ramirez MR, Shoaf K, Seligson H, Kraus JF. GIS mapping of earthquake-related deaths and hospital admissions from the 1994 North-ridge, California, earthquake. Ann Epidemiol. 2000;10:5–13.
5. Glass RI, Urrutia JJ, Sibony S, Smith H, Gracia B, Rizzo L. Earthquake injuries related to housing in a Guatemalan village: Aseismic construction techniques may diminish the toll of deaths and serious injuries. Science. 1977;197:638–643.
6. De Bruycker M, Greco D, Flechat M. The 1980 earthquake in Southern Italy – morbidity and mortality. Int J Epidemiol. 1985;14:113–117. 7. Tanida N. What happened to elderly people in the great Hanshin
earth-quake. BMJ. 1996;313:1133–1135.
8. Armenian HK, Melkonian A, Noji EK, Hovanesian AP. Deaths and injuries due to the earthquake in Armenia: A cohort approach. Int J Epidemiol. 1997;26:806–813.
9. Osaki Y, Minowa M. Factors associated with earthquake deaths in the great Hanshin-Awaji earthquake, 1995. Am J Epidemiol. 2001;153:153–156. 10. Armenian HK, Melkonian A, Hovanesian AP. Long-term mortality and
morbidity related to degree of damage following the 1988 earthquake in Armenia. Am J Epidemiol. 1998;148:1077–1084.
11. Ogawa K, Tsuji I, Shiono K, Hisamichi S. Increased acute myocardial infarction mortality following the 1995 Great Hanshin-Awaji earthquake in Japan. Int J Epidemiol. 2000;29:449–455.
12. Kario K, Ohashi T. Increased coronary heart disease mortality after the Hanshin-Awaji earthquake among the older community on Awaji Island. J Am Geriatr Soc. 1997;45:610–613.
13. Kario K. After a major earthquake stroke death occurs more frequently than coronary heart disease death in very old subjects. [Letter to the Editor] J Am Geriatr Soc. 1998;46:537–538.
14. Lu TH, Lee MC, Chou MC. Accuracy of cause-of-death coding in Taiwan: types of miscoding and effects on mortality statistics. Int J Epidemiol. 2000;29:336–343.
15. Xue Q. Need of performance-based earthquake engineering in Taiwan: a lesson from the ChiChi earthquake. Earthquake Eng Struc. 2000;29: 1609–1627.
16. Wen YS, Hsu CP, Lin TC, Yang DY, Wu TC. Chest injuries transferred to trauma centers after the 1999 Taiwan earthquake. Am J Emerg Med. 2000;18:825–827.
17. Yang JN, Agrawal AK. Semi-active hybrid control systems for nonlinear buildings against near-field earthquakes. Eng Struct. 2002;24:271–280.