t’o/ynw k,qradulion rrnd Sluhlilfy 57 ( l YY7) 26 l-268 0 lYY7 Elsevier Science Limited
ELSEVIER
Prmted in Northern Ireland All rights reserved PII: s0141-3910(97)00005-0 0141-3’) 10/97/$17.00
Thermal degradation behavior of polystyrene
blended with propyl ester phosphazene
Bar-Long Denq,” Wen-Yen Chiu,“* Leo-Wang Chen” & Ching-Yuan Lee” Cl Institute of Material Science and Engineering, National Taiwun University, Taipei, Taiwun, R.O.C. ” Chemical System Research Division, Chung Shan Institute of Science and Technology, Taoyuan, Taiwan, R.O.C.
(Received 9 October 1996: accepted 27 December 1996)
The thermal degradation behavior of polystyrene (PS) blended with propyl ester phosphazene (FR) was studied by thermogravimetric analysis (TGA) coupled with Fourier transform infrared spectroscopy (FTIR). The results showed that during thermal degradation the evolved gas product of polystyrene blends was similar to the gas product of pure PS. and that the thermal stability of polystyrene blends was slightly improved by the addition of FR. The major thermal degradation temperature and residual char yield of PS blends increased with increasing FR content. 0 1997 Elsevier Science Limited
1 INTRODUCTION
Polystyrene (PS) is a commonly used polymer and has many excellent properties, such as high electrical resistance, good mechanical properties and high workability under various processing conditions. However, since PS degrades easily at high temperatures, the use of additives to improve thermal stabilization and flame retardant properties is an area of great interest. Among the work in this area, interest in avoiding the generation of toxic and corrosive gases during thermal degradation of PS has led to the development of non-halogen additives as replace- ments for halogen flame retardants. Reghu- nadhan Nair et al. ’ reported that thermal stabilization of PS could be improved by phosphorylation only in the chain ends and chain middle. In addition, the thermal degradation behavior of polystyrene, including the mechanism and kinetics, was investigated by Guaita’ and McNeil1 et UP. They concluded that the thermal degradation of polystyrene was a single step process. The main volatile product was styrene monomer together with certain amounts of benzene and toluene, and a small cold-ring fraction that consisted of oligomer parts such as * To whom all correspondence should be addressed.
dimer, trimer, tetramer and pentamer. Audisio et al.” showed that some inorganic substances such as silica, alumina and zeolites could be regarded as additives and catalyzed degradation of polystyrene.
Phosphazenes, as flame retardants with high phosphorus and nitrogen content, have been incorporated into polymers by blending or through chemical modification. A large improve- ment in the thermal stability of rayon blended with phosphazene has been reported.” In order to investigate further the use of phosphazenes as inorganic retardants for thermal degradation in this article, the thermal degradation behavior of polystyrene blended with propyl ester phospha- zene is examined. The gas products and residual char yield are examined by thermogravimetric analysis (TGA) coupled with Fourier transform infrared spectrometry (FTIR), and kinetic analy- sis during thermal degradation of PS blends is also discussed.
2 EXPERIMENTAL
2.1 Preparation of polystyrene blended with propyl ester phosphazene
Samples were prepared from mixtures of poly- styrene (supplied by Chi Mei Industrial Co. Ltd,) 261
262 Bar-Long Denq et al.
and propyl ester phosphazene (supplied by the Chung Shan Institute of Science and Technology). Samples were blended in THF and prepared at room temperature by a solvent casting technique. The cast films were dried slowly in an oven at 106°C until the weight of the specimens remained unchanged. The physical properties of PS and propyl ester phosphazene are listed in Table 1
and the symbolic meanings of the formulation used in this study are shown in Table 2.
2.2 Measurement of phosphorus content
The phosphorus content of the PS blends was determined using a calorimeter” and the results are also listed in Table 2.
2.3 Thermal degradation behavior of PS blends The thermal degradation behavior of the PS blends was investigated using a Perkin-Elmer TGA7 thermogravimetric analysis (TGA) at various heating rates under nitrogen atmosphere. 2.J.1 Analysis of evolved gas product and residual char yield ,from thermal degradation of PS blends The gas products of PS blends at various temperatures were studied using a SEIKO SSC 5000 TGA coupled with BIO-RAD FTIR FIS-40 at a heating rate of 10”Clmin under nitrogen atmosphere. The resulting spectra were identified by visual analysis and by searching the spectral data bases. The residues at various temperatures in TGA were also investigated using BIO-RAD FTIR FTS-40.
3 RESULTS AND DISCUSSION 3.1 Thermal degradation of PS blends
Figure 1 and Table 3 represent weight loss versus temperature and the characteristics of various PS
blends at a heating rate of lO”C/min under nitrogen atmosphere. Figure 1 shows that the thermal degradation of FR occurs in three stages, 140-268°C 270-340°C and above 340°C. Gas discharge during the thermal degradation of FR and the FTIR spectrum at various times (or temperatures) during that gas discharge are shown in Figs 2(a) and 3(a), respectively. The FTIR spectra in Fig. 3(a) were very similar all the way through the thermal degradation process by visual analysis and a search of the spectral data bases led to the conclusion that the major gas product was propylene. The FTIR spectrum of the condensed phase of FR at various degrada- tion temperatures is shown in Fig. 4(a). Both the stretching and bending in the methyl and methylene groups at 2940, 2900, 2850 and 1478 cm-’ decreased with increasing temperature, as did the P=N bond at 1250 cm-‘, but the intensity at 1400 cm ’ due to the
i? -c-
bond’ increased with increasing temperature. This implies that the methyl and methylene groups of FR gradually disappear due to the formation of propylene gas. The P=N bond undergoes an isomerization reaction during the thermal degra- dation of FR as it seeks a more thermally stable structure. The thermal degradation and isomeri- zation mechanism of FR are proposed by Papkov et al.* and Maynard et al.’ as follows:
Hf -N-P-
The amount of propylene produced during the thermal degradation of FR in eqns (1) and (2) are calculated to be 23 and 23 wt%, respectively, but in fact from Fig. 1 the amount of propylene Table 1. Physical properties of materials
Moteri(fl Formula TJ’C)” Melt fiow index (gm/lO min) Remark
Polystyrene
;;
96 --c - X.0” PG-3.7
Propyl ester phosphazene
TiiI -c, /c-
~ 100 0 Cyclic/linear structure = 653 Cl < 0.1 %wt ” By ASTM Code D-1238. “Determined by DSC. ‘Viscosity> 10” Poise (25°C).
Thermal degradation behavior of polystyrene blended with propyl ester phosphazene 263
evolved during the thermal degradation of FR is
29 and 17 wt%. Therefore, the thermal degrada- tion of FR in stage 1 can be inferred to include eqn (1) and to partially include eqn (2). The reaction occurring in stage 2 can be inferred to mainly follow eqn (2).
As shown in Fig. 1, the thermal degradation of
PS, unlike FR, is a one stage reaction; the
temperature range of the thermal degradation is
between 285 and 450°C. This agrees with data
Table 2. Symbolic meaning and phosphorus content of blended samples
-__
Code Description” P(wt%)h P(wt%)i
PSOF PYFR = 10:0 0 < 0.01
PSlF PS/FR= 1O:l 2.01 1.92
PS2F PS/FR = 10:2 3.68 3.99
FR PSlFR = 0: 10 22.1 22.1
” By weight ratio. h Phosphorus content calculated from composition. ’ Phosphorus content by the calorimeter.
1.0
0.9
0 100 200 300 400 500 600 Temperature (“C)
Fig. 1. TGA thermogram of PS blends at a heating rate of lO”C/min under nitrogen atmosphere.
published by Grassie et d.‘” where the proposed
degradation mechanism included depolymeriza-
tion and intramolecular transfer. TGA/FTIR
results which detail the gas discharge with time and identify the gas evolved during the thermal
degradation of PS at various times are shown in
Figs 2(b) and 3(b). FTIR spectra show that the major gas products at 40.04 min were styrene, CY- methyl styrene or benzene mixtures. This was
determined by visual analysis and by searching
spectral data bases. This determination agreed
with the results of Guaita.2 The FTIR spectrum of
the condensed phase is similar to PS without
additives as shown in Fig. 4(b). From the FTIR spectra of evolved gas and residual yield, the
mechanism of thermal degradation of PS can be
deduced to be the result of competition between
a random chain scission which induces monomer
volatilization and an intramolecular transfer
reaction that produces oligomeric fragments and
low molecular substances. From Fig. 1 the
Heating rate p=lW’Clmin -FR
~--- PSOF
pstF
_._-._ ps*F
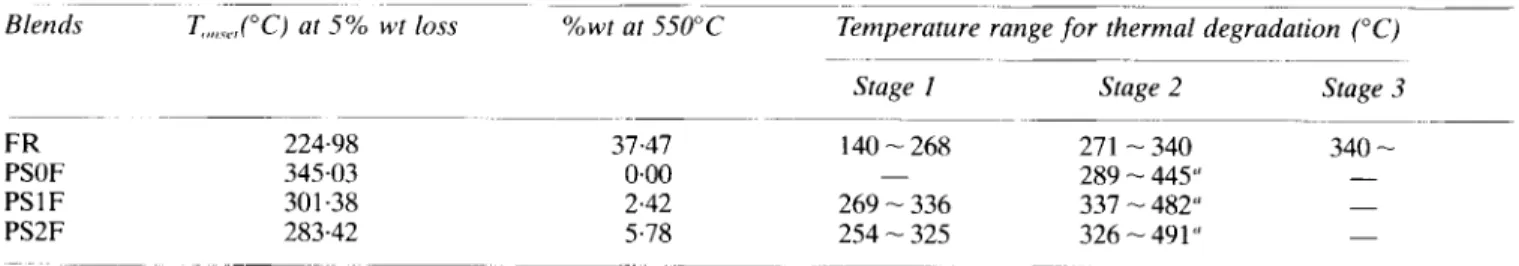
Table 3. Weight loss characteristics of various blends at a heating rate of 10”Clmin under nitrogen atmosphere Blends T,,,,,.,(“C) at 5% wt loss %wt at 550°C Temperature range for thermal degradation (“C)
FR 224.98 37,47
PSOF 34503 0.00
PSlF 301.38 2.42
PS2F 283.42 5.78
” Major degradation in polymer or polymer blends.
Stage I 140-268 269 - 336 254 - 325 Stage 2 271 - 340 289 - 445” 337 - 482” 326 - 491 Cl Stage 3 340 - -
264 Bar-Long Denq et al. (C) PS2F \ __l___-__!y/ \1________ (h) PSOF
__J
‘.
(a)
FR .._ _ _ _ _ -.- , I I I 0 10 20 Tkm3e(min) 40 50 I 60 I I I I I I I 25 100 200 300 400 500 600 Temperature (‘ClFig. 2. The gas discharge with time (temperature) for (a)FK. (b)PSOF and (c)PS2F in T(;A/FTIK.
thermal degradation of PS blended with FR shows a two stage pyrolysis. The weight loss of the first stage occurs from 250 to 330°C and is attributed to FR. The second stage is mainly attributed to PS. Following the above analytical method, the results of thermal degradation of PS blends are shown in Figs 2(c) and 3(c). The major evolved gases at 41.69 min are still benzene. styrene and a-methyl styrene mixture, similar to pure PS, but the relative content of each constituent is different. Propylene is not observed in the FTIR spectrum. The residual content of PS blends at 550°C increases with increasing content of FR. It is interesting that the degradation temperature at maximum weight loss rate for PS blends is delayed and that the maximum degradation rate is smaller, as shown in Fig. 5. A comparison of the FTIR spectra of residual yield of PS2F and PSOF, shown in Figs 4(c) and 4(b). shows that the intensity of the
OCH :
bands at 1600, 1500 and 1468 cm ’ becomes less defined in the presence of FR. The total evidence indicates a difference in the thermal degradation mechanism of PS and PS blends. One explanation for the result is that FR could act as an acid catalyst which reacts with the benzene rings of PS
and releases benzene from the PS chains. The mechanism proposed is as follows:“” ”
This explains the relative contents of benzene, styrene or a-methyl styrene in the evolved gas for PS and PS blends.
In order to examine the degree of interaction between PS and FR during the thermal dcgrada- tion of PS blends, a mixing rule. eqn (9) which assumed no interaction effect, was employed.
W,,,,,,,,(U = w, ,<(U .x, K + W,,s(V .x,3 (9) where
W,,,,,,,,( 7’): residual weight fraction of PS blend at any temperature
W,,<(T): residual weight fraction ol‘ FK at an? temperature
W,,,( 7‘ ): residual weight fraction ol PS at an> temperature
X, ,?: weight fraction of FR in blends X,,,: weight fraction of PS in blends.
A comparison of the experimental results and the result calculated from the mixing rule is shown in Fig. 5. The thermal degradation rate
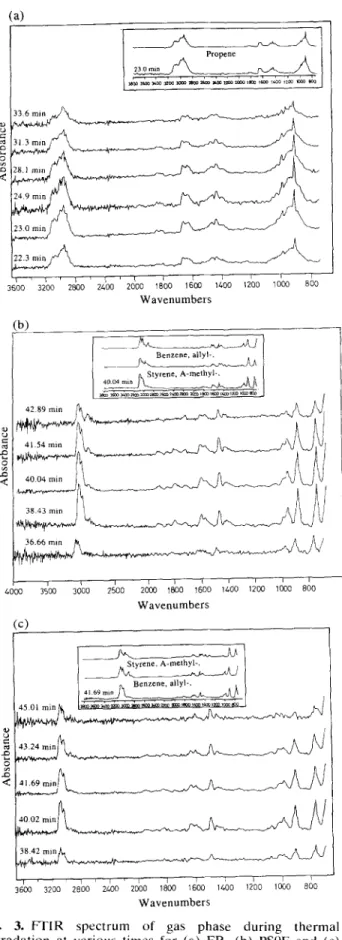
Thermal degradation behavior of polystyrene blended with propyl ester phosphazene 265 Wavenumbers b) 36.66 ml," 1A-h I ! I / / t II 1 ' 0 3500 3000 2500 2cm ,800 ,600 1400 1200 ICOC 800 Wavenumbers “v
JWJ
I, , I 1 / / I 3600 3200 2800 2400 2000 lmc 16cQ ILOO 1200 loci0 800 WavenumbersFig. 3. FTIR spectrum of gas phase during thermal degradation at various times for (a) FR. (b) PSOF and (c)
PS2F.
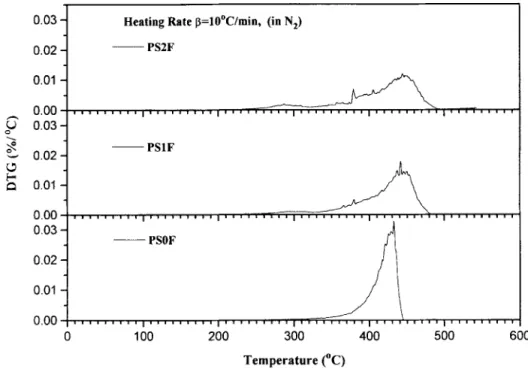
calculated from the mixing rule was slower than the experimental results before (DTG),;,,, and faster than experimental results after (DTG),,,,,, as shown in Fig. 6. Incorporation of FR in the PS polymer chains accelerated the breakage of polymeric chains in the early stage of thermal degradation as mentioned above, probably form- ing some stable structures and hence retarding the following degradation reaction. The residual content above 500°C calculated from the mixing rule was close to the experimental results. This suggests that while FR may change the degrada- tion reaction route, it does not form extra stable char with PS segments through the interaction. 3.2 Kinetic analysis
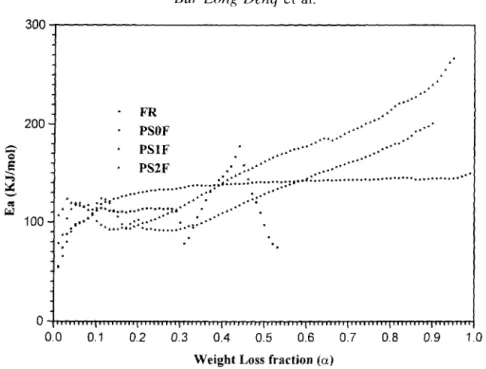
The relationship between apparent activation energy and weight loss fraction (a) of PS blends was determined using Ozawa’s method.” The results are shown in Fig. 7. The range of activation energy of PS is from 140 to 277 kJ/mol. Based on previous report?” degradation in this range is a competitive reaction between random- chain scission and end-chain scission. In our experiment, the activation energy of PS was constant at 130 kJ/mol (a =0*2 - 0.9). Since FR thermally degrades in three stages, the activation energy of thermal degradation also has three parts. The first part is from 100 to 120 kJ/mol ((Y = 0.04 - 0.29) with an average value of 110 kJ/mol. Different competing reactions cause the range of activation energy for the second and third stages to become less well defined and so their physical meaning is less clear. The activation energy of thermal degradation of PS blends increases with increasing weight loss fraction, and the average activation energy is 175 and 150 kJ/mol for PSlF and PS2F, respectively. This shows that the activation energy is increased and the maximum thermal degradation temperature of PS blends is delayed relative to pure PS. 4 CONCLUSIONS
1.
2.
3.
The thermal degradation of FR occurs in three stages up to 550°C. Propylene is the major evolved gas.
The thermal degradation of PS shows a one stage reaction and the major gas products are styrene, a-methyl styrene and benzene.
Two stage reactions are observed in the thermal degradation of PS blended with FR.
266
(a>
Bar-Long Denq et al.
(b) FR (250°C) rJ” 3600 3400 3200 3000 2800 Wavenumber (cm-‘) (c) PSOF (in NJ FR (250°C)
9
-PN- I I I I I,,,
I, 1600 1200 800 T=250°C 4000 3500 3000 2500 2000 1500 1000 500 Wavenumber (cm-‘) PSZF (in NJ 4000 3500 3000 2500 2000 1500 1000 500 Wavenumber (cm-‘)Fig. 4. FTIR spectrum of condensed phase during thermal degradation at various temperatures for (a) FR. (b) PSOF and (c) PS2F.
Thermal degradation behavior of polystyrene blended with propyl ester phosphazene 267 3 0.8 c E 0.7 .g g 0.6 Lr r, 0.5 i
Heating Rate p=lO’C/min ~ PSIF (Experimental) - - - - PSlF (By mixing rule)
7 PSZF (Experimental)
= 0.3
.; -.--.- PSZF (By mixing rule)
0 100 200 300 400 500 600
Temperature (“C)
Fig. 5. Comparison of TGA thermogram between experimental results and mixing rule for PSlF and PS2F.
0.03- Heating Rate p=lO’C/min, (in N2)
0.02 - ~ PSZF 0.01 - 0.00 .,.,....,,.,,,,..,,,,..,..r,.,..,... 0.03 - 0.02 - ~ PSlF 0.01 - O.OO-_rrr..,..,,....,,.,....*..,...,’ 0.03 - ~ PSOF 0.02 - 0.01 - 0.00 7""-'7'11111111,17rrTlr1177111111111,11111111~, H 0 100 200 300 400 500 600 Temperature (“C)
Fig. 6. DTG thermogram for thermal degradation of PS blends at a heating rate of lO”C/min under nitrogen atmosphere.
4.
The residual char yield increases with increas- ing FR content.
The evolved gas products and the residual char yield of PS are not significantly affected by blending with FR, but the major degradation temperature is delayed.
Science and Technology (CSIST), Taiwan, R.O.C. for their financial support.
REFERENCES
.
I.
2.
ACKNOWLEDGEMENTS
The authors thank Mr Marc DeRosa for his corrections and the Chung Shan Institute of
3.
4. 5.
Reghunadhan Nair, C. P., Clouet, G. and Guilbert, Y.,
Polym. Degrad. Stab., 1989. 26. 30.5
Guaita, M.. Br. Polym. J., 1986, 18, 226
McNeill, I. C. Zulfiqar, M. and Kousar, T., Polym. Degrad. Stab., 1990. 28. 131
Audisio, G. Bertini, F. Beltrame. P L. and Carniti. P..
Polym. Degrad. Stab., 1990. 29, 191
268
300
Bar-Long Denq et al.
: I 4 6. 7. 8. 9. 10. .** . . .A1 - PR 1. *.a* 200 - . PSOF ‘.a* ...I ..* ..a*
% A PSIF ..a* *....a
ll.**. *...a* E . ti . ..* . ..* . ..* & * PSZF ..:.A’ . . . ..* . ..* ..a % *...*““‘:’ *...:...~~~,..‘::... 1 1x,** . . . *.a’ . ..* 8 1 :*:.. ‘; &..A . .:.. ‘;a ..*...:::x, . **..* *. . . 100 * * ,... . ..&& ::,r.:..*’ * ..f ..: *...* * .1.f . -. . . .
00
0.0 0.1 0.2 0.3 0.4 0.5 0.6 0.7 0.6 0.9 1.0 Weight Loss fraction (a)Fig. 7. The relationship of activation energy versus weight loss fraction for PS blends. Evrrydq~ LiGng. American Chemical Society. 1987. 1 I.
Tomson. M. B. Barone, J. P and Nancollars. Ci. H..
Atomic Absorption Newlrrtrr. I Y77. 16. 1 I7 12. Halmann, M., Analyticnl Chemistry of’ Wwsphonrs
Compourzds. Wiley-Interscience Press. New York. 1972. 13. Papkov. V. S. IL’ima. M. N. Tur. D. R. and Slonimskii. G.
L., Polym. Sci. U.S.S.R., I!##. 31. 25OY 14. Maynard. S. J. Sharp. T. R. and Haw. J. F.. Mucvomole-
cules, I99 I ~ 24, 2794 IS.
Crassie. N. and Scott, G.. Polwzrr D~gr:rrrdtr~~o~~ rend 16.
Stubilisntion. Cambridge IJniversity Press, Cambridge. 1085.
Opreal. S. and Still. R. H.. ./. Appl. PO/JW. Ser.. 1076. 20. 63Y
Opreal. S. and Still. R. H.. ./. AppI. Po!,:nr. Sk. 1076. 20. 651
Opt-cat. S. and Still. R. H.. J. Appl. I’ol~n~. Su.. IY76. 20. 8SY
Still. R. H. and Whitehead, A.. .I. Appl. Polwr. Sci., I Y72. 16. 322.1
Ozawa. T.. Nu//. c‘hm. SOC: Jpn. 106.5. 38. 18x1
Pielichowski. K. Puszy‘nski. K. and Pielichowski. K.. I’olvrrr. J.. I YY4, 26. 882