行政院國家科學委員會專題研究計畫 成果報告
以隨機漫步模式評估攝護腺癌病人生活品質---芬蘭-台灣
雙邊合作計畫
研究成果報告(精簡版)
計 畫 類 別 : 個別型 計 畫 編 號 : NSC 95-2314-B-002-246- 執 行 期 間 : 95 年 08 月 01 日至 96 年 07 月 31 日 執 行 單 位 : 國立臺灣大學公共衛生學院預防醫學研究所 計 畫 主 持 人 : 陳秀熙 計畫參與人員: 碩士級-專任助理:黃志忠、吳佳芸 博士後研究:吳慧敏 報 告 附 件 : 國際合作計畫研究心得報告 處 理 方 式 : 本計畫可公開查詢中 華 民 國 96 年 10 月 31 日
行政院國家科學委員會補助專題研究計畫
□ 成 果 報 告
□期中進度報告
以隨機漫步模式評估攝護腺癌病人生活品質---芬蘭-台灣雙邊合作計畫
計畫類別:□ 個別型計畫
□ 整合型計畫
計畫編號:NSC95-2314-B-002-246-
執行期間:2006 年 08 月 01 日至 2007 年 07 月 31 日
計畫主持人:陳秀熙
共同主持人:
計畫參與人員: 黃志忠、吳慧敏、吳佳芸
成果報告類型(依經費核定清單規定繳交):□精簡報告
□完整報告
本成果報告包括以下應繳交之附件:
□赴國外出差或研習心得報告一份
□赴大陸地區出差或研習心得報告一份
□出席國際學術會議心得報告及發表之論文各一份
□國際合作研究計畫國外研究報告書一份
處理方式:除產學合作研究計畫、提升產業技術及人才培育研究計畫、
列管計畫及下列情形者外,得立即公開查詢
□涉及專利或其他智慧財產權,□一年□二年後可公開查詢
執行單位:
國立臺灣大學公共衛生學院預防醫學研究所
中
華
民
國
96 年
10 月
31 日
中文摘要
背景 雖然目前已經有許多研究探討各種因子對於癌症病人生活品質的影響,針對前列腺癌 病人的研究還很少,本研究以結構方程模式(structural equation model)去探討不同因子之間 的關係以及他們對於前列腺癌病人生活品質的影響。 材料與方法 本研究的資料來源為芬蘭一項關於前列腺癌的治療方式選擇的隨機試驗研 究,此研究將前列腺癌病人隨機分成兩組,一組病人接受到足夠的資訊而有主動權決定他 要接受的治療方式,另一組病人則依照一般醫療程序治療,再對於這兩組的病人評估其得 癌症之後的生活品質。去除追蹤資料不完整的個案之後,本研究針對 120 名研究對象進行 分析。本研究使用 EORTC QLQ-C30 版本針對生殖泌尿癌症所設計的題目重複測量研究對 象之生活品質。 結果 本研究使用因素分析得到七項決定生活品質的因子如下:情緒反應、生命力、醫療經 驗、社交生活、性生活、泌尿狀況和生理上疾病。我們提出結構方程模式描述各種因子和 前列腺癌病人生活品質的關係,情緒反應和性生活的能力直接影響生活品質,社交生活、 生命力、生理疾病、泌尿狀態和醫療經驗則間接影響生活品質。生理疾病受到泌尿和醫療 經驗影響而對生命力產生影響,生命力也同時受醫療經驗影響,生命力影響情緒反應和社 交生活,社交生活則影響情緒反應和性生活。 結論 本研究利用結構方程模式探討不同因子對於前列腺癌病人生活品質的影響,並探討各 個因子之間的關係,這在過去的研究中很少被提及。我們發現前列腺癌病人的生活品質直 接受到情緒反應和性生活的能力的影響,社交生活、生命力、生理疾病、泌尿狀態和醫療 經驗則間接影響生活品質。 英文摘要
Introduction The assessment of the interrelationships between or among many dimensions and the impacts of them on quality of life (QoL) of the prostate cancer patients was few addressed. In this study, a series of possible pathways to QoL of the prostate cancer patients corresponding to a set of hypotheses on interrelationships of these correlates were tested by linking various latent and manifested variable underpinning a structural equation model.
Materials and methods Data used in this study were derived from the Randomized Trial of Choice of Treatment in Prostate Cancer in Finland (RTCTPCF). Those with incomplete data in first follow-up were eliminated and eventually 120 subjects were enrolled in the present study. After the initial visit, the follow-up visits with repeated QoL assessment are scheduled at 3-month intervals within the first year after the diagnosis, and 6-month intervals until 5 years from
diagnosis. The EORTC instrument QLQ-C30 was used, with the primary site-specific module for genitourinary cancer as the instrument to measure the QoL of all patients at each follow-up. The QoL assessment in this study was use the total amount of the score of our questionnaire items. Results Seven factors from the QoL instrument were extracted in factor analysis, including emotional reaction, vitality, medical experience, daily life & social life, sexual affairs, urinary
issues and physical illness were created. The structure equation model was proposed to depict the hypothesized association between prostate cancer patient quality of life and a sequence of relations. Prostate cancer patient QoL was affected by emotional reaction and Sexual affairs directly but was influenced by daily and social life, vitality, physical illness, urinary issues, and medical experience indirectly. Physical illnesses were affected by both urinary matters and medical experience and have influence to vitality which was also influenced by medical experiences. Vitality affects forward to both emotional reaction and daily and social life. Daily and social life has influence to emotional reaction and sexual affairs.
Conclusion The QoL was directly affected by emotional and sexual matters otherwise was influenced indirectly by daily and social life, vitality, physical illness, urinary issues, and medical experience.
關鍵字
前列腺癌,生活品質,因素分析,結構方程模式(structural equation model) keyword
Introduction
Although there was a body of studies addressing the impacts of many dimensions on QoL of the cancer patients, a systematic approach with the incorporation of these dimensions to assess interrelationships between or among these aspects of variables, particularly in prostate cancer patients, is uncommon. To assess QoL of the prostate cancer patients and to reach a better understanding over the interrelationships of QoL related factors, a series of possible pathways to QoL of the prostate cancer patients corresponding to a set of hypotheses on interrelationships of these correlates were tested by linking various latent and manifested variable underpinning a structural equation model.
Materials and methods
The sample
Data used in this study were derived from the Randomized Trial of Choice of Treatment in Prostate Cancer in Finland (RTCTPCF) (A. Auvinen et al, 2001). The RTCTPCF aimed to assess the effects of different approaches to decision-making on the treatment chosen for prostate cancer and on the patients' quality of life in prostate cancer. Methodology of the study has been described in detail elsewhere (A. Auvinen et al, 2001). In brief, a total of 203 patients with newly diagnosed prostate cancer were randomly allocated in two study arms from four hospitals in Tampere, including Tampere University Hospital, Kuopio University Hospital, SeinaÈjoki Central Hospital and Kanta-HaÈme Central Hospital. In the intervention group, the role of the patient in the choice of treatment was actively emphasized, in the control group, whereas, the treatment was chosen according to routine procedures. We eliminated those with incomplete data in first follow-up and eventually 120 subjects were enrolled in the present study.
The identification of quality of life
It was absent of fully validated QoL instruments specific for prostate cancer when the RTCTPCF trial was planned. We made use of the EORTC instrument QLQ-C30, with the primary site-specific module for genitourinary cancer as the instrument to measure the QoL of the patient with prostate cancer. After the initial visit, the follow-up visits with QoL assessment are scheduled at 3-month intervals within the first year after the diagnosis, and 6-month intervals until 5 years from diagnosis. The same QoL instrument was applied in the follow-up visit among two trial arms and repeated QoL was estimated in each follow-up. The QoL assessment in this study was use the total amount of the score of our questionnaire items. An assumption was used in this study is that the great the score the better the QoL.
Statistical analysis
To assess whether measured items correspond to manifest indicator variables, exploratory factor analysis with orthogonal rotation method was first performed to check internal consistency under each latent variable.
Results
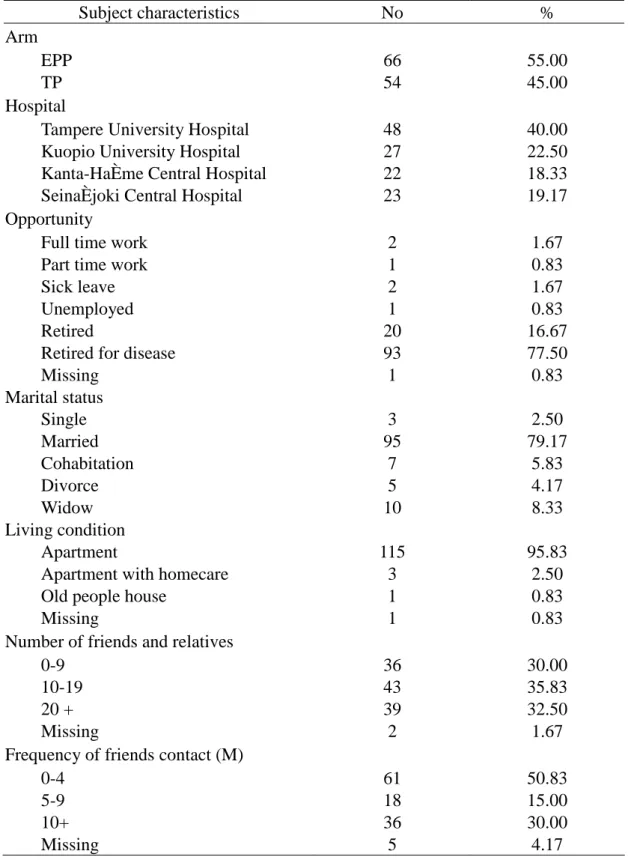
Table 1 shows the demographic characteristics of the subjects. The range of QoL score is from 243 to 396 with 342 for mean and 23.71 for standard deviation. QoL was coded as continuous data in our analysis.
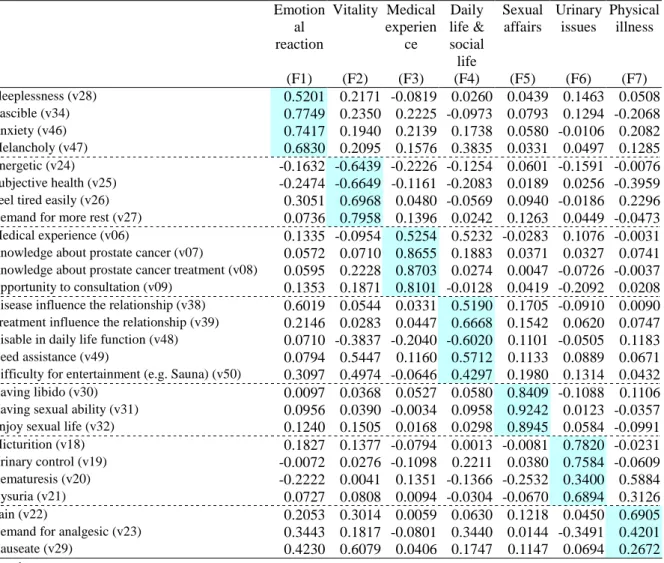
In order to build up the pathway to the QoL of the prostate cancer patients based on structural equation model, we made use of factor analysis to extract the manifested indicator variables and latent variables from the QoL instrument depicted above. Seven factors were extracted, including emotional reaction, vitality, medical experience, daily life & social life, sexual affairs, urinary issues and physical illness were created. (Table 2)
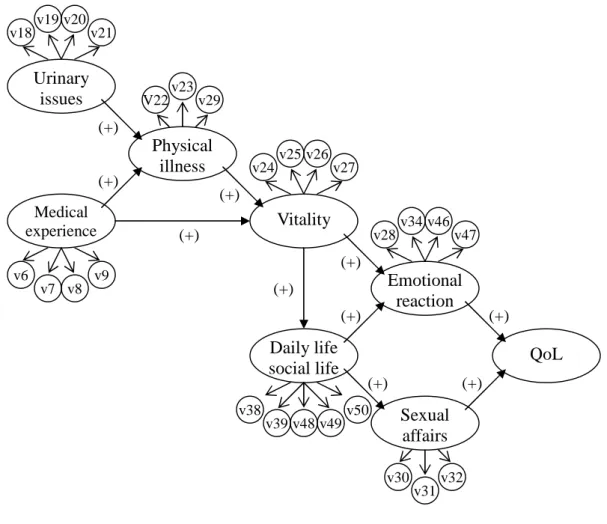
Figure 1 shows the structure equation model of prostate cancer patient QoL. The measured variables are: v06: Medical experience; v07: Knowledge about prostate cancer; v08: Knowledge about prostate cancer treatment; v09: Opportunity to consultation; v18: Micturition; v19: Urinary control; v20: Hematuresis; v21: Dysuria; v22: Pain; v23: Demand for analgesic; v24: Energetic; v25: Subjective health; v26: Feel tired easily; v27: Demand for more rest; v28: Sleeplessness; v29: Nauseate; v30: Having libido; v31: Having sexual ability; v32: enjoy sexual life; v34: Irascible; v38: Disease influence the relationship; v39: Treatment influence the relationship; v46: Anxiety; v47: Melancholy; v48: Disable in daily life function; v49: Need assistance; v50: Difficulty for entertainment ; e.g. Sauna.
According to the above observed and latent variables, we proposed the following structure equation model depicting the hypothesized association between prostate cancer patient quality of life and a sequence of relations. Prostate cancer patient QoL was affected by emotional reaction and Sexual affairs directly but was influenced by daily and social life, vitality, physical illness, urinary issues, and medical experience indirectly. Physical illnesses were affected by both urinary matters and medical experience and have influence to vitality which was also influenced by medical experiences. Vitality affects forward to both emotional reaction and daily and social life. Daily and social life has influence to emotional reaction and sexual affairs.
Conclusion
Quality of life among cancer patient has gained increasing attention in the last few decades. Though a number of factor relevant to prostate cancer patient QoL have been demonstrated in earlier studies, very few study goes to address the relations between relevant factors. In the present study we utilised the structure equation model to investigate the pathway relationship between QoL and its relevant factors. The QoL was directly affected by emotional and sexual matters otherwise was influenced indirectly by daily and social life, vitality, physical illness, urinary issues, and medical experience.
References
Auvinen A, Vornanen T, Tammela TLJ, Ala-Opas M, Leppilahti M, Salminen P, Hakama M. A randomized trial of the choice of treatment in prostate cancer: design and baselyne characteristics. BJU Int 2001;88: 708-15.
Turini M, Redaelli A, GramegnaP, Radice D. Quality of life and economic considerations in the management of prostate cancer. Pharmacoeconomics 2003; 21 (8)
Smith DS, Carvalhal GF, Schneider K, et al. Quality-of-life outcomes for men with prostate carcinoma detected by screening. Cancer 2000; 88: 1454-63
Madalinska JB, Essink, Bot ML, de Koning HJ et al. Health-related quality-of –life effects of radical prostatectomy and primary radiotherapy for screen-detected or clinically diagnosed localized prostate cancer. J Clin Oncol 2001; 19: 1619-28.
Table 1 Demographic characteristics of study subjects. Subject characteristics No % Arm EPP 66 55.00 TP 54 45.00 Hospital
Tampere University Hospital 48 40.00
Kuopio University Hospital 27 22.50
Kanta-HaÈme Central Hospital 22 18.33
SeinaÈjoki Central Hospital 23 19.17
Opportunity
Full time work 2 1.67
Part time work 1 0.83
Sick leave 2 1.67
Unemployed 1 0.83
Retired 20 16.67
Retired for disease 93 77.50
Missing 1 0.83 Marital status Single 3 2.50 Married 95 79.17 Cohabitation 7 5.83 Divorce 5 4.17 Widow 10 8.33 Living condition Apartment 115 95.83
Apartment with homecare 3 2.50
Old people house 1 0.83
Missing 1 0.83
Number of friends and relatives
0-9 36 30.00
10-19 43 35.83
20 + 39 32.50
Missing 2 1.67
Frequency of friends contact (M)
0-4 61 50.83
5-9 18 15.00
10+ 36 30.00
Table 2 Results of exploratory factor analysis for QoL related dimensions Emotion al reaction Vitality Medical experien ce Daily life & social life Sexual affairs Urinary issues Physical illness (F1) (F2) (F3) (F4) (F5) (F6) (F7) Sleeplessness (v28) 0.5201 0.2171 -0.0819 0.0260 0.0439 0.1463 0.0508 Irascible (v34) 0.7749 0.2350 0.2225 -0.0973 0.0793 0.1294 -0.2068 Anxiety (v46) 0.7417 0.1940 0.2139 0.1738 0.0580 -0.0106 0.2082 Melancholy (v47) 0.6830 0.2095 0.1576 0.3835 0.0331 0.0497 0.1285 Energetic (v24) -0.1632 -0.6439 -0.2226 -0.1254 0.0601 -0.1591 -0.0076 Subjective health (v25) -0.2474 -0.6649 -0.1161 -0.2083 0.0189 0.0256 -0.3959
Feel tired easily (v26) 0.3051 0.6968 0.0480 -0.0569 0.0940 -0.0186 0.2296
Demand for more rest (v27) 0.0736 0.7958 0.1396 0.0242 0.1263 0.0449 -0.0473
Medical experience (v06) 0.1335 -0.0954 0.5254 0.5232 -0.0283 0.1076 -0.0031
Knowledge about prostate cancer (v07) 0.0572 0.0710 0.8655 0.1883 0.0371 0.0327 0.0741
Knowledge about prostate cancer treatment (v08) 0.0595 0.2228 0.8703 0.0274 0.0047 -0.0726 -0.0037
Opportunity to consultation (v09) 0.1353 0.1871 0.8101 -0.0128 0.0419 -0.2092 0.0208
Disease influence the relationship (v38) 0.6019 0.0544 0.0331 0.5190 0.1705 -0.0910 0.0090
Treatment influence the relationship (v39) 0.2146 0.0283 0.0447 0.6668 0.1542 0.0620 0.0747
Disable in daily life function (v48) 0.0710 -0.3837 -0.2040 -0.6020 0.1101 -0.0505 0.1183
Need assistance (v49) 0.0794 0.5447 0.1160 0.5712 0.1133 0.0889 0.0671
Difficulty for entertainment (e.g. Sauna) (v50) 0.3097 0.4974 -0.0646 0.4297 0.1980 0.1314 0.0432
Having libido (v30) 0.0097 0.0368 0.0527 0.0580 0.8409 -0.1088 0.1106
Having sexual ability (v31) 0.0956 0.0390 -0.0034 0.0958 0.9242 0.0123 -0.0357
Enjoy sexual life (v32) 0.1240 0.1505 0.0168 0.0298 0.8945 0.0584 -0.0991
Micturition (v18) 0.1827 0.1377 -0.0794 0.0013 -0.0081 0.7820 -0.0231
Urinary control (v19) -0.0072 0.0276 -0.1098 0.2211 0.0380 0.7584 -0.0609
Hematuresis (v20) -0.2222 0.0041 0.1351 -0.1366 -0.2532 0.3400 0.5884
Dysuria (v21) 0.0727 0.0808 0.0094 -0.0304 -0.0670 0.6894 0.3126
Pain (v22) 0.2053 0.3014 0.0059 0.0630 0.1218 0.0450 0.6905
Demand for analgesic (v23) 0.3443 0.1817 -0.0801 0.3440 0.0144 -0.3491 0.4201
Nauseate (v29) 0.4230 0.6079 0.0406 0.1747 0.1147 0.0694 0.2672
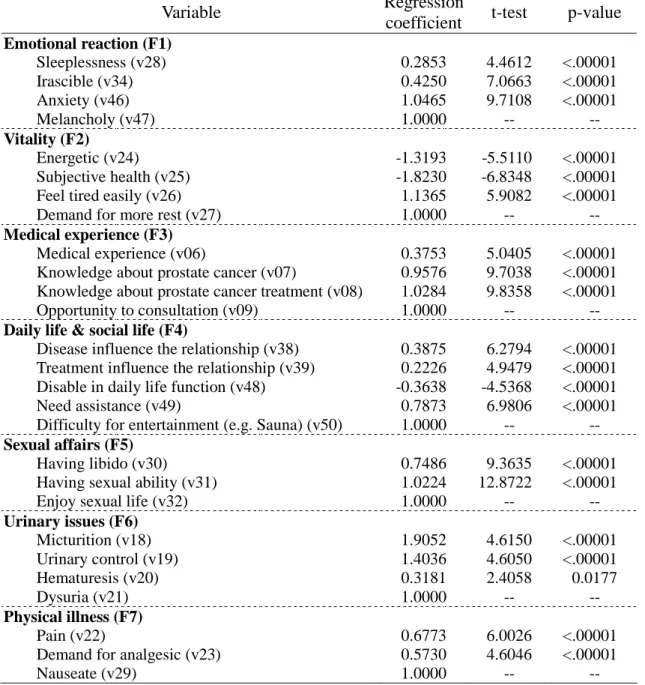
Table 3 The relationships between the manifested indicator variables and latent variables
Variable Regression
coefficient t-test p-value
Emotional reaction (F1) Sleeplessness (v28) 0.2853 4.4612 <.00001 Irascible (v34) 0.4250 7.0663 <.00001 Anxiety (v46) 1.0465 9.7108 <.00001 Melancholy (v47) 1.0000 -- --Vitality (F2) Energetic (v24) -1.3193 -5.5110 <.00001 Subjective health (v25) -1.8230 -6.8348 <.00001 Feel tired easily (v26) 1.1365 5.9082 <.00001 Demand for more rest (v27) 1.0000 --
--Medical experience (F3)
Medical experience (v06) 0.3753 5.0405 <.00001 Knowledge about prostate cancer (v07) 0.9576 9.7038 <.00001 Knowledge about prostate cancer treatment (v08) 1.0284 9.8358 <.00001 Opportunity to consultation (v09) 1.0000 --
--Daily life & social life (F4)
Disease influence the relationship (v38) 0.3875 6.2794 <.00001 Treatment influence the relationship (v39) 0.2226 4.9479 <.00001 Disable in daily life function (v48) -0.3638 -4.5368 <.00001 Need assistance (v49) 0.7873 6.9806 <.00001 Difficulty for entertainment (e.g. Sauna) (v50) 1.0000 --
--Sexual affairs (F5)
Having libido (v30) 0.7486 9.3635 <.00001 Having sexual ability (v31) 1.0224 12.8722 <.00001 Enjoy sexual life (v32) 1.0000 --
--Urinary issues (F6) Micturition (v18) 1.9052 4.6150 <.00001 Urinary control (v19) 1.4036 4.6050 <.00001 Hematuresis (v20) 0.3181 2.4058 0.0177 Dysuria (v21) 1.0000 -- --Physical illness (F7) Pain (v22) 0.6773 6.0026 <.00001 Demand for analgesic (v23) 0.5730 4.6046 <.00001 Nauseate (v29) 1.0000 --
--Table 4 Model selection
Model Chi-Square Chi-Square DF Pr > Chi-Square
M1 580.4271 338 <.0001 M2 577.7553 337 <.0001 M3 578.0462 339 <.0001 M4 588.1554 340 <.0001 M5 575.7664 338 <.0001 M6 538.6766 339 <.0001 M7 538.5482 339 <.0001 M9 538.6817 340 <.0001
Table 5 The relationships between the manifested indicator variables and latent variables Dependent variable
/ Independent variable
Standardized
regression coefficient t-test p-value Quality of Life (QoL)
Emotional reaction (F1) 0.3767 4.1102 0.0001
Sexual affairs (F5) 0.2725 3.1528 0.0020 Emotional reaction (F1)
Vitality (F2) 0.3410 2.0029 0.0474
Daily life & social life (F4) 0.4693 2.6386 0.0094 Vitality (F2)
Medical experience (F3) 0.1477 1.8619 0.0651
Physical illness (F7) 0.9258 5.7770 <.00001 Daily life & social life (F4)
Vitality (F2) 0.7821 5.5064 <.00001 Sexual affairs (F5)
Daily life & social life (F4) 0.3015 2.8736 0.0048 Physical illness (F7)
Medical experience (F3) 0.2953 2.6718 0.0086
Figure 1 Structure equation model (SEM) for pathway to Quality of Life (QoL) in prostate cancer patients. QoL Emotional reaction v28 v34 v46 v47 Vitality v24v25 v26v27 Medical experience v6 v7 v8 v9 Urinary issues v18v19 v20v21 Physical illness V22 v23 v29 Daily life social life v38 v39 v49 v50 v48 Sexual affairs v30 v31v32 (+) (+) (+) (+) (+) (+) (+) (+) (+) (+)
計畫成果自評
國際合作計畫赴國外研究心得報告
計畫編號 NSC95-2314-B-002-246- 計畫名稱 以隨機漫步模式評估攝護腺癌病人生活品質---芬蘭-台灣雙邊合作計畫 出國人員姓名 服務機關及職稱 陳秀熙教授,國立台灣大學公共衛生學院預防醫學研究所 吳慧敏博士後研究員,國立台灣大學公共衛生學院預防醫學研究所 黃志忠研究助理,國立台灣大學公共衛生學院預防醫學研究所 吳佳芸研究助理,國立台灣大學公共衛生學院預防醫學研究所 出國時間及地點 2006.12.19~2006.12.23,芬蘭坦佩蕾市(Tampere)合作研究機構 Tampere School of Public Health
合作計畫名稱 以隨機漫步模式評估攝護腺癌病人生活品質---芬蘭-台灣雙邊合作計畫 合作計畫主持人 陳秀熙
出國事由 進行此計畫進度報告、細節討論以及討論未來合作項目
一、內容及成果:
One manuscript and the analyses for other two studies (confirmatory factor analysis + GEE model, and application of random walk model on quality of life evaluation) have been done by Rex Chih-Chung Huang. The titles and corresponding comments are listing as follows.
1. Effect of intervention on treatment chosen on three surrogate measures: Analysis of data from a randomized trial of the choice of treatment in prostate cancer
(1) Adding PSA baseline in and considering whether to remove the social relationship out from the adjustment analysis.
(2) The data regarding death will be provided for further analysis.
2. Confirmatory factor analysis and GEE model on quality of life of prostate cancer patients. 3. Application of random walk model on quality of life evaluation on prostate cancer patients.
(1) Try to do some basic analysis before going to complicated analysis.
(2) Use pie chart or bar chart to see the QoL changing between different time points.
Continuing work from project NSC 94-2314-B-002-106- by Grace Hui-Min Wu
Two manuscripts have been written. The titles and corresponding comments are listing as follows.
1. Overdiagnosis in Prostate Cancer Screening With PSA: Finnish Prostate Cancer Screening Trial
(1) Try to consider the increasing incidence rate of both progressive and non-progressive prostate cancer into the model.
—This may be very helpful for designing PSA cut-off value for mass screening.
—Method of adjusting for staging by survival analysis can be applied to cumulative incidence to get the stage/Gleason score adjusted overdiagnosis proportion.
(3) Grace to send out the manuscript for expert reading.
(4) Gleason score may vary by hospitals and the data are available and can be analyzed—maybe put it into the discussion section.
(5) Explanation in clinical sense should be given to the transition matrix, or just drop the transition matrix.
(6) Pathology staging can not be substituted by clinical staging since they are not comparable. (7) The data will be updated to the end of 2003.
(8) Journal: JNCI/JAMA
(9) Both the Markov modelling for overdiagnosis and the cumulative incidence approach should be combined into one paper.
2. Progression of Prostate Cancer: A New Insight from Finnish Prostate Cancer Screening Trial
(1) The natural history should be extended to consider the following issue:
(a) Overdiagnosis: adding in non-progressive state (or maybe only focus on “progressive cancer”then specificity can be used);
(b) Incorporate the sensitivity; (c) Increasing incidence rate.
(2) Incorporating other causes of death into the model can relax the assumption of random censoring ship.
(3) Hazard of other causes of death among people at preclinical stage is slightly higher than one among people at normal. Reasons may be that people at preclinical stage are older than people at normal; or people at preclinical stage really have higher likelihood of dying.
(4) Sensitivity can also be calculated by Day’s method.
(5) Information regarding the screening history of prostate cancer cases in control group are available and can be used to correct the estimates of the model.
(6) The data will be updated till end of 2003 and stage data will also be updated.
Future Research Cooperation
The plans for future research cooperation regarding the evaluation of breast cancer screening and cervical cancer screening, including Pap smear screening and HPV DNA screening, were discussed and were preliminarily formulated during this workshop.
二、建議事項 None.