國
國
國
國
立
立
立
立
交
交
交
交
通
通
通
通
大
大
大
大
學
學
學
學
光電工程
光電工程
光電工程
光電工程研究所
研究所
研究所
研究所
碩士論文
碩士論文
碩士論文
碩士論文
矽薄膜作為質子交換膜於微型燃料電池之
製備/特性研究
Preparation and characteristic of a new proton exchange
silicon membrane for miniature fuel cells
研究生:陳逸棠 Yi-Tang Chen
指導教授:金星吾 教授 Dr. Sung-O Kim
中華民國
中華民國
中華民國
中華民國
九十七年
九十七年
九十七年
九十七年
六
六
六
六月
月
月
月
矽薄膜作為質子交換膜於微型燃料電池之
製備/特性研究
Preparation and characteristic of a new proton exchange silicon
membrane for miniature fuel cells
研 究 生: 陳逸棠
Student: Yi-Tang Chen
指導教授: 金星吾
Advisor: Dr. Sung-O Kim
國立交通大學 電機學院
光電工程研究所
碩士論文
A Thesis
Submitted to Department of photonics and Institute of Electro-Optical Engineering College of Electrical Engineering and Computer Science
National Chiao-Tung University in Partial Fulfillment of the Requirements
for the Degree of Master
In
Electro-Optical Engineering
June 2008
矽薄膜作為質子交換膜於微型燃料
電池之製備/特性研究
碩士研究生:陳逸棠 指導教授:金星吾 博士
國立交通大學 光電工程學系光電工程研究所
中文摘要
中文摘要
中文摘要
中文摘要
質子交換膜燃料電池被認為是在二十一世紀中最乾淨且有效率的替代能源技術之 一,為了維持較長的使用時間與輕重量的需求,傳統電池已經無法再縮小體積來提供電 力,而克服這些限制的一個可能的解決辦法就是使用可提供更大功率密度的微型燃料電 池,矽晶片的微加工技術是降低燃料電池架構至微米尺寸的一個重要工具。 在本實驗中,以矽晶片為基材做成薄膜並填充 Nafion® 已經被作為質子交換膜應用 於 微 型 燃 料 電 池 上 , 製 造 過 程 中 利 用 微 加 工 技 術 , 包 括 曝 光 顯 影 技 術 (Photo-lithography)、電漿輔助化學汽相沉積(PECVD)、乾式蝕刻與濕式蝕刻。矽薄膜的 尺寸大約是 1 平方公分,在此範圍內,有 100 個微米級的小洞。為了減少填充 Nafion® 時 表面張力的影響,每個小洞的剖面圖呈現倒金字塔的形狀,底部尖端的開口大小約 500 微米。此技術結合了 Nafion® 所擁有的良好質子傳導率與矽薄膜相對容易整合的優點。
Preparation and characteristic of a new
proton exchange silicon membrane for
miniature fuel cells
Student: Yi-Tang Chen Advisor: Dr. Sung-O Kim
Department of Photonics and Institute of Electro-Optical Engineering
National Chiao Tung University
Abstract
The polymer electrolyte membrane (PEM) fuel cell is considered to be one of the most promising clean and efficient alternative energy technologies of the 21st century; when it is used with sustainable hydrogen source. Conventional batteries are already unable to deliver power in more and more shrunk volumes maintaining the requirements of long duration and light weight. A possible solution to overcome these limits is the use of miniature fuel cell which offers a greater energy density compared to conventional batteries. The micromachining technology of silicon is an important tool to reduce the fuel cell structure to micrometer size.
In this paper, the membranes based on silicon substrate filled with Nafion® have been fabricated as a proton exchange membrane for miniature fuel cells. This fabrication utilizes the micromachining procedures including photo-lithography, plasma-enhanced chemical vapor deposition (PECVD), and dry and wet etching processes. The device size of the silicon membrane filled with Nafion® was 1 cm × 1 cm. Within this 1 cm2 area, a total of 100 micro pores were fabricated. The cross-sectional shape of each pore was an inverse pyramid structure with a tip dimension of less than 500 nm to improve its mechanical strength and to enhance its surface treatment process. This technique combines the advantages of Nafion®
致謝
終於順利地完成論文也結束在交通大學兩年的碩士生涯,首先要感謝金星吾教授這 兩年來的指導與幫助,不僅使我了解人生更多的面向,也讓我有機會去美國做了一個月 的研究,拓展了我的國際觀;交大良好的研究環境以及 NDL 完善的設備使我可以專注在 燃料電池的研究。 在實驗室兩年多的日子,最感謝我的同袍戰友蔡柏全,當初我們兩個人毅然決然進 入這個實驗室,一起打拼奮鬥,好不容易熬到今天,很高興我們都通過了試煉,也祝福 你之後的博士生涯順利完成;也感謝學長柯惠乾和學弟朱益興在製程上的幫忙以及為這 實驗室帶來更多歡愉的氣氛,使我在研究路途上不會感到寂寞;感謝我的同窗好友阿聰 和宏傑在課業上的幫助,還有許多曾經幫忙教我儀器的學長與同學;感謝台大物研所的 好友威宏與學長仲良在 SEM 的幫忙,讓我能順利發表期刊論文;此外,我要特別感謝 在美國華盛頓州立大學的 Su Ha 博士和好友 Sean,透過他們的指導與討論,除了在燃料 電池的研究有更深入的了解,自己的未來也多了一個新方向,還有感謝好友們 James、 Kevin 和 Bruce 的陪伴,讓我在美國的日子一點也不寂寞,雖然相識只有短短一個月, 希望未來能延續這份情誼;少了其中任何一人的幫助,我都無法完成實驗且順利畢業, 很幸運且高興能認識你們,衷心地祝福你們都能順利完成自己學業及人生目標。 最後,對於我的家人,謝謝你們一路對我的支持與照顧,讓我能心無旁鶩的學習與 研究。現在我順利完成學業即將離開交大,此刻心情充滿喜悅,願將這喜悅與曾經幫助 與關心我的朋友們分享。Table of Contents
PageAbstract (Chinese)……….………i
Abstract (English)……….…ii
Acknowledgements……….iii
Table of Contents……….………iv
Figure Captions………vi
List of Tables……….viii
1. INTRODUCTION……….………1
1.1 Background………...………...1
1.2 Overview………...………...5
1.3 Motivation………...……….7
1.4 PEM Fuel Cells………...……….8
1.4.1 PEM fuel cell structure and reactions
………...………….8
1.4.2 Theory of operation
………...………...13
1.4.3 Water management
………...……….………...22
1.5 Basic Theory and Technology………...……….27
1.5.1 Micro-fabrication technology
…….……….………...27
2. EXPERIMENT……….………...41
2.1 Device fabrication…………...………...41
2.1.1 Silicon membrane
…….………..……….41
2.1.2 Membrane electrode assembly (MEA)
………...……….48
2.2 Experimental setup………...………..50
3. RESULTS AND DISCUSSIONS………….…………...51
3.1 SEM micrograph………..……….51
3.1.1 Inverse pyramidal shaped silicon membrane
….………...…………51
3.1.2 Proton exchange silicon membrane
………...………..54
3.2 Swelling test………...…………...………56
3.3 Current-voltage (I-V) characteristics and power density……..…….57
4. CONCLUSIONS AND FUTURE WORKS……….……..62
4.1 Conclusions………...……...……….62
4.2 Future works………….…..………...………62
Figure Captions
Page Fig.1-1 Schematic representation of different energy (battery, fuel cell and internal
combustion engine) converters in the form of black-boxes………...……….2
Fig.1-2 Basic description of a PEM fuel cell operation………...…….………...9
Fig.1-3 An exploded view of a PEM unit cell structure and a PEMFC stack. MEA is an abbreviation for Membrane Electrode Assembly, the structure, which consists of an ionomer membrane and two electrodes…………...…….……….10
Fig.1-4 Characteristics of a typical PEMFC polarization curve………...………….19
Fig.1-5 Relative contributions of different voltage loss mechanisms…...……….20
Fig.1-6 Water transport processes in a PEM fuel cell………24
Fig.1-7 Schematic diagram of a PECVD…………...………29
Fig.1-8 Schematic diagram of R.I.E. system………..…….………...30
Fig.1-9 Schematic diagram of bulk micromachining………...…….……….31
Fig.1-10. Schematic diagram of Si lattice structure………....………..32
Fig.1-11. Miller indices of the different planes in cubic crystal…………...………32
Fig.1-12. Dangling bond at the Si atom react with OH – (a) lattice plane (111) (b) lattice plane (100)……….……….33
Fig.1-13. Anisotropic etching of (100) and (110) orientation Si wafer…………....………….34
Fig.1-14. Schematic diagram of the mechanism of wet etching process…...….…………...36
Fig.1-15. Schematic diagram of a natural etching mask formed by hydrogen bubble..……...37
Fig.2-1 Photograph of Wet Bench……….……...………..42
Fig.2-4 Photograph of Reactive Ion Etching system……....…….…...……….45 Fig.2-5 Detail process to realize the fabrication of wet etching mask…..……….…………47 Fig.2-6 Detail processes to realize the fabrication of membrane electrode assembly (MEA) after the etching mask fabricated.……..……….……...………...49
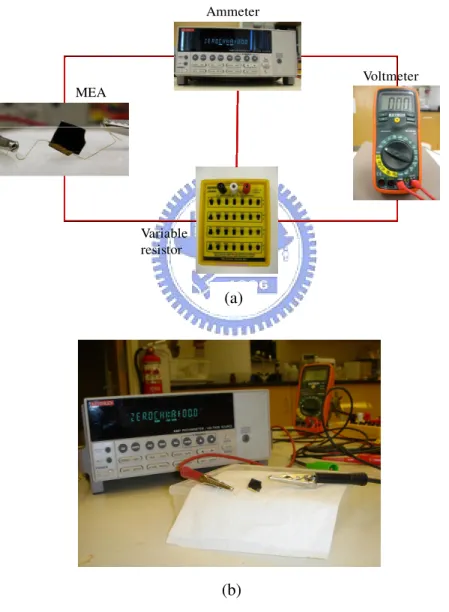
Fig 2-7 (a) Schematic diagram and (b) Photograph of the experimental setup for
characteristics of MEA………..50 Fig.3-1 (a) SEM cross-section view of a V-groove after the anisotropic etch obtained using a water solution at 33% of KOH etch at 80 °C, while (b) refers to a sequence of more V-grooves defined on the same wafer…...………..………..52 Fig.3-2 (a) Using 33% KOH solution etch wafer back at 80 °C to get pores and the size is around 400 nm (b) Top view of a 400 nm x 400 nm pore………...53 Fig.3-3 SEM cross-section imaging of a Nafion® filled inverse pyramid structure silicon membrane………..……….………...55 Fig.3-4 Membrane electrodes assembly (MEA) after depositing the catalyst layers using E-gun evaporation process. Scale comparison with a penny……...………...55 Fig.3-5 The optical microscope imaging of (a) the original membrane (b) after immersing into DI water for three days. The schematic cross-section diagram as below....…...57 Fig.3-6 5M formic acid/air and 5M formic acid with sulfuric acid/air (a) cell potential and (b)
power density curves………...……….………….58 Fig.3-7 5M, 8M, and12M formic acid with sulfuric acid/air current density vs. feed concentration: (a) cell potential and (b) power density curves…………...………..60
List of Tables
Page
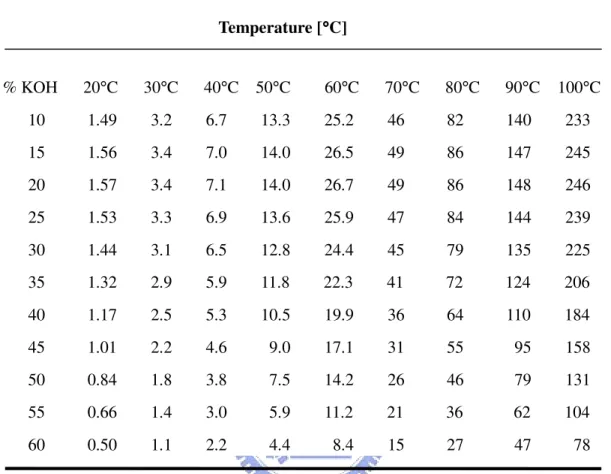
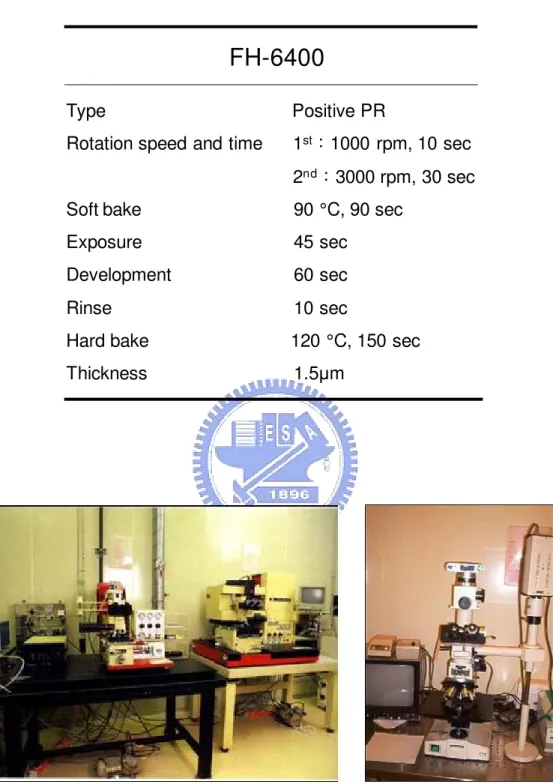
Table 1-1 Comparison of different fuel cells and their operating characteristics………...….3 Table 1-2 Etching rate for (100) orientation Si wafer in different temperature and concentration of aqueous KOH………...………...…………40 Table 2-1 Parameters of FH6400 in the photolithography for etching mask………....…….44
Chapter 1
Introduction
1.1 Background
1.1.1 History of fuel cellsThe invention of the fuel cell is widely attributed to Sir William Grove, a Welsh judge and amateur scientist. In 1839, he discovered that mixing hydrogen and oxygen in the presence of an electrolyte produced electricity and water. The term “fuel cell” was coined in 1889 by L. Mond and C. Langer, who attempted to develop a fuel cell that uses industrial coal gas and air.
The technology had no practical value until the 1930’s, when Francis T. Bacon began his groundbreaking research. Bacon applied the platinum catalysts employed by Mond and Langer in a hydrogen-oxygen fuel cell using less corrosive alkaline electrolyte and nickel electrodes. It took Bacon years to overcome technical challenges and it was not until 1959 that he and his co-workers were able to demonstrate a practical five-kilowatt fuel cell stack.
NASA’s influence in the development of fuel cells is not to be understated. In the 1950’s, NASA decided to use fuel cells to supply power during space flight for their manned space missions. NASA funded over 200 research projects on fuel cell technology and consequently, fuel cells have provided on-board electricity and water to the Gemini, Apollo and Space Shuttle missions.
For a long time, the price of fuel cell systems was prohibitive and they were used only in special applications, where good performance was the primary concern. In the last 20 years, ongoing research has produced new materials and solutions, which have led to improving fuel cell economies. That, coupled with concern for the environment and earth’s limited resources,
has led to introduction of commercial applications of fuel cells, mainly in the fields of ground transport and distributed power generation.
1.1.2 About fuel cells
Fuel Cells are electrochemical energy converters. They can be regarded as black-boxes (see Figure 1-1) converting chemical energy contained in a fuel directly into electrical energy
while generating heat and water as by-products.
The basic mechanism underlying this conversion is the same as the one for batteries. The primary difference being that the battery contains the reactants (i.e. fuel and oxidant) that generate electricity whereas those reactants need to be supplied externally to the fuel cell. In other words, a battery needs to be thrown away or recharged once those reactants are depleted while the fuel cell can be refueled more easily and quickly by either refilling the tank with
E n er g y
Fuel Cell
Internal Combustion Engine Battery E n er g y E n er g y Water Heat Electricity Exhaust Gases Heat mech. Power Heat Electricity Oxygen Fuel Oxygen Fuel E n er g yFuel Cell
Internal Combustion Engine Battery E n er g y E n er g y Water Heat Electricity Exhaust Gases Heat mech. Power Heat Electricity Oxygen Fuel Oxygen FuelFig.1-1. Schematic representation of different energy (battery, fuel cell and internal combustion engine) converters in the form of black-boxes.
combustion engines (ICE) which, when provided with fuel and air, generate mechanical power with heat and exhaust gases as byproducts.
Fuel cells are customarily classified according to the electrolyte employed. The five most common fuel cell types are
– Polymer Electrolyte Membrane Fuel Cells (PEMFC), – Alkaline Fuel Cells (AFC),
– Phosphoric Acid Fuel Cells (PAFC), – Molten Carbonate Fuel Cells (MCFC) and – Solid Oxide Fuel Cells (SOFC).
In addition, there are two fuel cell types known as Direct Methanol Fuel Cell (DMFC) and Direct Formic Acid Fuel Cell (DFAFC), which are similar to PEMFC, except they use methanol and formic acid as the fuel, respectively; instead of hydrogen or hydrogen rich gas. Table 1-1 gives an overview of the main classes of fuel cells with their associated fuels,
operating temperatures and electrolyte types.
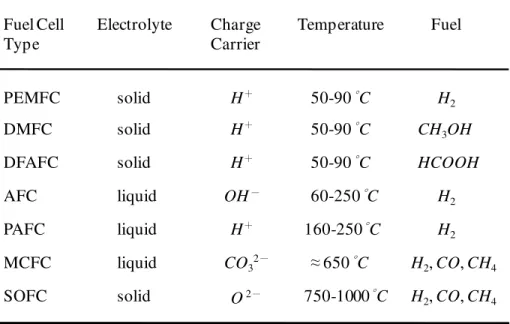
Table 1-1. Comparison of different fuel cells and their operating characteristics.
Data from[1]. Fuel Cell Type Electrolyte Charge Carrier Temperature Fuel PEMFC DMFC DFAFC AFC PAFC MCFC SOFC solid solid solid liquid liquid liquid solid H+ H+ OH- H+ H+ CO32- O 2- 50-90°C 50-90°C 50-90°C 60-250°C 160-250°C ≈ 650°C 750-1000°C H2 CH3OH HCOOH H2 H2 H2, CO, CH4 H2, CO, CH4
Proton Exchange Membrane Fuel Cells (PEMFC) or Polymer Electrolyte Fuel Cells
(PEFC) are based on a solid polymer electrolyte. Fast startup times, low temperature operation and high power densities make them an easy to use technology especially for portable or transport applications. CO poisons the catalyst and the hydrogen fuel has to be very pure. Because the polymer membrane has to be kept well humidified for good proton conduction, water management is one of the critical aspects of successfully running a PEMFC.
Direct Methanol Fuel Cells (DMFC) are similar in construction to PEM fuel cells. Since
liquid methanol can be used as a fuel, no external fuel processing is required and high energy storage densities can be achieved. Unfortunately, the polymer membrane is not impermeable to liquid methanol and the resulting fuel crossover reduces overall system efficiency.
Direct Formic Acid Fuel Cells (DFAFC) are a subcategory of PEM fuel cells. Similar to
methanol, formic acid is a small organic molecule fed directly into the fuel cell, removing the need for complicated catalytic reforming. Storage of formic acid is much easier and safer than that of hydrogen because it does not need to be done at high pressures and (or) low temperatures, as formic acid is a liquid at ambient temperature. Formic acid does not cross over the polymer membrane, so its efficiency can be higher than that of methanol.
Alkaline Fuel Cells (AFC) are based on a liquid, concentrated KOH electrolyte. AFCs can
operate with non-precious metal catalysts (typically nickel) and therefore have a cost advantage over other types of fuel cells. The use of a liquid electrolyte requires an additional electrolyte re-circulation system. Unfortunately, CO2 is a poison for the liquid electrolyte and
needs to be scrubbed from process air. Typically, the use of AFCs has been limited to niche applications such as military and space applications.
Phosphoric Acid Fuel Cells (PAFC) are based on a liquid acid electrolyte. Due to their
higher operating temperature, they are less sensitive to CO impurities in the fuel and water management is less of an issue. Additionally, they exhibit excellent long term stability. Their relatively long start-up times and low power densities limit their application to stationary power or co-generation plants.
Molten Carbonate Fuel Cells (MCFC) are based on a liquid molten carbonate electrolyte
and generally exhibit very high conversion efficiencies. A high operating temperature allows direct use of non noble catalysts along with direct internal processing of fuels such as natural gas. Relatively long start-up times and low power densities again limit their application to stationary power or co-generation plants.
Solid Oxide Fuel Cells (SOFC) are based on a solid oxide electrolyte conducting oxygen O2−
ions. As with the MCFC, the high operating temperature translates into non-noble catalysts, direct internal hydrocarbon fuel processing and high quality waste heat that can be utilized in combined-cycle power plants. Additionally, high power densities along with high efficiencies can be attained. Slow start-up times dictate their primary use as stationary power or co-generation plants.
1.2 Overview
First PEMFC devices were developed in the 1950’s by General Electric Company for auxiliary power sources for Gemini space missions [2]. Foundations for PEMFC
break-through were laid in 1966, when General Electric Company applied Nafion®, a perfluorinated sulfonic acid ionomer membrane invented by DuPont de Nemours Company in 1962, as the electrolyte in PEMFC [3]. In the 1980’s PEMFC technology experienced a renaissance in the form of introduction of low platinum loading electrodes [4]-[6], and further in the early 1990’s with the invention of thin film electrodes [7].
PEM fuel cells are an attractive option for a wide range of applications, including vehicle power sources, distributed power and heat production, and even portable and mobile systems, for example consumer electronics. Miniaturization and development of devices such as cellular phones or portable computers and the desire to increase life time of batteries lead the research beyond common types of batteries like nickel–cadmium (NiCd), nickel metal hydride (NiMH) or lithium ion (Li-ion). Since the last few years, many laboratories have been involved in the conception of fuel cells for portable applications because of their great energy density within the same dimensions of previously mentioned batteries, their simple use (easily and quickly rechargeable just by refilling in fuel) and the fact that it is theoretically a non-polluting technology. Several types of FC are developed like proton exchange membrane fuel cell (PEMFC) or direct methanol fuel cell (DMFC) which are the most popular solutions for portable applications.
Most of them use ionomeric membranes made of Nafion® [8] or Nafion® based membranes [9]. Nafion® is the reference material in proton-conducting membranes but many other types of ionomeric membranes are also reported [10]. Literature also reports original research axes like hybrid silica/Nafion® membranes [11] or a porous silica membrane filled with sulfonated polyelectrolyte [12]. However, this last method requires a thick porous carbon disk as support and is not suitable to obtain miniature cells.
1.3 Motivation
Silicon is an ideal material for constructing future micro fuel cell, because the silicon based micro fuel cells can be mass produced at a low cost via existing MEMS technology. Hence, several investigations have attempted to fabricate the silicon based micro fuel cells
[13]-[19]. In its early development, the anode and cathode structures (ex. current collectors, flow fields, fuel reservoir, etc.) were micro-fabricated using silicon wafer followed by stacking them with Nafion® membrane. However, Nafion® is polymer and, unlike silicon, is not compatible with conventional MEMS technology. To mitigate this problem, there have been attempts to replace this polymer membrane with acid functionalized inorganic membrane. For example, the use of porous silicon filled with Nafion® as a proton exchange membrane had been demonstrated [20].
In general, the porous silicon membrane is fabricated by anodizing a silicon wafer in a hydrofluoric solution. This fabrication process produces long narrow channels with a typical diameter of 30 nm. These channels need to be functionalized with acid groups in order to conduct protons. However, due to the long channels with very small diameters of porous membrane, it is almost impossible to wet the entire channel surfaces with these acid-functional-group solutions. For example, if the silicon porous membrane is functionalized with Nafion® by filling the channels with Nafion® solutions, only the top and bottom portions of each channel would be filled with Nafion® due to high surface tension. In addition, once this Nafion® filled porous silicon membrane is hydrated, swelled Nafion® can easily crack the channels.
Therefore, we propose a different way of making porous silicon membrane using a KOH anisotropic etching process. This new process provides a porous membrane with the V-shaped (or inverse pyramid shaped) channels, which is advantageous for avoiding aforementioned surface tension and swelling problems. Based on this new approach, we expect to achieve a
higher performance of future micro fuel cells.
1.4 Polymer Electrolyte Membrane Fuel Cells
In Polymer Electrolyte Membranefuel cells, a thin ion-conducting polymer membrane is utilized as the electrolyte. Benefits of solid electrolyte include high power density, reduced corrosion and fewer electrolyte management problems compared to liquid electrolytes. PEM fuel cells operate in temperatures where water is in liquid form. Low operating temperature guarantees quick startup from ambient conditions and extremely low nitrogen oxide emission, but then again requires the use of expensive platinum metal catalysts.
Polymer electrolyte membrane fuel cells use hydrogen or hydrogen-rich gas as the fuel and oxygen as the oxidant. Oxygen may be supplied pure or as air, depending on the application. Hydrogen molecules are split on the anode into protons and electrons. The protons travel through the electrolyte membrane to the cathode while the electrons are conducted to the cathode through the external circuit and the load. On the cathode oxygen, protons and electrons combine to form water.
1.4.1 PEM fuel cell structure and reactions
1.4.1.1 PEM fuel cell reactions and stack components
A PEM fuel cell consists of a negatively charged electrode (cathode), a positively charged electrode (anode), and an electrolyte membrane. Hydrogen is oxidized on the anode and oxygen is reduced on the cathode. Protons are transported from the anode to the cathode through the electrolyte membrane and electrons are carried to the cathode over an external circuit. On the cathode, oxygen reacts with protons and electrons forming water and producing heat. Both the anode and the cathode contain a catalyst to speed up the
electrochemical processes. Basic reactions of a PEM fuel cell are depicted in Figure 1-2. Half
cell reactions and the total reaction of the PEM fuel cell are presented below.
The electrical and heat energy are produced by the cathode reaction. Theoretically, the Gibbs energy of the reaction is available as electrical energy and the rest of the reaction enthalpy is released as heat. In practice, a part of the Gibbs energy is also converted into heat via the loss mechanisms.
Single fuel cell produces a limited voltage, usually less than one volt. In order to produce a useful voltage for practical applications, several unit cells are connected in series to form a
Fig.1-2. Basic description of a PEM fuel cell operation. anode reaction cathode reaction total reaction H2 ½O2 + 2e- + 2H+ H2 + ½O2 2H+ + 2e- H2O (l) H2O (l) (1) (2) (3)
fuel cell stack. The output voltage depends on the number of unit cells in the stack. An exploded view of a PEM fuel cell and a PEMFC stack are presented in Figure 1-3.
1.4.1.2 Electrolyte membrane
The electrolyte membrane allows protons to pass through to the cathode side, but separates hydrogen and oxygen molecules and therefore prevents direct combustion. The membrane also acts as an electronic insulator between the bipolar plates.
The proton conducting membrane usually consists of a PTFE-based polymer backbone, to which sulfonic acid groups are attached. The acid molecules are fixed to the polymer and cannot leak out, but the protons on these acid groups are free to migrate through the membrane. The most common membrane material in PEMFC prototypes is Nafion®.
Fig.1-3. An exploded view of a PEM unit cell structure and a PEMFC stack. MEA is an abbreviation for Membrane Electrode Assembly, the structure, which consists of an ionomer membrane and two electrodes.
The membrane must remain hydrated in order to be proton conductive. This limits the operating temperature of PEM fuel cells to under the boiling point of water and makes water management a key issue in PEM fuel cell development. However, materials, which are proton conductive in temperatures over 100.°C are being developed. A summary of proton conducting materials for both low and medium temperatures and the present state of art has been presented by Alberti and Casciola [21]. The conductivity of the membrane is sensitive to contamination. For example, if the membrane is exposed to metallic impurities, metal ions diffuse into the membrane and displace protons as charge carriers, which lower the membrane conductivity.
1.4.1.3 The electrodes
All electrochemical reactions take place on the electrode surfaces. To speed up cell reactions, electrodes contain catalysts particles, virtually always platinum or an alloy of platinum and other noble metals. Low operating temperature and the low pH makes the use of catalysts necessary [22], especially oxygen reduction reaction (ORR) on the cathode is very slow if catalyst is not present.
The electrodes are usually made of a porous mixture of carbon supported platinum and ionomer. In order to be able to catalyze reactions, catalyst particles must have contact to both protonic and electronic conductors. Furthermore, there must be passages for reactants to reach the catalyst sites and for reaction products to exit. The contacting point of the reactants, catalyst and electrolyte is conventionally referred to as the three-phase interface.
In order to achieve acceptable reaction rates, the effective area of active catalyst sites must be several times higher than the geometrical area of the electrode. Therefore, the electrodes are made porous to form a three-dimensional network, in which the threephase interfaces are located.
Nowadays, most PEMFC developers have chosen the thin-film approach, in which the electrodes are manufactured directly on the membrane surface, for their product prototypes. The benefits of thin-film electrodes include lower price, better utilization of catalyst and improved mass transport [23]. The thickness of a thin-film electrode is typically 5-15 µm and the catalyst loading is between 0.1 to 0.3 mgcm-2. The other option is to manufacture the electrode on the surface of the porous gas diffusion layer by impregnating the layer with a mixture of carbon supported catalyst and ionomer.
1.4.1.4 Gas diffusion layers
In a PEM fuel cell, the MEA is sandwiched between the flow field plates. On each side of the MEA, between the electrode and the flow field plate, there are gas diffusion layers. They provide electrical contact between the electrodes and the bipolar plates, and distribute reactants to the electrodes. They also allow reaction product water to exit the electrode surface and permit passage of water between the electrodes and the flow channels.
Gas diffusion layers are made of a porous, electrically conductive material, usually carbon cloth or carbon paper. The substrate is usually treated with a fluoropolymer and carbon black to improve water management and electrical properties.
1.4.1.5 Bipolar plates
In a fuel cell stack, bipolar plates separate the reactant gases of adjacent cells, connect the cells electrically, and act as a support structure. Furthermore, bipolar plates have reactant flow channels on both sides, forming the anode and the cathode compartments of the unit cells on the opposing sides of the bipolar plate. In a unit cell, separator plates have flow channels only on one side and are sometimes called monopolar plates.
Flow channel geometry has an effect on reactant flow velocities and mass transfer and thus on fuel cell performance. Basic channel geometries and performance test results have been presented for example by Mennola [24].
Bipolar plate materials must have high conductivity and be impermeable to gases. Due to the presence of reactant gases and catalyst, the material should be corrosion resistant and chemically inert. For most of the applications, also low weight and high strength are important. For commercial applicability, the material should be cheap and suitable for high-volume manufacturing methods.
Most PEMFC bipolar plates are made of resin-impregnated graphite, but also stainless steel has been used [25], [26]. Solid graphite is highly conductive, chemically inert and resistant to corrosion, but expensive and costly to manufacture. Stainless steel is very affordable, but expensive to machine. In addition, stainless steel must often be coated to prevent corrosion and reduce contact resistance.
Flow channels are machined or electrochemically etched to the graphite or stainless steel bipolar plate surfaces. These methods are not suitable for mass production and therefore new bipolar materials are being researched. Best results have been achieved with carbon-polymer composites, which can be molded [27], [28].
1.4.2 Theory of operation
1.4.2.1 Open circuit voltage
The reversible standard potential E0 of an electrochemical reaction is defined as
zF G E
0
where ∆G0is the Gibbs energy change for the reaction under NTP condition, z is the reaction charge number and F is the Faraday constant. The Gibbs energy is dependent on the temperature by the relation
S T H G = ∆ − ∆
∆ (5)
where ∆H is the reaction enthalpy change, T is the temperature, and ∆S is the reaction entropy change. Both reaction enthalpy and entropy are also dependent on the temperature. Substituting the standard conditions values for hydrogen and oxygen [22] into Equations (4)
and (5), gives
V
229
.
1
Cmol
96485
2
kJmol
3
.
237
1 1 0 O / H2 2=
⋅
−
−
=
− −E
Outside standard conditions, the theoretical potential Et for an electrochemical reaction is
expressed by the Nernst equation [29]
−
=
∏
i i 0 t iln
a
zF
RT
E
E
ν (6)where R is the gas constant, T is the temperature,aiis the activity of the species i, and νi is the
stoichiometric coefficient of species i. E0 is a function of temperature and pressure, and is given by the Equation (4). By assuming that the gases are ideal, i.e. the activities of the gases are equal to their partial pressures, and that the activity of the water phase is equal to unity7, Equation (6) gives
−
=
∏
i i 0 i 0 tln
νp
p
zF
RT
E
E
(7)where pi is the partial pressure of species i and p0 is the reference pressure. For ideal gases, partial pressure of species i, pi can be expressed as a product of total pressure p and
p
x
p
i=
i (8)For a hydrogen-air fuel cell operated on dry gases, Equations (7) and (8) give
(
)
−
=
2 1 2 2 321
.
0
ln
2
H 0 t 0p
p
p
airF
RT
E
E
(9)
At standard temperature and pressure, the theoretical potential of hydrogen-air fuel cell is
(
0
.
21
)
1
.
219
V
1
ln
Cmol
96485
2
K
15
.
298
K
Jmol
314
.
8
V
229
.
1
2 1 2 1 1 1 air / H , t=
⋅
⋅
−
=
− − −E
1.4.2.2 Current-voltage equationElectrical energy is obtained from a fuel cell only when a current is drawn, but at the same time, cell voltage drops due to various irreversible loss mechanisms. The loss, which is often called overpotential η, is defined as the deviation of the cell potential E from the theoretical potential Et, t E E− = η (10)
In a fuel cell, overpotentials originate from three sources:
– activation overpotential arises from the kinetics of charge transfer reactions, – ohmic losses arise from component resistances,
– diffusion overpotential arises from the limited rate of mass transfer.
Activation overpotential arises from the kinetics of charge transfer reaction across the electrode-electrolyte interface. In other words, a portion of the electrode potential is lost in driving the electron transfer reaction. Activation overpotential is directly related to the nature of the electrochemical reactions and represents the magnitude of activation energy, when the reaction propagates at the rate demanded by the current.
In a hydrogen-oxygen fuel cell, the contribution of anode activation overpotential is negligible, since the oxygen reduction on the cathode is significantly slower than the hydrogen oxidation on the anode [22]. The oxygen reduction reaction (ORR) activation overpotential decreases as the potential shifts to the negative direction, making the activation overpotential significant only at low current densities.
Expressions for the activation overpotentials can be derived from the Butler-Volmer equation. The anode activation overpotential increases with current density and can be expressed as a , 0 a , Fi RTi act =
η
(11) wherei
is the current density andi
0,a is the anode reaction exchange current density.Exchange current density represents the reaction rate. The equation for cathode activation overpotential is
(
)
(
)
(
)
F
i
RT
i
F
RT
i
i
F
RT
actln
1
ln
1
ln
1
0,c 0,c c ,α
α
α
η
−
−
−
=
−
=
(12)where α is the charge transfer coefficient and i0,c is the cathode reaction exchange current
density. The right hand side of the Equation (12) can be expressed as
i
b
a
act,c
=
+
ln
η
(13)which is known as the Tafel equation. The Butler-Volmer equation and the derivation of
Equations (11)-(13), has been presented for example by Koryta et al. [30]. The exchange current for the anode reaction in fuel cell conditions is between 0.1 and 100 mAcm-2. The cathode exchange current is about 10-5 times smaller [22].
Ohmic overpotential, also known as IR-losses, result from electrical resistance losses in the cell. These resistances can be found in practically all fuel cell components: ionic
resistance in the gas diffusion layers, bipolar plates and terminal connections. The dominant contribution to the IR-losses arises from the electrolyte membrane [31]. The IR-loss ηIR can
be expressed by the equation
ir IR
IR =− =−
η (14)
where I is the current, i is the current density, R is the total cell resistance, and r is the area specific resistance.
Diffusion overpotential is caused by mass transfer limitations on the availability of the reactants near the electrodes. The electrode reactions require a constant supply of reactants in order to sustain the current flow. When the diffusion limitations reduce the availability of a reactant, part of the available reaction energy is used to drive the mass transfer, thus creating a corresponding loss in output voltage. Similar problems can develop if a reaction product accumulates near the electrode surface and obstructs the diffusion paths or dilutes the reactants.
The diffusion overpotential can be expressed as
+ − = =
C
C
C
C
C
C
C
C
zF RT zF RT d s O O H s H s H O H s O 2 2 2 2 2 2 2 2 ln ln ln η (15) where 2 H C and 2 OC are the hydrogen and oxygen bulk concentrations, and
C
sH 2 andC
sO2 are the hydrogen and oxygen electrode surface concentrations, respectively [31].If the concentration profile between the flow channel and the electrode surface is assumed linear (Nernst diffusion layer model), the relation between the current density and the concentration can be solved using Fick’s I law and Faraday’s law. As a result, the diffusion overpotential can be expressed as
− − − = a , c , 1 ln 1 ln l l d i i i i zF RT η (16)
where il,a and il,c are the anode and cathode limiting currents, respectively. Limiting currents, which can be readily measured, occur when the reactant concentration on the electrode surface is zero.
The main source for diffusion overpotential is considered to be the diffusion of oxygen through the partially flooded gas diffusion layer on the cathode side [32]. Using pure oxygen removes the diffusion problems related to reactant availability, but mass transfer can still be affected by obstruction of diffusion paths and reactant dilution. Diffusion overpotential is much smaller on the anode than on the cathode, since the diffusion of hydrogen is much faster than that of oxygen. If pure hydrogen is used, the only diluting component is the water transported to the anode by back diffusion. Reactant availability problems can still occur, if the flow stoichiometry is very low.
Expressions for anode and cathode potentials can be derived from the Equation (10) and overpotential Equations (12) to (15), giving
C
C
zF RT i i F RT E E t act d 2 2 H s H a , 0 a , a , a , a = +η +η = + ln (17)for the anode and
(
)
C
C
zF RT i i F RT E E act d 2 2 O s O c , 0 c , c , c , t c ln 1− + = + + = α η η (18)for the cathode. The standard potential for the anode reaction is by definition 0 V. The potential of an electrochemical cell is defined as the potential difference between the cathode and the anode. Using Equations (17) and (18), and taking IR-loss, Equation (14), into account, the fuel cell voltage can be expressed as a function of current density:
ir zF RT i i i i F RT E E
C
C
C
C
− + + − − = sH s O c , 0 c , t 2 2 ln 1 ln α (19)Concentrations in Equation (19) can be expressed as functions of current density using the Nernst diffusion layer model and Equation (16).
ir i i i i zF RT i i i i F RT E E l l − − − − + + − − = a , c , a , 0 c , 0 c , t ln 1 ln 1 1 ln α (20)
Characteristics of a typical PEM fuel cell current-voltage, or polarization curve are presented in Figure1-4. The curve can be divided into three regions, which are governed by a
different overpotential. Activation overpotential dominates at low current densities in region I. Region II is governed by the IR-losses and the bending down of the polarization curve in region III is due to the diffusion overpotential. Relative contributions of different overpotentials are illustrated in Figure 1-5.
The effect of activation overpotential is seen in the Figure 1-5 as a rapid drop of the
voltage at low current densities. The middle region in Figure 1-4 is nearly linear and is
governed by IR-losses. The ionomer conductivity depends on the humidification level, and thus drying out of the MEA increases total cell resistance, making the voltage drop more rapid.
Diffusion overpotentials are the dominating loss mechanism at higher current densities, where the reaction rate is mass transfer limited. Water management is of key importance in controlling the diffusion overpotentials. Excess water in the gas diffusion layer or on the electrode obstructs the reactant diffusion to the active area. Diffusion overpotentials bend polarization curves down at high current densities.
On many occasions, it is convenient to study polarization curves that are free from the IR-loss, i.e. IR-compensated. For IR-compensation, the polarization voltage and resistance are
effect of IR-loss is removed by compensating the polarization voltage at each point by the size of the IR-loss. The advantage of IR-compensation is that the polarization curves show only the contributions of activation and diffusion overpotentials and the resistance can be studied separately by plotting the current-resistance curves.
1.4.2.3 Identifying overpotential
Measuring polarization curves is a well known electrochemical characterization method and it is widely used in fuel cell performance testing. Together with resistance measurements, polarization curves provide information on the overpotentials. Polarization curves are measured by generating a current or voltage sweep with a load unit and recording the cell voltage as a function of current density. To achieve steady state operation at each current density, the sweep is discrete, i.e. the voltage is measured for a given time after each step.
A method for acquiring accurate data on the contributions of all the individual overpotentials simultaneously has not been presented, but overpotentials can be sorted out by comparing the polarization and resistance plots measured using air and pure oxygen. The downside of this approach is that the different overpotentials are determined at different points of time.
The contribution of IR-loss is the easiest one to measure. Many commercial fuel cell test stations feature a built-in resistance measurement function, and instructions for building resistance measurement apparatuses has been published for example by Wruck et al. [33] and Büchi et al. [34]. The relative contribution of IR-loss can be seen by comparing uncompensated and IR-compensated polarization curves, and the absolute cell resistance values can be plotted as a function of current density.
The effect of activation overpotential is best visible in IR-compensated polarization curves measured with pure oxygen. The absolute magnitude of activation overpotential cannot
be obtained, since the open circuit voltage is ca. 0.2 V lower than the theoretical cell potential
[3]. According to Bockris and Srinivasan, this discrepancy is due to presence of impurities which undergo anodic oxidation causing a mixed potential [2]. Comparing IR-compensated polarization curves measured with pure oxygen provides information on the changes in the activation overpotential, i.e. condition of the MEA. Increase in activation overpotential indicates a reduction in active catalyst area, implying MEA drying out or catalyst contamination. Drying out of the electrodes decreases the active area as the protonic resistance of the ionomer part of the electrode rises [35].
The effect of diffusion overpotential can be seen by comparing the IR-compensated polarization curves measured with air and pure oxygen. Using pure oxygen removes the mass transfer limitations related to dilution of oxygen by nitrogen, but obstruction of diffusion paths or dilution by water vapor is still present to some extent. Furthermore, using pure oxygen lowers the activation overpotential, since the ORR exchange current density is dependent on the oxygen concentration [30], but confusing activation overpotential with diffusion overpotential is not very likely, since the phenomena occur at the opposite ends of the current density scale. Increased diffusion overpotential is an indication of flooding either on the electrode surfaces or in the gas diffusion layers, or both.
1.4.3 Water management
One of the primary challenges in attaining an optimal performance of PEMFCs is maintaining MEA water balance. Water content of the MEA and the gas diffusion layers has an effect on several overpotentials and loss mechanisms. The cell performance can be adversely affected by both drying out and flooding.
of the membrane drops with a concurrent decrease in the protonic conductivity and thus the cell resistance increases. Therefore, the performance of the fuel cell decreases rapidly when the water content of the MEA drops. Furthermore, drying out of the MEA increases also the activation overpotentials. The reactions take place on the three-phase interface in the electrode and drying out of the ionomer phase renders some of the three-phase interface sites unavailable due to ionomer resistance [36]. That has an adverse effect on the reaction kinetics
[35].
On the other hand, also excess water is a problem. When the water removal is not efficient enough, excess liquid water in the cell may prevent reactant diffusion to the catalyst sites by flooding the electrodes, gas diffusion layers, or gas channels. This increases diffusion overpotentials. In addition, water drops in the flow channels can interfere with the reactant flow.
In an operating fuel cell, water management and thus controlling the membrane hydration state is very complex and interconnected. Membrane hydration state is dependent on various parameters: current density, temperature, reactant flow rates, pressures and humidification, cell design, and component materials.
1.4.3.1 Water transport processes
Water in a PEM fuel cell can originate from two sources: humidification of the reactant gases or the cathode reaction. The amount of water fed into the cell by humidified reactant gases depends on the gas temperature, pressure and flow rate, whereas water production on the cathode depends only on the current density, to which it is directly proportional.
In a PEM fuel cell water is transported along the gas channels, but also through the membrane and the electrodes. Two transport processes, which are schematically represented in Figure 1-6, occur in an ionomer membrane.
When current is drawn from the cell, protons migrate through the membrane from the anode to the cathode and carry water molecules with them. The process is called electro-osmotic drag and the average number of water molecules carried over by one proton is called the electro-osmotic drag coefficient. When the concentration of water differs across the membrane, the concentration gradient drives the diffusion of water through the membrane. This process is called the back diffusion.
The electro-osmotic drag together with the production of water by the cathode reaction results in accumulation of water at the cathode. From the cathode, water is either transported to the flow channel through the gas diffusion layer or diffused through the membrane towards the anode due to the water concentration gradient. Depending on the water concentrations, water may also diffuse from the anode to the cathode. The effective net drag coefficient, i.e. the combined effect of electro-osmotic drag and back diffusion, was recently measured for a wide range of operating conditions by Janssen and Overvelde [37].
Water is removed from a PEM fuel cell by the reactant streams. Liquid water drops are pushed along the channels, and undersaturated reactant gases pick up water vapor. The rate of
and cell design. Temperature and operating pressure have a substantial effect on water evaporation and vapor pressure, and thus to the water vapor content of the reactant gases. Therefore, the efficiency of water removal strongly depends on the operating temperature. The ratio of liquid and gaseous water is dictated by the operating temperature and the humidity of input reactant gases. Reactant pressure and flow rates change the mass transfer conditions in the gas diffusion layers and the flow channels.
It must be noted that water management conditions change along the flow channel. Dry reactant gases pick up water vapor and the water vapor of supersaturated gases condenses on the channel walls and the gas diffusion layer. Thus, the amount of water carried by the reactant stream and the ratio of liquid and gaseous water are different in the different parts of the flow channels.
1.4.3.2 Water management methods
Using humidified reactant gases is necessary when the reaction product water is not sufficient to keep the membrane hydrated. The need for external humidification arises usually from drying out of the anode. That occurs, when the electro-osmotic drag is stronger than water back diffusion, leading into net flux of water from the anode to the cathode side and distorted hydration profile. Thick membranes aggravate the problem, since they require more water to remain hydrated and make the diffusion driving concentration gradient less steep.
The anode can easily be kept humidified by controlling the hydrogen humidification temperature, but water removal conditions on the cathode should be carefully controlled. Water production together with electro-osmotic drag and humidified cathode gas lead easily into accumulation of water and flooding of the electrode or the gas diffusion layers.
Reactants are usually saturated with water vapor by leading them through water bottles. The humidity can be controlled by changing the humidification bottle temperature. Usually
the humidification temperature of the reactant gases is kept above the operating temperature of the cell to ensure that liquid water is formed by the condensing water vapor carried by the reactants. Furthermore, the membrane easily loses water to unsaturated gases.
Membranes that can be operated on dry gases are usually thinner than the membranes that require reactant humidification. Thin membranes require less water to remain hydrated and due to the steeper water concentration gradient, back diffusion is strong enough to keep also the anode humidified with reaction product water [38]. In addition, embedding catalyst particles into the membrane has been suggested.
Reactant molecules that diffuse into the membrane react on the catalyst particles, keeping the membrane humidified with reaction product water [39].
With regard to the water management, the gas diffusion layers play an important role in both externally humidified and dry reactant cells. Intrinsic gas diffusion layer properties, e.g. porosity and balance of hydrophobic and hydrophilic components, have an effect on the water removal from the electrodes. Water transport in the cell can be altered by the choice of gas diffusion layers: Water content on the electrodes, and thus the water concentration gradient, depends on the properties of the gas diffusion layers.
Flow channel geometry has an effect on the flow rates and the diffusion properties. The flow velocity is inversely proportional to the square of the channel cross-sectional area, and the channel ridge width determines how easily reactants diffuse to the electrode area under the ridge and reaction products reach the flow channel [40], [41].
Maintaining a sufficient hydration level at all times throughout the MEA is difficult for a number of reasons. At low current densities, when little water is produced by the cathode reaction, the membrane water content will tend to drop even when using fully humidified reactants because the water uptake of a vapor equilibrated membrane is less than water uptake
to anode may not be enough to compensate the electro-osmotic drag of water with the proton flux from the anode to the cathode and the anode tends to dry out. To prevent the MEA from drying out, the reactants are usually humidified before entering the fuel cell.
The cathode may flood because of the water generated in the cathode reaction as well as the water dragged across the membrane, if the water removal is not adequate. Flooding of the anode can usually be prevented by controlling the humidity of the fuel. In addition, fuel cell water management and operating conditions are interconnected. Changes in cell temperature, reactant flow rates, reactant humidification levels, or electric current have an effect either on water production or water removal.
Water management in a fuel cell stack is more complex than in a unit cell. To ensure similar water removal conditions for each unit cell in the stack, the unit cells are usually connected to the gas inlet in parallel. Connection in series would easily lead into water accumulation and reactant starvation in the cells closer to the gas outlet.
1.5 Basic theory and technology
1.5.1 Micro-fabrication technology
In this study, the silicon membrane is fabricated by semiconductor processes which include PECVD, photolithography and RIE. The introduction of them will be shown as follow:
1. Plasma-Enhanced Chemical Vapor Deposition (PECVD)
PECVD is an excellent alternative for depositing a variety of thin films at lower temperatures than those utilized in CVD reactors without settling for a lesser film quality. For example, high quality silicon dioxide films can be deposited at 300 to 350 degrees centigrade while CVD requires temperatures in the range of 650 to 850 degrees centigrade to produce similar quality films.
PECVD uses radio-frequency (RF) power supply which provide RF electromagnetic wave (13.56GHz) generate a glow discharge (plasma) in which the energy is transferred into a gas mixture. This transforms the gas mixture into reactive radicals, ions, neutral atoms and molecules, and other highly excited species. These atomic and molecular fragments interact with a substrate and, depending on the nature of these interactions, either etching or deposition processes occur at the substrate. Since the formation of the reactive and energetic species in the gas phase occurs by collision in the gas phase, the substrate can be maintained at a low temperature. Hence, film formation can occur on substrates at a lower temperature than is possible in the conventional CVD process, which is a major advantage of PECVD. Internal part of chamber is constructed by two electrodes up and down usually made by aluminum, and the wafer is put on the down. When an applied RF voltage exists between the two electrodes, there is a phenomenon of glow discharge between two electrodes. Process gases mixture flow from up electrode into the region of glow discharge between two electrodes, and waste gas is pumped to scrubber by air-extracting pump. The applied gases are in common usage, such as O2, NH3, N2O, Ar, CH4, CF4 and H2. Figure 1-7 is the schematic
diagram of a PECVD.
Some of the desirable properties of PECVD films are good adhesion, low pinhole density, good step coverage, and uniformity.
2. Photolithography
Photolithography process is extensively used in Very Large Scale Integration (VLSI) or microelectromechanical (MEMS) fabrication technologies, and it can transfer the pattern of a mask to photoresist (PR). To prevent the PR peel off substrate during the developing or etching processes, hexamethyldisilazane (HMDS) is widely used in the semiconductor industry to improve photoresist adhesion. A photoresist typically consists of three components: resin, solvent and sensitizer. Resin is a binder that provides mechanical properties to be the etching mask, sensitizer is photoactive compound that govern the sensitivity of PR, and solvent can keep the resist liquid and adjust the viscosity of PR.
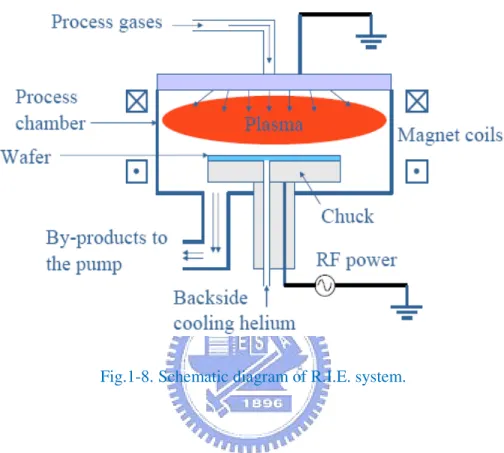
3. Reactive ion etching (R.I.E)
The purpose of the Reactive Ion Etch (R.I.E) machine is to etch holes and lines in silicon wafers that have straight walls and a flat bottom. It does this using a gas in plasma state. Since the gas is in plasma form, it is ionized and the individual plasma molecules are then accelerated by an electric field toward the surface of the substrate. Upon striking the surface, they bind with a molecule of the substrate, and then the new electrically neutral molecule
Fig.1-7. Schematic diagram of a PECVD.
Plasma
RF
floats away. This causes the trench to be evenly etched, with vertical walls and flat floors. Figure 1-8 is the schematic diagram of R.I.E. system.
1.5.2 Anisotropic etching of single crystal silicon
Bulk micromachining was commenced to develop around in 1970s, distributed to the technology of the anisotropic etching of single-crystal silicon, etching stop, and the protection of etching mask. It was initially applied to an integrated circuit and gradually to the fabrication of microelectromechanical systems (MEMS). Figure 1-9 shows the schematic
diagram of bulk micromachining.
The anisotropic etching of silicon is an ubiquitous process in micromachining. Complex micro-systems can be generated using the anisotropic properties of single-crystal silicon in an orientation dependent dissolution reaction. V-groove structures for example, useful for the
like KOH or tetramethylammonium hydroxide (TMAH). Modern exacting demands in this rapidly growing industry require a fundamental understanding of these processes in order to achieve a well defined anisotropic ratio and a good surface finish.
1.5.2.1 Crystal structure of silicon
The crystal structure of single-crystal silicon belongs to isometric system. Each silicon atom has four covalent bonds and connects with other atoms to form the structure of regular tetrahedron. Under the condition of atmospheric temperature and pressure, the tetrahedron arrange in order of periodicity to form diamond cubic structure [43], as shown in Figure 1-10.
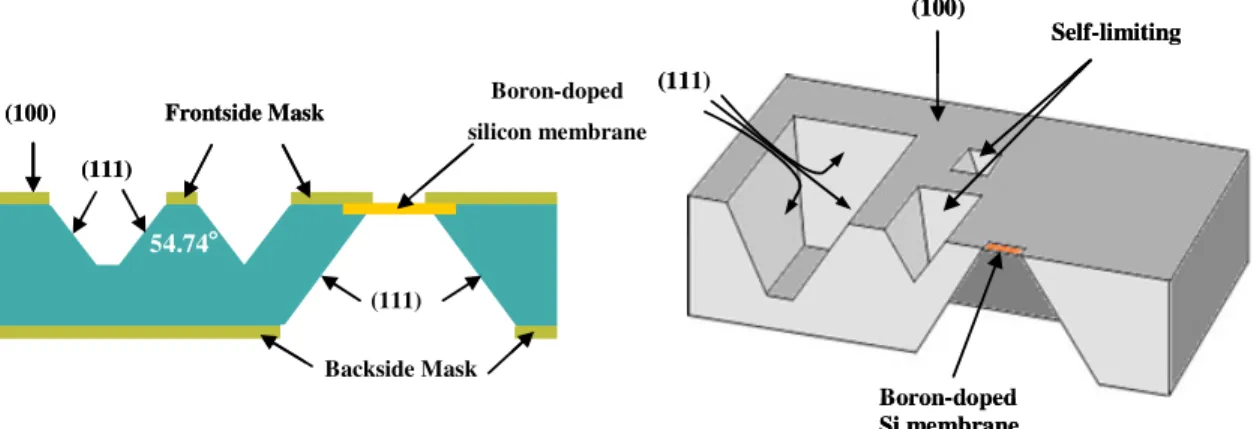
Miller indices are a notation used to describe the lattice planes and directions in a crystal. Figure 1-11 shows Miller indices of the planes in cubic crystal in common use.
Fig.1-9. Schematic diagram of bulk micromachining.
(100) 54.74°°°° Backside Mask (111) Boron-doped silicon membrane (111) Frontside Mask (100) 54.74°°°° Backside Mask (111) Boron-doped silicon membrane (111) Frontside Mask (111) (100) Self-limitingetches Boron-doped Si membrane (111) (100) Self-limitingetches Boron-doped Si membrane
1.5.2.2 Basic concept of anisotropic etching
Due to the crystallization of single-crystal silicon is diamond cubic structure, in some particular etchants, KOH, EDP or TMAH for example, etching rate of the different crystal surface are difference. This characteristic is called anisotropic etching [44].
Among basic three lattice planes (100), (110) and (111), the etching rate of plane (111) is the lowest. In particular temperature and concentration of KOH solution for example, the ratio of etching rate to plane (100) and (111) even can reach 400:1.
The principal explanation for the etching rate difference between lattice plane (100) and (111) is provided as follow:
Fig.1-11. Miller indices of the different planes in cubic crystal. Fig.1-10. Schematic diagram of Si lattice structure.
and hydroxide ion. The closer the arrangement between silicon atoms, the stronger influence caused by screening effect. In lattice plane (111), the arrangement between the silicon atoms is closer, so the etching rate is lower.
2. On the lattice plane (111), each silicon atom possesses three covalent bonds to connect with other atoms inside the lattice plane and one dangling bond exposed outside. On the lattice plane (100), each silicon atom possesses two covalent bonds and two dangling bonds. When the reaction is carried out, the hydroxide ions in etchant bind to dangling bonds to form the phenomenon of etching. Therefore, the more the dangling bonds on the lattice plane per unit area, the faster the chemical reaction spontaneously as shown in Figure 1-12. For example, on the plane (100), there are around 1.36x10¹⁵ dangling bonds per centimeter square; on the plane (111), around 0.78x10¹⁵ dangling bonds per centimeter square [45], [46].
Fig.1-12. Dangling bond at the Si atom react with OH – (a) lattice plane (111) (b) lattice plane (100).
Si
Si
Si
Si
+ OH-Si
Si
Si
SiOH
+e
-(a)Si
Si
Si
+2
OH-Si
Si
Si
OH
+2
e
-OH
(b)From another perspective, more covalent bonds inside the lattice plane (111), more active energy (Ea) is needed to bring the silicon atom out of the lattice plane during the etching
process; the etching rate is slow comparatively from the mechanism of active reaction [47], [48]: ( E /kT) 0 a
e
R
R
=
−where R0 is a constant related to material and crystal direction. T and k is Kelvin temperature
scale and Boltzmann constant, respectively. From above formula, a little difference of the active energy (Ea) at the constant temperature make the reaction rate has a rather great
difference immediately.
Due to the characteristic of single-crystal silicon in particular etchant, a variety of trenches, holes and other structures can be formed on the wafer. As shown in Figure 1-13, for (100)
orientation silicon wafer, a V-groove structure with 54.74° (111) sidewall angles relative to the (100) surface can be formed; for (110) orientation wafer, a 90° trench is formed [49].
The description of the (100) orientation silicon wafer etched by aqueous KOH with chemical formula is provided as follow [50]:
Fig.1-13. Anisotropic etching of (100) and (110) orientation Si wafer.
Si wafer Si wafer (b) (110) Si wafer (a) (100) Si wafer SiO2or Si3N4 SiO2or Si3N4 (111) (100) (111) (100) Si wafer Si wafer (b) (110) Si wafer (a) (100) Si wafer SiO2or Si3N4 SiO2or Si3N4 (111) (100) (111) (100)