國
立
交
通
大
學
管理科學系
碩
士
論
文
探討台灣時尚服飾
不同年齡層之女性顧客忠誠度變化
Variation in Brand Loyalty by Age for
Taiwanese Female Luxury Clothes Buyers
研 究 生:貝莎娜
指導教授:張力元 教授
探討台灣時尚服飾不同年齡層之女性顧客忠誠度變化
Variation in Brand Loyalty by Age for
Taiwanese Female Luxury Clothes Buyers
研 究 生:貝莎娜 Student:Oksana Bilozerova
指導教授:張力元 Advisor:Charles Trappey
國 立 交 通 大 學
管 理 科 學 系
碩 士 論 文
A ThesisSubmitted to Department of Management Science College of Management
National Chiao Tung University in partial Fulfillment of the Requirements
for the Degree of Master
in
Management Science
April 2010
Hsinchu, Taiwan, Republic of China
iii
TABLE OF CONTENTS
LIST OF TABLES vi
LIST OF FIGURES vii
ABSTRACT vii
CHAPTER 1. INTRODUCTION 1
1.1. Research Motivation 1 1.2. Research Objectives 2 1.3. Research Procedures 2 1.4. The Structure of Study 4
CHAPTER 2. LITERTURE REVIEW 5
2.1. Global Luxury Goods Market 5 2.1.1. Asian Luxury Market 7
2.1.2. Taiwan Marketplace 8
2.2. Luxury Goods and Fashion: Definition 10
2.3. Fashion Fanship 12
2.4. Brand Loyalty 13
2.5. Taiwanese Women 15
2.5.1. Generational Cohorts 17
CHAPTER 3. RESEARCH DESIGN AND METHOD 20 3.1. Conceptual Framework and Hypotheses 20
3.1.1. Conceptual Framework 20 3.1.2. Hypotheses 21
3.2 Definitions of Research Variables and Questionnaire Creation 22 3.2.1 Fashion Fanship 22
3.2.2 Brand Loyalty 23 3.2.3 Demographic Variables 23
3.3 Questionnaire Survey and Sampling Plan 24 3.4 Data Analysis Procedures 24
CHAPTER 4. RESEARCH RESULTS AND ANALYSIS 25 4.1 Characteristics of Cohorts 25
iv
4.2 Data Analysis and Results 29
4.3. Hypotheses Testing 39
CHAPTER 5. CONCLUSIONS AND DISCUSSIONS 41
5.1 Contributions 42
5.2 Limitations 42
5.3 Recommendation and future work 42
v
APPENDIX A: Questionnaire English A-1
vi LIST OF TABLES
Table 2-1 Attitudinal Approach Definitions of Brand Loyalty 14 Table 2-2 Behavioral Approach Definitions of Brand Loyalty 14 Table 3-1 Measurement Items of Brand Loyalty 23
Table 4-1 ANOVA Result 25
Table 4-2 General Characteristics of the Sample 27 Table 4-3 Fashion Involvement Index by Cohort 29 Table 4-4 Fashion Involvement Factor by Cohort 31 Table 4-5 Total score of Fashion Involvement by Cohort 34 Table 4-6 Level of Fashion Fanship by Cohort 34 Table 4-7 Quantity rates of Brands by Cohort 35 Table 4-8 Brand Loyalty by Cohort 36
Table 4-9 Stage of Brand Loyalty 38
vii LIST OF FIGURES
Figure 1-1 Flow Chart of this Research 3 Figure 2-1 Worldwide Luxury Goods Market trend 1995-2009 (€ Billion) 5 Figure 2-2 Worldwide Luxury Goods Market by Area (2009) 6 Figure 2-3 Worldwide Luxury Goods Market by Category (2009) 6 Figure 3-1 Conceptual Framework of this Study 20 Figure 4-1 Monthly income level cross table 26 Figure 4-2 Experience purchased High Fashion Clothing by Cohort 26 Figure 4-3 Quantity rates of Brands by Cohort 36
viii
Variation in Brand Loyalty by Age for Taiwanese Female Luxury Clothes Buyers
Graduate Student: Bilozerova Oksana Advisor: Professor Charles V. Trappey
ABSTRACT
This study aims at investigating the relationships among fashion fanship, women age cohort and brand loyalty of high Fashion brand clothing in Taiwan. The effect of satisfaction works on brand loyalty is tested. Besides, the effect of fashionability is examined, too. This research also attempts to provide beneficial suggestions and implications for marketing practitioners.
This study use face-to-face interviewing method of collecting information questionnaire survey to potential luxury clothes buyers. Total was collected 180 effective survey of females aged from 18 years old. ANOVA, Correlation analysis and Confidence Interval methods comparison are applied to verify the proposed hypotheses.
Significant evidences are found in four hypotheses out of eleventh. Fashion fanship is proved to have a significant negative result with brand loyalty try Generation Y and opposite Elder Generation showed significant negative result with Fashion fanship. The Open Generation didn’t show any significant result, but was observed interest in fashion and cognitive loyalty to high fashion brands. In addition, the study provides prove significant differentiation between Generation Y and Elder Generation of Taiwanese female.
Research conclusions indicate that Open and Elder Generation are brand loyal. At the same time Elder Generation show weak interest and nonchalance for fashion. Compared with those two cohorts Generation Y show affective loyalty and is on the verge of fashion fanatic and strong fashion interest. Evidences also show that Age Cohort can be the main factor in
researching brand loyalty for luxury goods (high fashion clothing), which suggests firms should pay extra attentions on consumer age segment during brand building.
Keywords: Taiwanese female, Luxury market, Cohort, Brand Loyalty, Taiwan, Fashion
1
CHAPTER 1. INTRODUCTION
This first chapter will introduce the motivation of choosing research area and summary explain all procedure of this study. This chapter includes next items, such as research motivation, research objectives, research procedures that include Flow Chart of this Research and explaining of Structure of Study.
1.1 Research Motivation
To satisfy customers is becoming a much more difficult task in modern world. What consumers want and how they think are doubtlessly the most frequently asked questions by companies, especially on Luxury Fashion market. The complex mentality of the consumer make profitability unstable and companies need to find a proper link between product and consumer, between the brand and the buyer. The loyal customers are helping expand the market shares of company, but how should firms act to create or maintain this wealth. One option is through brand management. Brand serves as a mark that imprints on consumers’ minds. And if we talk about brand, the main criterion is Brand loyalty. Brand loyalty is the ultimate goal a company sets for a branded product, such as Fashion clothing. This study focuses on brand loyalty and consumer cohort’s sensitive for brand and Fashion.
Loyalty is one of the main aspects of brand equity and this statement catalyzes research motivation of brand loyalty. This study assumes brand loyalty will eventually contribute to profitability; in addition, through a better understanding of brand loyalty, a firm can perform marketing strategies more accurately. There are three main items in this study; brand loyalty, customer’s cohort and fashion fanship. Being motivated by marketing theories and practices, this study attempts to verify a presumed framework comprises these three notions within specific product to see if satisfying conclusions can be achieved. This research selects three groups of Taiwanese women (by age) and Luxury fashion clothing as research objective. This study didn’t focuses on the brand’s name of fashion clothing in Taiwan, searching the loyalty to high fashion brand generally and hopes to provide some suggestions for companies through research conclusions.
2
1.2 Research Objectives
Objectives of this study are threefold. First, this study wants to investigate if the presumed distinctive feature between different Taiwanese women cohorts. Besides, find the quantity of Taiwanese women sensitivity for Fashion. Third, interrelationships among brand loyalty, women cohort and fashion fanship are inspected as well.
This research tries to identify:
(1) If fashion fanship impose significant influence on brand loyalty. (2) If age cohort impose significant influence on brand loyalty. (3) If cohort impose significant influence on fashion fanship.
(4) To examine if there are significant casual relations among Taiwanese women cohort, fashion fanship and brand loyalty.
1.3 Research Procedures
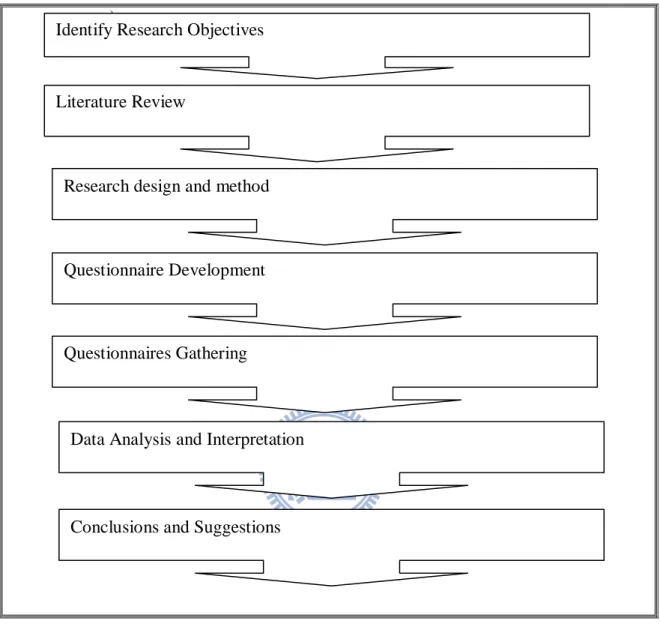
Research procedures of this study are divided into nine stages. The quest to
research conclusions starts from identifying research objectives, followed literature review, conceptual framework construction, questionnaire development, questionnaire gathering, data analysis and interpreting. The research procedures are presented as a flow chart illustrating by Figure 1-1.
3
)
Figure 1-1 Flow Chart of this Research Identify Research Objectives
Literature Review
Research design and method
Data Analysis and Interpretation Questionnaire Development
Questionnaires Gathering
4
1.4 The Structure of Study
The research procedures proposed in this section break this study into five chapters with several sections. Following summarizing these chapters. In the first part of this thesis, research motivation is described. Follows intended research objectives of this study and research procedures. Chapter 1 ends with thesis structure. Chapter 2 contains description of Luxury Fashion market, definition of Fashion clothing, historical literature reviews and summaries of three main items of this study. They are brand loyalty, Taiwanese women cohort and fashion fanship. The aim of this chapter is to explicate every item in this study.
In chapter 3, research design and methods are described. Section one proposes the conceptual framework of this study and research hypotheses. Follows operational variables with items used in questionnaire survey. The ensuing part is questionnaire design, sampling, and questionnaires gathering.
Chapter 4 consists of data analysis and interpretation.
This chapter represents all data analyses and results, shown the Fashion Involvement Factor, the Fashion Involvement Factor and the Brand Loyalty scores.
Chapter 5 Conclusions and suggestions
In the last chapter of this study, research conclusions derived from former chapters are proposed; follows the analysis results of all hypotheses and discussions.
5
CHAPTER 2. LITERATURE REVIEW
This Chapter has explaining of Luxury market globally and concentrate on Taiwan marketplace. Also will observed researches that were dot in this area before. This part contains description of Luxury Fashion market, definition of Fashion clothing, historical literature reviews and summaries of three main items of this study. They are brand loyalty, Taiwanese women cohort and fashion fanship. The aim of this chapter is to explicate every item in this study
2.1. Global Luxury Goods Market
Globally, the luxury goods market has been on an upward climb for many years. In 2009 the world luxury goods market; which includes fashion, cosmetics, fragrances,
watches, jewelry, luggage, and handbags approached a total value of €168 billion (NTD 7131 billion).
Figure 2-1 Worldwide Luxury Goods Market trend 1995-2009 (€ Billion) Source: Bain & Company, Bain’s Luxury Market Update, Report, February 2010
6
The top ten markets for luxury goods include the U.S., Japan, China (and Hong Kong), Germany, Italy, France, UK, Brazil, Spain, and Switzerland (Figure 2-2). From all categories of Luxury Goods Clothing (Figure 2-3) still more demand on market (Bain & Company (2010). The Figure 2-2 shown that’s the biggest market of luxury goods is Europe and consisted 38% of all luxury goods. The second biggest market is Americas markets with 33%. Other growing markets of luxury goods are Japan 12%, Asia-Pacific 12% and rest of World 5%.
Figure 2-2 Worldwide Luxury Goods Market by Area (2009) Source: Bain & Company, Bain’s Luxury Market Update, Report, February 2010
The Figure 2-3 illustrated that’s the most demanding luxury goods is apparel, which occupied 28% of all luxury goods. The second most popular luxury goods are perfume and cosmetics with 24%. Other goods are accessories 22%, hard luxury 21% and art de la table 3%.
Figure 2-3 Worldwide Luxury Goods Market by Category (2009) Source: Bain & Company, Bain’s Luxury Market Update, Report, February 2010
7
2.1.1. Asian Luxury Market
More than half of the luxury goods market business comes from Asia with the purchase of luxury goods an intriguing social reality, a profitable business phenomenon and with Asians penchant for shopping abroad. Compare to Western Luxury Goods market Asian advanced not so quickly. In the 1980s, Japan experienced rapid developments in its electronics and automobile productions which spurred it towards the position of world economic power. At the same time, Japanese fashion designers opened couture and ready-to-wear houses in the major fashion centers of Paris, New York and other cities worldwide (Eubank and Tortora, 2005). In the 1983 Paris pret-a-porter show, Japanese designers such as Issey Miyake and Rei Kuwakubo presented designs that were
considerably different from the prevailing fashion trends and attracted the interest of international fashion followers. This brought global attention to Japan and started its rise as an upcoming major Asian fashion center.
In the ranking of Top Fashion Cities in 2007 by Global Language Monitor, three Asian countries have made it to the top ten. They are Tokyo in sixth position, Hong Kong in eighth and Singapore in tenth position (GLM, 2007). These three cities have been increasingly recognized as fashion centers throughout the world in recent years. As newly industrialized cities such as Hong Kong and Singapore begin to develop their fashion industries and take advantage of changing circumstances and new opportunities. Emerging markets will also see the greatest growth in new openings of directly-operated stores (DOS). Of the 300 estimated store openings globally in 2009, 15% will be in mainland China, 25 % elsewhere in Asia, 30% in the Middle East, and 15% in Eastern Europe and Central Asia. The remaining 15% will largely come from the U.S. and the rest of the world (Bain&Company, 2009). The country such as Taiwan, Singapore and Southeast Asian countries are still relatively small luxury markets, but there is a select group of extremely wealthy business families, mostly of Chinese origin, who regularly have shopping trips abroad, either in Hong Kong, Singapore, or Europe (Chadha, 2006).
Asia is the largest target market for luxury brands, accounting for more sales than any other region, including Europe and the United States. Demand for luxury and fashion
8
products has traditionally been regarded as changeable and highly susceptible to swings in economic sentiment. However luxury brands have now enjoyed many successive years of growth. Sales of global fashion brands are expanding rapidly in growing Asian because young consumers in those countries are brand and fashion conscious (Bryck, 2003; Morton, 2002; O’Cass, 2008). Consumers prefer brands with a global image, even when quality and value are not objectively superior. For these reasons, companies readily consider entering the global brands market (Taylor and Raymond, 2000). In order to enter the market, a company needs to identify the response of consumers worldwide to its global advertising for a specific consumer segment. Although several researchers have suggested the need to cross-culturally analyze reactions to different types of advertisements (Yoo and Donthu, 2002), few studies have been undertaken to assess differences in consumer attitudes toward global advertisements based on segments that cut across nations.
Bain also predicted global luxury trends for 2010. Growth in China, South Asia and Central Asia may cause Asia to overtake Europe and the Americas as the largest global luxury market region. Asia's diversity (more than 15 countries, more than 300 cities, and more than 50 million consumers) will stretch luxury brands' marketing and supply chain capabilities (Bain&Company, 2009).
2.1.2. Taiwan Marketplace
After decades of efforts devoted to economic development, people in Taiwan are devoting more attention and expense to life-style pursuits. With increasing living standards and per capita income, local people are enjoying fashion in life and can afford the purchase of comfortable and fashionable wear for both leisure and work. Fashion goods are now the largest segment of the apparel market in Taiwan. In recent years, imported goods have met about 94 percent of the demand for luxury items (Taiwan Textile Federation, 2008).
In 2007, according to the Directorate General of Budget, Accounting, and Statistics, consumers spent over NT$346 billion on clothing, or close to one hundred times more than what they spent in 1961. It’s important and that fact that Taiwan is very young player in Fashion industry. Taiwan's first fashion design department was established in Shih Chien
9
College (now Shih Chien University) in 1961. The 1970s was also a decade of political frustration for Taiwan. Diplomatic setbacks such as the loss of the United Nations seat forced people to reexamine their identity and culture, and some local designers used this
opportunity to attempt to establish their own brand names. The lowered profile in the international political arena, however, did not slow down Taiwan's economic activities with foreign nations. The Westernization of the local fashion scene continued as overseas
brand-name companies recognized the island's consumer potential. In 1974, Christian Dior became the first prestigious international label to set up a Taipei boutique for men's and women's apparel and accessories. That was huge step for education Taiwanese customers. When the government lifted its ban on outbound tourism in 1979, the island's purchasing power was well demonstrated by its shopping tour groups, which attracted the attention of other big-name labels and encouraged them to capture a share of the market (Chang, 2009). Local spending on clothing increased from NT$7 billion (US$203 million) in 1971 to NT$46.5 billion (US$1.3 billion) in 1981 and of course non included shopping tour spending (Taiwan Textile Federation).
As the local market developed, department stores replaced consignment stores in playing a major role in imported high fashion. An example is Sunrise Department Store which was one of the first to establish itself as a leader for high-fashion shopping. In 1991, the company turned its purchasing department into a separate business entity, Chung Hseng Corp., completely autonomous in matters of financing, management, and the marketing of imported brands. Chung Hseng then licensed the franchise rights to a portfolio of popular name brands. Chung Hseng acts as an agent for such recognized names as Giorgio Armani, Emporio Armani, Dolce & Gabbana, Genny, and Byblos. (Hung, 2006). Not all overseas designs attract Asians, but this did not cause much trouble in Taiwan. In his interview for icon magazine Vogue, the section chief in Chung Hseng's sales department said, that 2002 – 2004 was years when a lot of people were obsessed with name brands. All that was mattered was wearing the same brand from head to toe, inside and out - with a huge logo on everything. People get high price fashion brand goods, but didn’t have enough knowledge about these (interview for Vogue, 2004). According to the Taiwan Textile Federation, the total import
10
value of apparel increased from NT$25.9 billion (US$843 million) in 2000 to NT$34.95 billion (US$1.06 billion) in 2007.
2.2. Luxury Goods and Fashion: definition
Luxury goods are said to have high income elasticity of demand since as people become wealthier, they will buy increasingly more luxury good. This also means that if there is a decline in income, demand for luxury will drop. Income elasticity of demand is not constant with respect to income, and may change with different levels of income. That is to say, a luxury good may become a normal good or even an inferior good at different income levels. Although the technical term luxury good is independent of the goods' quality, they are generally considered to be goods at the highest end of the market in terms of quality and price (Cumming, 2004).
A review of academic literature shows three interrelated perspectives that were used to study and to define luxury brands, such as economic, psychological and marketing: Initially economic theories focused on distinctions between luxury and necessity. Veblen was one of the first who analyzed luxury goods in the social economic context in his celebrated ―The Theory of the Leisure Class‖ (Vigneron and Johnson, 1999). Nowadays the primary focus of economic theory is the influence of pricing strategies on exclusivity of luxury goods. Luxury is strongly associated with high or exclusive pricing. Social and behavioral psychology defines luxury by defining consumption motivations based on interpersonal or external factors. These factors include opinions, influences, approval, and suggestions of or interaction with others: Personal or internal factors, such as feelings and emotions are also included since they stimulate luxury brand consumption. Luxury goods are consumed either for social recognition or status, provide positive impressions and provide hedonic and pleasure-seeking benefits (Vickers and Renand, 2003). Marketing theories on luxury brands are grounded on economic and psychology theories. This theories differentiate luxury goods from non-luxury ones, as well as define the salient product features that constitute luxury. Vickers and Renand (2003) developed a three dimensional model differentiating luxury brands from non-luxury ones based on the symbolic meanings
11
of luxury brands in terms of functionalism, experientialism and symbolic interaction. Functionalism is defined as product features that solve a current problem or prevent a potential one and are related to superior quality and strength, durability, confidence of items replacement. Experientialism incorporates features that stimulate sensory pleasure and hedonic consumption and include traditional and exclusive designs, special richness and tone of decoration, and elegance of days gone by. Symbolic interaction relates to product components that include status, self-enhancement, and group membership, such as prestigious name or recognizable designer style.
Classic luxury goods include haute couture clothing, accessories, and luggage and as such a significant segment of luxury goods are also recognized as Fashion (Cumming, 2004). Clothing has always been a strong indicator of social identity, social class, self-image, and climate. Thus, fashion is deemed to be a reflection of social, cultural, and environmental characteristics that are unique to a certain point of time in a particular geographical setting, in addition to playing a crucial role in complementing one’s self-image (Au et al., 2000). Clothing is a fashion product that is influenced by social trends and global economic environments. The term Fashion means new to market and clothing innovation. This linguistic term originated during the Industrial Revolution with designers demonstrated novel ways to use new textiles. People continually change the style of clothing worn, especially among urban populations. This behavior is generally held by historians to be a distinctively Western one. Fashions vary considerably over time within a society according to age, social class, generation, occupation, and geography. Fashion is social phenomena and luxury goods are a critical aspect of the fashion goods market.
At generalized level, the term fashion is often used to denote trends in consumerism (Bakewelletal.,2006). The notion of fashion also include consumption behavior that displays individuals’ tastes and values to others, given that fashion styles are usually accepted by a large group of people at a particular time and signify both social identification and distinction. This term further refers to clothing and other physical and material objects put on the human body. The term fashion can be applied to all aspects of someone’s personal appearance that provide both hedonic and utilitarian value to the consumer (Bannister and Hogg, (2004).
12
2.3. Fashion Fanship
It is recognized that the value regarding fashion purchases is strongly related to the extent to which a consumer is engaged with and devoted to consuming fashion. Such attentiveness to fashion may be described as an individual’s interest in and attention to the latest trends. Often termed fashion consciousness and used to measure a person’s perceived degree of fashionability, this consciousness combines the hedonic, cognitive, affective and behavioural aspects of fashion (Bakewell, (2006). This consciousness is related to concepts such as fashion awareness, innovativeness and leadership. Fashion involvement is similar to fashion consciousness and refers to the extent to which an individual is caught up in a number of fashion marketing concepts, including awareness, knowledge, interest and reactions. Given this range of concepts, fashion can become a central focus for a meaningful and engaging activity in an individual’s life (O’Cass, 2004). For example, O’Cass (2004) discussed that the continual and cyclic nature of fashion means that people are often drawn in to the style of the moment and such consumers place great emphasis on their clothes being fashionable. Redden and Steiner (2000), who work for research into how consumer behaviour can be measured or interpreted in terms of the level of fanaticism involved and also suggesting that fanatical behaviour retains aspects of normal behaviour, based on the degree of enthusiasm, excitement, passion and commitment and/or extremes to which an individual is prepared to go to consume an identified product or service.
Researching branding, they suggest behaviours such as loyalty or worshiping potentially indicate a fanatical consumer. Thus, higher degrees of fanship can relate to brand loyalty. But need to argue that fans show distinctive behaviour that means they are not necessarily fashion leaders but very enthusiastic fashion followers. To test the fashion fanship in this study, the following hypothesis is stated:
H1a. Fashion fanship will have a significant positive relation of low levels of brand loyalty.
13
2.4. Brand Loyalty
In general, brand loyalty is understood to describe the characteristics of those consumers who have a strong commitment to a brand, because they view that brand as being more satisfactory than the alternatives and this evaluation is reinforced through repeated use (Day, 1969; Jacoby & Chestnut, 1978). In marketing, brand loyalty consists of a consumer's commitment to repurchase or otherwise continue using the brand and can be demonstrated by repeated buying of a product or service (Dick and Basu, 1994) or other positive behaviors such as word of mouth support. Loyalty is viewed as the strength of the relationship between an individual’s relative attitude and repeat patronage. Oliver (1999) defines brand loyalty as a deeply held commitment to re-buy or re-patronize a preferred product consistently in the future, thereby causing repetitive same-brand or same brand-set purchasing, despite situational influences and marketing efforts having the potential to cause switching behavior.
H1b. Fashion fanship will have a significant negative relation of high levels of brand loyalty
Jacoby and Chestnut (1978) indicate what determines the success of a brand on the long term is not based on the number of consumers that buy it once, but on the number of consumers who become regular buyers of the brand. Thus, loyalty sufficiently depicts an ultimate goal should be to seek and maintained by every practitioner. The loyalty concept can be characterized by two different streams: the stochastic approach and the deterministic approach (Odin et al., 2001). The former views loyalty as behavior and alleges that the individual who buys the same brand systematically is said to be loyal. Some researchers showing loyalty as an attitude and investigate the ―psychological commitment‖ of
consumers in the purchase regardless of purchase behaviors. This definition emphasizes the two different aspects of brand loyalty that have been described in previous work on the concept—behavioral and attitudinal (Aaker 1991; Assael 1998; Day 1969; Jacoby and Chestnut 1978; Jacoby and Kyner 1973; Oliver 1999; Tucker 1964), and are summarized in Table 2-1 and Table 2-2.
14
Table 2-1 Behavioral Approach Definitions of Brand Loyalty
Source Definition
LeClerc and Little (1997) The number of brands purchased in the previous year as a (negative) indicator of loyalty.
Lawrence (1969) A new brand as four purchases in a row.
McConnell (1968) Brand loyalty exists when a consumer selects the same brand for at least four successive trials.
Kuehn (1962) Brand loyalty can be viewed as, at least in part, a function of the frequency and regularity with which a brand has been selected in the past.
Cunningham (1956) (1) Single-brand loyalty is the proportion of total purchases represented by the largest single brand used. (2) Dual-brand loyalty is the proportion of total purchases represented by the two largest single brands used.
Table 2-2 Attitudinal Approach Definitions of Brand Loyalty
Source Definition
Oliver (1999) A deeply held commitment to re-buy or re-patronize a preferred product/service consistently in the future, thereby causing repetitive same brand or same brand-set purchasing, despite situational influences and marketing efforts having the potential to cause switching behavior.
Jacoby and Chestnut (1978) (1) biased (i.e., non-random)
(2) behavioral response (i.e., purchase) (3) expressed over time
(4) by some decision-making units
(5) with respect to one or more alternative brands out of a set of such brands
(6) a function of psychological (decision-making, evaluative) processes
Day (1969) Repeated purchases promoted by a strong internal disposition.
15
Both different views toward brand loyalty can measure customers’ repeated patronage; however, the behavioral approach seems relatively inadequate in explaining consumers’ buying behaviors are based on loyalty or habitual action. Jacoby et al. (1978) criticized the behavioral measures as lacking a conceptual basis and capturing only the static outcome of dynamic process. Brand loyalty is a construct that has both attitudinal and behavioral elements when defined as the biased (nonrandom) behavioral response
(purchase) expressed over time by some decision-making units with respect to one or more alternative brands out of a set of such brands, which is a function of psychological
(decision making, evaluative) processes. Measuring only one facet, that is, attitudinal or behavioral aspects, of brand loyalty, therefore, would result in measuring a spurious attitude (unstable attitudes that do not influence the subsequent behaviors) or a spurious behavior (inertial behaviors that are unstable and unpredictable).
In this research Female will personal analyzing their loyalty to fashion brand and the result can be generalized.
2.5. Taiwanese Women
On the 01 July 2009 the world population was 6,768 million that mean more that 3,384 million of them are women. This number presented the huge target market. Women account for 64% of the $18.4 trillion spent annually on consumer goods around the world. Pretty soon more women will be working in U.S. then men. Women already control half the wealth in the United States, and they will be responsible for roughly $5 trillion in additional earned income globally over the next five years (Silverstein, 2009).
Following INSIGHTS Report (4th Quarter 2005) by 2010, women are expected to control 60% of the world's wealth. Also Women purchase or influence the purchase of 80% of all consumer goods, including stocks, computers and automobiles. More than half of all new Web users are women. Women make 80% of all consumer purchasing decisions. Today female not only have more and more buying power, but there is a whole shift in what they are buying and why. They are buying more products and services traditionally sold to men, like cars, computers, games, hardware, liquor, and cigars (Gobe, 2001).
16
According to the Consumer Electronics Marketing Association, women are great influencers in 50 percent of all consumer electronics purchase decisions and the past several years’ computers have topped the holiday gift wish list for women.
The new economy has engendered a business atmosphere that requires problem solving, communication, and the manipulation of information, skills in which women are highly developed. In our society female have a lot of roles. Woman can be mother, wife, sister, daughter, and in same time artist, driver, customer, nurse, manager, and finally your boss. Taiwanese Women are the potential consumer segment for Fashion goods (Chang, 2009). According Statistic Yearbook of the Republic of China in 2007 population of Taiwan was 22.95 million, and 49.4 percent of them are Female (11.34 million). On 01 July 2009, population amount 23.046 million (INAPKO, Country).
Taiwanese female part of population pass their own way to win the recognition of society. In the past, historians in Taiwan have been interested in the status of women in mainland China. It was not until recently that historians began to explore women’s experiences in early Taiwanese history. Few studies revealed the issues and history of the women’s emancipation movement during Japanese colonization, and pointed out that capitalist, colonizers and patriarchal culture might account for the oppression of Taiwanese women. State autonomy in Taiwan declined due to the rise of democracy and social
movement in the mid-1980s. Women’s groups started to express their needs and to put pressure on state to establish a reasonable social and legal system with gender equality (Chen, 2000). During last year’s number of female who is single or divorced ever increase. And accordingly number of married women decreased. We seen a more independent and
financially self reliant. Also, according statistical data (Taiwan Statistical Data Book (2009) marketers can generate image of modern Taiwanese women. She is 37 age old (37.1 – average age of women), education degree from Junior college or above (96.1 – index of education, 40.1% - Junior college and above education degree) and working in service company (employment structure – 58% service). These can be main characteristics of average Taiwanese woman, but every woman is unique, especial women from different generation.
17
2.5.1. Generational Cohorts
Cohorts are defined as groups of individuals who are born during the same time period and who experience similar external events during their late adolescent and early adulthood years. Defining moments, such as changes in the economy, wars, politics, technological innovations, and sociological unrest, tend to shape their world view and influence their values, preferences, attitudes, and buying behavior that change their lifetime (Schewe and Meredith, 2004). The importance of cohorts is based on the assumption that individuals are highly influenced by events that occurred in their coming-of-age years. For studies relative luxury goods, right definition of cohorts play key role.
There are different motivations for buying and perspectives of luxury among the cohort groups (Hauck and Stanforth (2007). The important case that Asian Generation segmentation has few distinctions with American Generation segmentation. Asian version of Generation X and labeled it GENIE or the GENeration who Independently Engage. GENIEs have little respect for social structures. According Leo Burnett founding in his Consumer Quest survey, in China (such as country which is mostly cultural relative to Taiwan), the Open Generation strives for such qualities as having a sense of
accomplishment, being committed to a loving relationship, and finding harmony. Their parents, called the Elder Generation, emphasize values such as setting a good example for their children, working for the good of the country, and having national pride.
While the Open Generation of China shares similar tastes in music and fashion with the Generation X in the U.S., critical differences remain. Whereas Xers and their Baby Boomer parents share many of the same values toward work, family, and society, their Chinese counterparts have a huge experiential tear between the two generations. While the Elder Generation had to endure the Communist Revolution and the Cultural Revolution, the Open Generation of China grew up in relative political stability since the late 1970s. They have also witnessed tremendous economic change and increasing social openness with the increased availability of Western ideas, product and culture (Warner, 1997).
Summarized all this studies Taiwanese female can be divided be three segments or cohorts. First is Generation Y with age limit from 18 to 25 years old. Second is Open
18
Generation with age limit from 26 to 39 years old. This cohort represents biggest potential for buying luxury fashion clothing, because especially the Open Generation includes financial independent women. The third cohort is Elder Generation and represent female segment over 40 years old. Another, more recent academicals study introduce younger cohort – Generation Y. Thanks to the popularity of Internet, the younger generation is even faster at adopting foreign fashion trends than women. Young people today spend as much money on fashion items as do older consumers. Some students or newly employed people are known to work an entire summer just to buy an expensive article of clothing. The widespread availability of credit also helps boost sales by allowing many young, impulsive shoppers a chance to wear now and pay later. Researches show that for the young adult consumers, generally referred to as the Generation Y, as this Gen Y cohort in China has been found to possess a higher propensity to spend and focus increasingly on fashion and brands (Kwan et al., 2003; McEwen et al., 2006). Consumers of Gen Y cohort appear to be more willing to pay extra for a status brand or a brand of which they hold positive attitudes (O’Gass, 2008).
H2a. Generation Y will have a significant positive result of Fashion fanship. H2b. Generation Y will have a significant positive result of Low levels of brand loyalty.
H2c. Generation Y will have a significant negative result of High levels of brand loyalty.
Female consumers are more aware of the physical variables of fashion product attributes than male consumers (Rocha, 2005). Marketers need to pay special attention to women when expanding and advertising fashion brands to international markets. Research indicates that females tend to be more fashion-conscious, be more knowledgeable about fashion brands (Blyth, 2006), read more fashion magazines than male consumers (Putrevu, 2004). Women have continued to be the primary family caretakers at the same time that they have vastly expanded their roles and levels of responsibility in the business world. Studies show that often men are doing more around the house and women take the majority of the responsibility (Gobe, 2001). The Open Generation represented women that hold the high position in the business world.
19
H3a. Open Generation will have a significant positive result of Fashion fanship. H3b. Open Generation will have a significant positive result of High levels of brand loyalty.
H3c. Open Generation will have a significant negative result of Low levels of brand loyalty.
In research conducted by Joung (2006) with the female grey market, there was a high demand in apparel for quality, comfort, function and aesthetic elements. Research involving older consumers indicates that they are highly demanding in terms of the fashion product attributes. Research also indicates that fashion designers need to become more aware of the ageing population’s psychological need to express their individual style and taste through a choice of better quality products. The increase in disposable income and leisure time of this segment of the population, there is still limited market response to their needs.
H4a. Elder Generation will have a significant negative result of Fashion fanship.
H4b. Elder Generation will have a significant positive result of High levels of brand loyalty.
H4c. Elder Generation will have a significant negative result of Low levels of brand loyalty.
20
CHAPTER 3 RESEARCH DESIGN AND METHODS
In chapter 3, research design and methods are described. Section one proposes the conceptual framework of this study and research hypotheses. Follows operational variables with items used in questionnaire survey. The ensuing part is questionnaire design, sampling, and questionnaires gathering.
3.1 Conceptual Framework and Hypotheses 3.1.1 Conceptual Framework
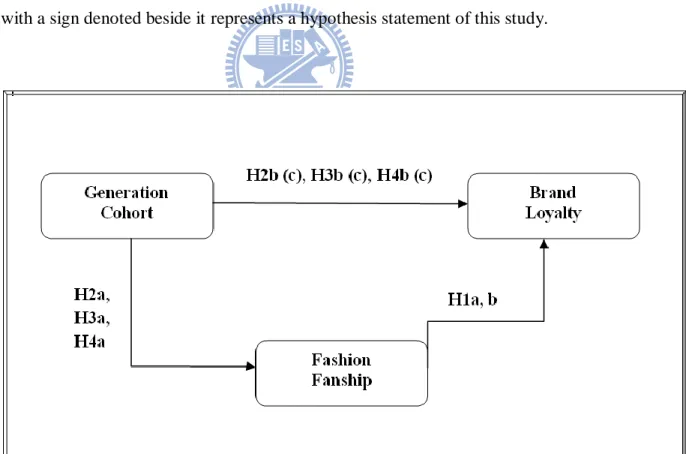
The conceptual framework of this study presented in figure 3-1 derives from inference of previous chapters. Every cell stands for a construct and factor(s) of the
construct. Arrow headed line represents casual relation between two constructs. Every line with a sign denoted beside it represents a hypothesis statement of this study.
21
3.1.2 Hypotheses
Hypotheses of this study are derived from literature review in chapter 2. Based on presumed relationship in the conceptual framework, hypotheses of this research are listed as followed.
H1a. Fashion fanship will have a significant positive relation of Low levels of brand loyalty.
H1b. Fashion fanship will have a significant negative relation of High levels of brand loyalty.
H2a. Generation Y will have a significant positive result of Fashion fanship. H2b. Generation Y will have a significant positive result of Low levels of brand loyalty.
H2c. Generation Y will have a significant negative result of High levels of brand loyalty.
H3a. Open Generation will have a significant positive result of Fashion fanship. H3b. Open Generation will have a significant positive result of High levels of brand loyalty.
H3c. Open Generation will have a significant negative result of Low levels of brand loyalty.
H4a. Elder Generation will have a significant negative result of Fashion fanship. H4b. Elder Generation will have a significant positive result of High levels of brand loyalty.
H4c. Elder Generation will have a significant negative result of Low levels of brand loyalty.
22
3.2 Definitions of Research Variables and Questionnaire Creation
All variables are converted into items used in questionnaire survey. Following sections illustrate the variable definitions with related literature in specific construct. The questionnaire incorporated tree sections: the first one personal information such as age, month income and purchase spending; the second one considered respondent thoughts about fashion interest; and third one personal identification of brand loyalty.
3.2.1 Fashion Fanship
Fashion consciousness can be researched by Fashion involvement that is similar to refers to the extent to which an individual is caught up in a number of fashion marketing concepts, including awareness, knowledge, interest and reactions. The Fashion involvement index and the Fashion involvement factor, developed by Tigert, Ring and King (1976) was used to measure consumers’ traditional attitude toward fashion trends. Five dimensions were included in the index as follows: fashion innovativeness and time of purchase, fashion interpersonal communication, fashion interest, fashion knowledge ability, fashion
awareness and reaction to changing fashion trends. The Fashion involvement index is composed of one 3-point question to measure each of the first four dimensions described above, along with a 5-point scale to measure the fifth dimension described above. Thus, scores on this overall measure can range from 5 to 17. And also will be used The Fashion Involvement Factor that measures aspects of the above five dimensions, all items are positively worded.
The Fashion Involvement Factor is composed of five 6-point Likert-type items (strongly agree to strongly disagree) that are summed to form an overall score for that can range from 6 to 30. The total score of FII and FIF Taiwanese women will be selected by four follows categories, depend of interest rate in Fashion trend: fashion fanatic, strong interest in fashion, weak interest in fashion and nonchalance for fashion.
23
3.2.2 Brand Loyalty
Following Oliver’s model there are four stage of Brand loyalty: Non-consumer, Affective loyalty, Cognitive loyalty, Action loyalty. The main issue that Taiwanese women will be not asked about actual brand names. It is the fact that fashion trends for different age groups of consumer are represented by different brand and couldn’t analyze in same category. Brand loyalty is composed of measurement items are formed after reviewing related literature and presented form of the one 4-point question to measure numbers of brands purchases and six items of five-point Likert scale ranging from ―strongly disagree‖ to ―strongly agree‖. There is a reversed item contained in the measurement scale and also items are listed in Table 3-1 with related literature.
Table 3-1 Measurement Items of Brand Loyalty I consider myself to be loyal to one (two) fashion brand(s) of clothing
Judith and Richard (2002)
I am willing to pay a higher price for clothing of favorite fashion brand
Bakewell, (2006)
I prefer to buy high fashion clothing from one brand Quester and Lim (2003) Hellier et al. (2003)
I can very easy switch to another fashion brand McDougall and Levesque (2000) Caruana (2002)
As much fashion brands I have as better Bakewell, (2006) When I choose brand of clothing I follow the trend Wood, L.M. (2004)
3.2.3 Demographic Variables
The demographic variables are presented the selection Taiwanese women by tree cohorts: Generation Y that represent female from 18 to 25 years old, Open Generation that represent female from 26 to 40 years old, and Elder Generation that represent all female whom age are more than 40 years old. Other general question will include information
24
about personal disposable income each month, nowadays experience of purchased clothing of the high fashion brand and the average expense on purchased clothing of high fashion brand.
3.3 Questionnaire Survey and Sampling Plan
The random survey of Taiwanese female from Hsinchu and Taizhon areas during period from January 21st to February 26th in 2010. The questionnaire was designed and conducted completely through face-to-face interviewing method of collecting information. All women were older than 18 years on the assumption that they had some income and could choose without parental interference. The samples constituted just one gender – female. The year of birth of all female was asked as a first condition of participation in the sample. Respondents were not required to provide proof or evidence related to their answers.
3.4 Data Analysis Procedures
Was collected 186 pieces of questionnaires and 180 of them was effective samples by 60 samples in each age cohort. The response rate of the survey is 96.77%. The
effectiveness of samples was based on two parameters. First one is complete answer for all questions and second one is carefully following answer in third part of questionnaire Brand loyalty. This part include opposite question for checking truly of answer.
For analysis of samples result was choose simplifying model, Two-Tail Tests, ANOVA, Correlation Analysis of comparison. All questionnaires are interpretation of respondents understand of their brand loyalty and fashion interest.
25
CHAPTER 4 ANALYSIS AND RESULTS
The respondents profile will be reported, followed by an examination of the scales. Testing of research hypotheses will then be placed at the end of this section.
4.1 Characteristics of Cohorts
All respondent was selected on tree cohort by age and asked general information that is relative to purchase of high fashion clothing.
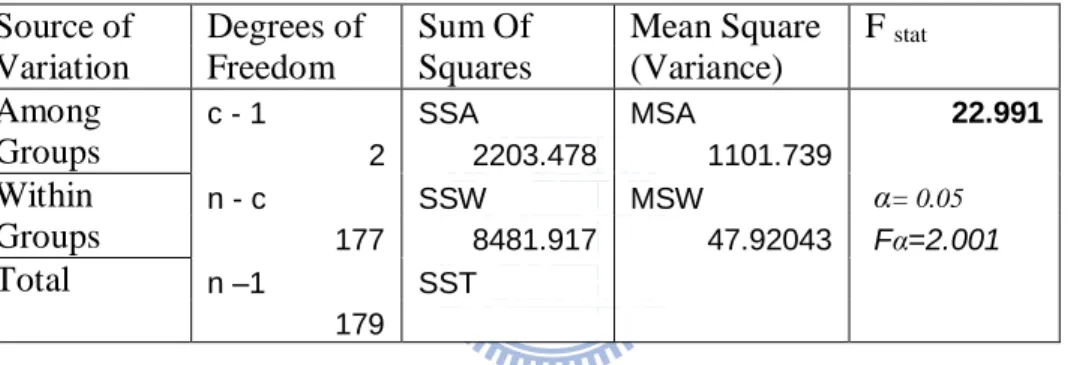
Analyses of variation improve, as Table 4-1 showed, that all data are valid and have at least one different factor.
Source of Degrees of Sum Of Mean Square F stat Variation Freedom Squares (Variance)
Among c - 1 SSA MSA 22.991
Groups 2 2203.478 1101.739 Within n - c SSW MSW α= 0.05
Groups 177 8481.917 47.92043 Fα=2.001
Total n –1 SST
179
Table 4-1 ANOVA Result
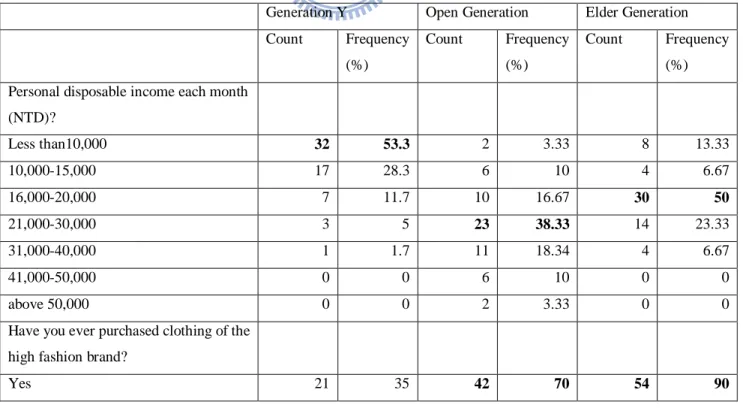
Table 4-2 classifies financial characteristics of respondents according to data received. Respondents showed different monthly income depend by different age cohort. For Generation Y, respondents whose monthly income below ten thousands sum up to 53.3% and 28.3% monthly has from ten to fifteen thousands. For 38.33% of female in Open Generation that number is from twenty-one to thirty thousands. This is not surprised fact, because actually this cohort represented working and independent women. For Elder Generation the average monthly income is lower that for Open Generation and higher that for Generation Y – from sixteen to twenty thousand for 50% of respondents. The Figure 4-1 illustrated differentiation of monthly income by each of generation.
26
Figure 4-1 Monthly income level cross table
In experience purchased high fashion clothing was showed significant different between Generation Y and other cohorts. Figure 4-2 illustrated respondents’ answers on question, have they ever buy expensive clothing high fashion brand. The 90% of female in Elder Generation and 70% in Open Generation had purchased clothing of the high fashion brand. Compare for that, 65% of younger female didn’t have that kind of experience.
Figure 4-2 Experience purchased high fashion clothing by cohort
The female whom already buy fashion brand was asked about average expense on purchased. This data showed that young Taiwanese women spend around ten or fifteen
27
thousands, by 15% in each category. For Generation Y it is not big different between spending this sum. But now is another question, because most of young female has month income less ten thousands. Those mean it’s possible that from Generation Y high fashion buyers are female whose income higher than average or whose has financial help from third person (as the parents or relatives). For Open Generation the level of average expense on purchased fashion brand clothing is higher than other cohort. Those can be explaining that working women more carefully choose styling attributes. The 31.67% female in this cohort average expense on purchased fashion brands from ten to fifteen thousand NTD. The important fact is that also 20% and 5% of women expense average from sixteen to twenty and from twenty-one to twenty five thousands accordingly.
The Generation Y and Elder Generation have the same result about average expense. The main number of respondent who are practical buyers of high fashion brands expense less fifteen thousands. The more number of females over forty buy high fashion brand clothing, but the women whose age are between 26 and 40 expense more that other on this luxury category.
Table 4-2 General Characteristics of the Sample
Generation Y Open Generation Elder Generation
Count Frequency (%) Count Frequency (%) Count Frequency (%) Personal disposable income each month
(NTD)? Less than10,000 32 53.3 2 3.33 8 13.33 10,000-15,000 17 28.3 6 10 4 6.67 16,000-20,000 7 11.7 10 16.67 30 50 21,000-30,000 3 5 23 38.33 14 23.33 31,000-40,000 1 1.7 11 18.34 4 6.67 41,000-50,000 0 0 6 10 0 0 above 50,000 0 0 2 3.33 0 0
Have you ever purchased clothing of the high fashion brand?
28
No 39 65 18 30 6 10
The average expense on purchased clothing of fashion brand
Less than 10,000 9 15 7 11.67 24 40 10,000-15,000 9 15 19 31.67 28 46.67 16,000-20,000 2 3.33 12 20 1 1.67 21,000-25,000 1 1.67 3 5 1 1.67 26,000-30,000 0 0 0 0 0 0 more 30,000 0 0 1 1.67 0 0
29
4.2 Data Analysis and results
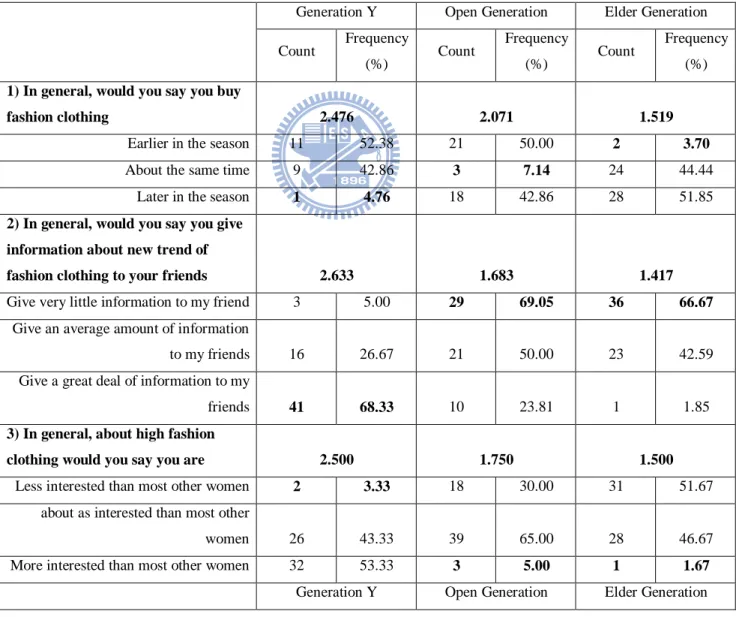
Was done calculation of Fashion Involvement Index for each cohort, based on five main sub-questions. For the first sub-question was found that’s the less interest of buying force for: Generation Y are later in the season, only 1 woman or 4.76%; Open Generation are about the same time, only 3 women or 7.14%; Elder Generation are earlier in the season, only 2 women or 3.7 %. For the second sub-question was found that’s the: Generation Y are give a great deal of information to my friends, 41 women or 68.33%; Open Generation are give very little information to my friend, 29 women or 69.05%.
Table 4-3 Fashion Involvement Index by cohort
Generation Y Open Generation Elder Generation Count Frequency (%) Count Frequency (%) Count Frequency (%)
1) In general, would you say you buy
fashion clothing 2.476 2.071 1.519
Earlier in the season 11 52.38 21 50.00 2 3.70
About the same time 9 42.86 3 7.14 24 44.44
Later in the season 1 4.76 18 42.86 28 51.85
2) In general, would you say you give information about new trend of
fashion clothing to your friends 2.633 1.683 1.417
Give very little information to my friend 3 5.00 29 69.05 36 66.67
Give an average amount of information
to my friends 16 26.67 21 50.00 23 42.59
Give a great deal of information to my
friends 41 68.33 10 23.81 1 1.85
3) In general, about high fashion
clothing would you say you are 2.500 1.750 1.500
Less interested than most other women 2 3.33 18 30.00 31 51.67
about as interested than most other
women 26 43.33 39 65.00 28 46.67
More interested than most other women 32 53.33 3 5.00 1 1.67
30 Count Frequency (%) Count Frequency (%) Count Frequency (%)
4) Compared with most other women,
are you . . . about Fashion 2.700 1.533 1.200
Less likely to be asked than most other
women 1 1.67 31 51.67 52 86.67
About as likely to be asked as most other
women 16 26.67 26 43.33 4 6.67
More likely to be asked than most other
women 43 71.67 3 5.00 4 6.67
5) Which one of statements below best describes your reaction to changing
fashions in women’s clothing 4.200 3.283 2.233
I read the fashion magazines regularly and try to keep my wardrobe up to date
with fashion trends 36 60.00 7 11.67 2 3.33
I keep up to date on all the fashion changes although I don’t always attempt
to dress according to those changes 0 0.00 12 20.00 8 13.33
I check to see what is currently fashionable only when I need to buy
some new clothes 24 40.00 34 56.67 13 21.67
I don’t pay much attention to fashion
trends unless a major change takes place 0 0.00 5 8.33 16 26.67
I am not at all interested in fashion
trends 0 0.00 2 3.33 21 35.00
Total score of FII 14.510 10.321 7.869
And the Elder Generation is giving very little information to my friend, 36 women or 66.67%. For the third sub-question was found that’s the: Generation Y are less interested than most other women, only 2 women or 3.33%; Open Generation are more interested than most other women, only 3 women or 5.%; Elder Generation are More interested than most other women, 1women or 1.67%. For the fourth sub-question was found that’s the:
31
Generation Y are more likely to be asked than most other women, 43 women or 71.67%; Open Generation are less likely to be asked than most other women, 31 women or 51.67%; Elder Generation are less likely to be asked than most other women, 52 women or 86.67%. For the fifth sub-question was found that’s the: Generation Y are read the fashion magazines regularly and try to keep my wardrobe up to date with fashion trends, 36 women or 60%; Open Generation are check to see what is currently fashionable only when I need to buy some new clothes, 34women or 56.67%; Elder Generation are not at all interested in fashion trends, 21 women or 35%. The Table 4-3 illustrated that’s the highest score of Fashion Involvement Index has a Generation Y with 14.510, the middle score of FII score has an Open Generation with 10.321 and the lowest FII score has an Elder Generation with 7.869. That’s mean the Generation Y has the biggest interest in fashion, than Open
Generation and Elder Generation.
Table 4-4 Fashion Involvement Factor by cohort
Generation Y Open Generation Elder Generation Count Frequency (%) Count Frequency (%) Count Frequency (%)
1.I usually have one or more outfits of
very latest style 4.350 3.367 3.183
1 1 1.67 1 1.67 2 3.33
2 1 1.67 21 35.00 6 10.00
3 6 10.00 3 5.00 37 61.67
4 20 33.33 25 41.67 9 15.00
5 32 53.33 10 16.67 6 10.00
2. An important part of my life and
activities is dressing smartly 3.500 5.300 2.067
1 0 0.00 8 13.33 0 0.00
2 0 0.00 2 3.33 17 28.33
3 22 36.67 6 10.00 21 35.00
4 22 36.67 12 20.00 19 31.67
32
Generation Y Open Generation Elder Generation Count Frequency (%) Count Frequency (%) Count Frequency (%)
3. I like to shop for clothes 4.933 4.500 4.133
1 1 1.67 5 8.33 4 6.67
2 0.00 2 3.33 4 6.67
3 1 1.67 1 1.67 0 0.00
4 3 5.00 2 3.33 24 40.00
5 56 93.33 50 83.33 28 46.67
4. I like to think I’m a bit of a swinger 3.833 2.683 2.583
1 11 18.33 7 11.67 24 40.00
2 0.00 28 46.67 8 13.33
3 1 1.67 9 15.00 8 13.33
4 24 40.00 9 15.00 9 15.00
5 24 40.00 7 11.67 11 18.33
5. For my fashion needs, I am increasingly shopping at boutiques or fashion specialty stores rather than department stores 3.367 3.383 2.867 1 0.00 2 3.33 8 13.33 2 25 41.67 14 23.33 17 28.33 3 0.00 12 20.00 17 28.33 4 23 38.33 23 38.33 11 18.33 5 12 20.00 9 15.00 7 11.67
6. When I must choose between the two, I usually dress for fashion, not comfort 3.150 2.933 1.400 1 8 13.33 5 8.33 49 81.67 2 16 26.67 21 35.00 5 8.33 3 5 8.33 10 16.67 1 1.67 4 21 35.00 21 35.00 3 5.00 5 10 16.67 3 5.00 2 3.33
33
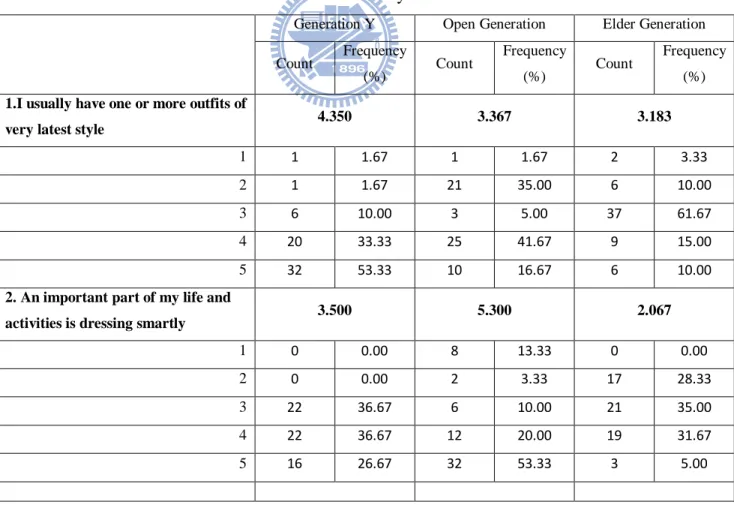
The calculation of Fashion Fanship Index was based on six main sub-questions. For the first sub-question was found that’s the: Generation Y are only 1 woman or 1.76% disagree and 32 women or 53.33% agree that show following the trend; Open Generation are only 1 woman or 1.76% disagree and 10 women or 16.67% agree; Elder Generation didn’t show big different and only 2 women or 3.33% disagree and only 6 women or 10% agree.
For the second sub-question was found that’s the: Generation Y are no one disagree and 16 women or 26.67% agree; Open Generation are only 8 women or 13.33% disagree and 32 women or 53.33% agree; Elder Generation are no one disagree and only 3 women or 5% agree. This means that Generation Y perceived Fashion as the important part of their lives. For the third sub-question was found that’s the: Generation Y are only 1 woman or 1.67% disagree and 56 women or 93.33% agree and this data can be interpreted as criteria of young Taiwanese; Open Generation are only 5 women or 8.33% disagree and 50 women or 83.33% agree; Elder Generation are only 4 women or 6.67% disagree and 28 women or 46.67% agree. This data show mass love for shopping. For the fourth sub-question was found that’s the: Generation Y are 24 women or 40% disagree and 11 women or 18.33% agree; Open
Generation are only 7 women or 11.67% disagree and only 7 women or 11.67% agree; Elder Generation are 11 women or 18.33% disagree and 24 women or 40% agree.
For the fifth sub-question was found that’s the: Generation Y are 12 women or 20% disagree and no one agree; Open Generation are only 9 women or 15% disagree and only 2 women or 3.33% agree; Elder Generation are only 7 women or 11.67% disagree and only 8 women or 13.33% agree. For the sixth sub-question was found that’s the: Generation Y are only 8 women or 13.33% disagree and 10 women or 16.67% agree; Open Generation are only 5 women or 8.33% disagree and only 3 women or 5% agree; Elder Generation are 49 women or 81.67% disagree and only 2 women or 3.33% agree. The Table 4-4 shown that’s the biggest Fashion Fanship Index score have Generation Y with 23.133, the second biggest FIF score got Open Generation with 22.167 and the lowest FIF score got Elder Generation with 16.233. That’s illustrated the biggest fashion interest has Generation Y and Open Generation, than Elder Generation.
The score of Fashion involvement represented the fashion consciousness and refers to the extent to which an individual is caught up in a number of fashion marketing concepts,
34
including awareness, knowledge, interest and reactions. Given this range of concepts, fashion can become a central focus for a meaningful and engaging activity in an individual’s life (O’Cass, 2004). Table 4-5 illustrated the total score of FII and FIF Taiwanese women. Based on data of Fashion Involvement all age cohort was selected by four follows categories, depend of interest rate in Fashion trend: fashion fanatic, strong interest in fashion, weak interest in fashion and nonchalance for fashion (Table 4-6).
Table 4-5 Total score of Fashion Involvement by Cohort
Total score of Fashion Involvement Generation Y Open Generation
Elder Generation Fashion Involvement Index (FII) 14.510 10.321 7.869 Fashion Involvement Factor (FIF) 23.133 22.167 16.233
Confidence Interval 22.033 20.739 14.348 24.233 23.594 18.119
Table 4-6 Level of Fashion Fanship by Cohort
Levels of Fanship
Generation Y Open Generation
Elder Generation FII FIF FII FIF FII FIF
Fashion fanatic V
Strong interest in fashion V V
Weak interest in fashion V V
Nonchalance for fashion V
Based on privies researchers FII and FIF as the models for describing Fashion fanship can be used together or separate. FII is not exemptible for using in correlation analyses, because some items include data from responded who had experience of buying Luxury fashion cloth. This study will use FIF as main.
From analyzing Fashion fanship of Generation Y was founded higher score of Fashion Involvement Index and classified as Fashion fanatic. Also this cohort showed strong
35
interest by Fashion Involvement Factor. Respondents are highly interested in Fashion trends and associated clothing style directly with their lifestyle. The Open Generation cohort has good fashion knowledge and active fashion buyers, but didn’t show significant positive or negative result of Fashion fanship. The Taiwanese female whose age is from 26 to 40 years old are interested in Fashion that is represented by score of FIF. But at the same time, based on FII score respondents have weak level of interest in fashion. The lowest score of FII has Elder Generation, that’s showing significant negative result, as nonchalance for fashion, but in the same time score of FIF illustrating the week interest in fashion for women over the 40 years old.
Table 4-7 Quantity rates of brands by cohort How many different high fashion brands
of cloth do you have in your wardrobe?
Generation Y Open Generation Elder Generation Count Frequency (%) Count Frequency (%) Count Frequency (%) 1-5 45 75.00 2 3.33 37 61.67 6-10 11 18.33 28 46.67 21 35.00 11-20 3 5.00 26 43.33 1 1.67 more 20 1 1.67 4 6.67 1 1.67
The Table 4-7 illustrated that’s 75% or 45 women of Generation Y has only 1-5 high fashion brands of cloth and only 1.67% or 1 woman has more than 20 brands. For the Open Generation 28 women or 46.67 % has 6-11 fashion brands of cloth and 43.33% and 26 women has 11-20 brands. And Older Generation prefer to have 1-5 brands of cloth, as 37 women or 61.67% and 6-10 brands, as 21 women or 35%. The Figure 4-3 shown that’s Generation Y and Elder Generation prefer more are to have 1-5 high fashion brands of cloth, but Open Generation prefer are to have 6-10 or 11-20 brands of cloth. The less priority for Generation Y and Elder Generation are to have11-20 or more than 20 brands in wardrobe, but for Open Generation less priority are to have 1-5 or more than 20 fashion brands.
36
Figure 4-3 Quantity rates of brands by cohort
The Table 4-8 was based on six main sub-questions of brand loyalty by cohort. That’s illustrated which Generation to prefer have only few brands and follow it. And, also, shown which of Generation can easy to change mind to change one high fashion brand to another. The result showed strong different between female’s age and their thinking.
Table 4-8 Brand Loyalty by cohort
Generation Y Open Generation Elder Generation Count Frequenc y (%) Count Frequency (%) Count Frequency (%)
1) I consider myself to be loyal to one
(two) fashion brand(s) of clothing 2.483 4.083 4.500
1 5 8.33% 0.00% 5 8.33%
2 41 68.33% 11 18.33% 0.00%
3 4 6.67% 7 11.67% 1 1.67%
4 0.00% 8 13.33% 8 13.33%
37
Generation Y Open Generation Elder Generation Count Frequenc y (%) Count Frequency (%) Count Frequency (%)
2) I am willing to pay a higher price
for clothing of favorite fashion brand 2.750 3.467 2.883
1 10 16.67% 18 30.00% 28 46.67%
2 14 23.33% 2 3.33% 5 8.33%
3 23 38.33% 4 6.67% 0 0.00%
4 7 11.67% 6 10.00% 0 0.00%
5 6 10.00% 30 50.00% 27 45.00%
3) I prefer to buy high fashion
clothing from one brand 1.450 3.017 3.100
1 45 75.00% 23 38.33% 21 35.00%
2 8 13.33% 6 10.00% 6 10.00%
3 4 6.67% 3 5.00% 2 3.33%
4 1 1.67% 3 5.00% 8 13.33%
5 2 3.33% 25 41.67% 23 38.33%
4) I can very easy switch to another
brand 2.167 2.867 2.717 1(5) 10 16.67% 23 38.33% 13 21.67% 2 2 3.33% 4 6.67% 10 16.67% 3 5 8.33% 0 0.00% 5 8.33% 4 14 23.33% 8 13.33% 11 18.33% 5(1) 29 48.33% 25 41.67% 21 35.00%
5) As much fashion brand I have as
better 1.300 1.450 3.617 1(5) 2 3.33% 3 5.00% 32 53.33% 2 2 3.33% 0.00% 5 8.33% 3 2 3.33% 1 1.67% 0.00% 4 0.00% 13 21.67% 14 23.33% 5(1) 54 90.00% 43 71.67% 9 15.00%
38
Generation Y Open Generation Elder Generation Count Frequenc y (%) Count Frequency (%) Count Frequency (%)
6) When I choose brand of clothing I
follow the trend 1.850 2.850 3.567
1(5) 5 8.33% 23 38.33% 31 51.67%
2 2 3.33% 1 1.67% 6 10.00%
3 6 10.00% 3 5.00% 1 1.67%
4 13 21.67% 10 16.67% 10 16.67%
5(1) 34 56.67% 23 38.33% 12 20.00%
Total score of Brand Loyalty 12.0 17.733 20.384
Table 4-9 Stage of Brand Loyalty
Stage of Brand Loyalty Generation Y Open Generation Elder Generation
Confidence Interval 10.973-13.027 15.752-19.715 18.236-22.531
Non-consumer
Affective Loyalty V
Cognitive Loyalty V V
Action Loyalty
The Table 4-9 illustrated, that’s the Generation Y didn’t have significant negative result, but it shown the affective loyalty. Both, Open generation and Elder Generation didn’t have significant positive result, those two groups has cognitive loyalty.
39
4.3. Hypotheses testing
Analyzing Fashion fanship of Generation Y was founded higher score of Fashion Involvement Index and classified as Fashion fanatic. Also this cohort showed strong interest by Fashion Involvement Factor. Totally the respondents of Generation Y have a significant positive result of Fashion fanship and those data support Hypothesis 2a. Respondents are highly interested in Fashion trends and associated clothing style directly with their lifestyle. The Open Generation cohort didn’t show significant positive or negative result of Fashion fanship. The Taiwanese female whose age is from 26 to 40 years old are interested in Fashion that is represented by score of FIF. But at the same time, based on FII score respondents have weak level of interest in fashion. Following this result Hypothesis 3a are not support. Summarizing the data Open Generation has good fashion knowledge and active fashion buyers. Elder Generation showed weak interest and nonchalance for fashion.
The Tables 4-6 and 4-7 showed relation between Fashion fanship and brand loyalty. The cohorts that have higher fashion interest are less loyal to one brand. That can be explained by strong aspiration for following Fashion and buy cloth by trend social fashion interest.
The Correlation Analyses showed strong negative relation between Brand Loyalty and Fashion Fanship. For Generation Y the correlation coefficient between those two factors is -.658, for Open Generation -.693 and finally for Elder Generation -.75, that’s strongest one. As the result Hypothesis 1 is support. It’s mean that younger generation is more fashion interesting, but didn’t follow single brand. And from opposite side, elder generation show lower interest to fashion, but has good opportunity to be loyal customers.