ANALYSIS OF ALBUMINS, USING
ALBUMIN BLUE 580, BY CAPILLARY
ELECTROPHORESIS AND
LASER-INDUCED FLUORESCENCE
Wei-Lung Tseng, Tai-Chia Chiu, Jang-Mao Weng, andHuan-Tsung Chang*
Department of Chemistry, National Taiwan University, Taipei, Taiwan, R. O. C.
ABSTRACT
We report a new method for analysis of albumins with albumin blue 580 (AB 580) by capillary electrophoresis (CE) using a rela-tively low-cost He-Ne laser. During separation, albumins and AB 580 formed complexes bearing intensive fluorescence in Tris-borate (TB) buffers. The analysis of human serum albumin (HSA) was fast (4 min); reproducible (relative standard deviation (RSD) values of the migration time and peak height were less than 1% and 2%, respectively); and sensitive (the limit of detection at signal-to-noise ratio = 3 was 11 nM). Compared to other common dyes, such as bromphenol blue and merocyanine 540 for detecting albumins, AB 580 provides advantages of low fluorescence back-ground, stability, sensitivity, and selectivity.
Without sample pretreatment, this proposed method was employed to determine HSA in urine and blood cells from a nor-mal nor-male, with results of 5.2 ± 0.2 mg/L and about 8.2 ± 0.2
2971
Copyright © 2001 by Marcel Dekker, Inc. www.dekker.com
zmol/cell. To further increase the resolving power of this method, the tryptic digest of HSA was separated using 0.6% PEO. From the fact that only two peaks were shown in the electropherogram, we suggested that HSA and AB 580 formed 1:1 complexes. This method also allowed for rapid separation of HSA, deoxyribonu-clease I, and their complexes.
INTRODUCTION
The quantitative determination of albumins in biological fluids is of impor-tance in diagnosis and in many biomedical sciences. Variations in the concentra-tion of HSA in body fluids are associated positively with a number of diseases, such as renal disease, diabetes, and liver disease.(1-3) However, it is difficult to precisely determine the concentration of albumins in biological fluids, mostly due to complicated matrices and sometimes low amounts. For example, the nor-mal concentrations of HSA in cerebrospinal fluids and urine are around 200 mg/L and less than 25 mg/L, respectively. For detecting low concentration of albumins, immunoassay and fluorescence assay have emerged to minimize inter-ference from other proteins for many years.(4-6)
With advantages of rapidity, high-resolving power, and sensitivity, capillary electrophoresis with laser-induced fluorescence (CE-LIF) has become one of the most powerful techniques for analysis of a variety of biological samples.(7-9) In particular, for the past few years, there has been increasing interest in the use of CE-LIF for protein analysis.(10-12) Analysis of proteins containing residues of tryptophan, tyrosine, and phenylalanine is feasible in CE by using an expensive argon ion laser (275-nm line),(13) and the limit of detection (LOD) at a signal-to noise ratio = 3 (S/N = 3) for BSA down to nM has been reported.(14) In addi-tion, relatively economical, compact, pulsed KrF excimer laser (248-nm line) has been employed for the same purpose.(15) However, for optimum sensitivity, the analysis of proteins with characteristics of intrinsic fluorescence is generally car-ried out at high pH, which may induce changes in conformation and activity.(16) To prevent these problems, CE-LIF has been commonly applied to analysis of proteins derivatized with fluorophores such as fluorescein-5-isothiocyanate by using argon ion lasers.(17)
Usually, attention must be paid to minimize interferences from byproducts and problems like sensitivity associated with incomplete reactions when conduct-ing derivatization. To minimize problems related to denaturation of proteins and/or interferences from byproducts, it is essential to perform analysis under mild conditions using relatively low-cost lasers and suitable dyes. Recently, incorporation of long-wavelength lasers, such as He-Ne lasers, has been given
considerable attention for analysis of proteins labeled with fluorophores such as b-phycoerythrin, 5-furoylquinoline-3-carboxaldehyde, and indocyanine green (18-20) in CE. The principle advantages using He-Ne lasers for analysis of pro-teins include: compact, inexpensive, stable output, low matrix interference, and a low risk in destroying samples.
In spite of high-resolving power, analysis of complex biological samples, such as urine and blood by CE-LIF, is sometimes not satisfied.(21,22) In this regard, use of dyes with high selectivity for analytes of interest is one of the favorable means. For example, albumin blue 580 (AB 580) has been used for analysis of HSA because it binds quickly to albumin in a specific way to undergo dramatic fluorescence enhancement. Although, AB 580 has been described for highly sensitive determination of albumins (LOD for HSA is about 0.4 mg/L),(23) interference from complicated sample matrices may cause a signifi-cant error in trace analysis of albumin.(4,24) Thus, our goal was to develop a simple method for sensitive analysis of HSA in biological samples using CE with a He-Ne laser. The simple developed method was also employed to explore the interactions between AB 580 and HSA, and between deoxyribonuclease (DNase I) and HSA, respectively.
EXPERIMENTAL Chemicals and Biochemicals
Reagent-grade tris(hydroxymethyl)aminomethane (Tris), H3BO3and NaOH used for preparing Tris-borate (TB) buffers, pH 8.5 and 10.0, respectively, and poly(ethylene oxide) (molecular weight = 8,000,000) were obtained from Aldrich (Milwaukee, WI, USA). Human serum albumin (HSA), bovine serum albumin (BSA), sheep serum albumin (SSA), trypsin, DNase I, bromphenol blue (BPB), Merocyanine 540 (MC 540), NaCl, NaH2PO4, 2-isopropanol, and dimethyl sul-foxide (DMSO) were from Sigma (St. Louis, MO, USA). AB 580 was from Molecular Probe (Eugene, OR, USA).
Solutions
The concentrations of AB 580 and BPB stock solutions prepared in 2-iso-propanol were both 10 mM, while that of MC 540 prepared in DMSO was 1 mM. They were stored at 4°C and used for analysis of proteins after dilution with TB buffers. The phosphate buffered saline (PBS), pH 7.4, used for washing cells was prepared from dissolving 8.0-g NaCl, 0.2-g KH2PO4, 0.46-g Na2HPO4, and 0.2-g
KCl in.1-L H2O. PEO solutions were prepared either in 40 or 200 mM TB buffers, pH 8.5.(25)
Sample Preparation
After centrifugation of the blood in EDTA from a normal male at a speed of 1000 rpm for 10 min, the supernatant was removed and fresh wash PBS buffer was added. The process was repeated several times for the plasma removal factor of 106. Prior to analysis, cells were lysed with 1-mL TB buffer using ultrasonic means for 20 min. Urine from a normal male, diluted with the TB buffer (v/v 1:1), was injected into the capillary for analysis without any pretreatment. The digestion of 1 mM HSA was carried out in 0.5 nM trypsin aqueous solution, pH 8.5, at 37°C overnight. HSA and DNase I were mixed at a ratio of 1:15 and reacted at ambient temperature for specific times.
Instrumentation
The basic design of the separation system has been previously de-scribed.(25) Briefly, a high-voltage power supply (Gamma High Voltage Research Inc., Ormond Beach, FL, USA) was used to drive electrophoresis. The entire detection system was enclosed in a black box with a high-voltage interlock. High-voltage end of the separation system was put in a home-made plexiglas box for safety. A 1.5-mW He-Ne laser with 594-nm output from Melles Griot (Irvine, CA, USA) was used for excitation when BPB and AB 580 were used. The light was collected with a 10 X objective (numerical aperture. = 0.25). One 610-nm interference filter was used to block scattered light before the emitted light reaches the phototube (R928 from Hamamatsu, Shizuoka-Ken, Japan). When using MC 540, a 1.5-mW He-Ne laser with 543-nm output and a 580-nm cutoff filter were used. On the other hand, when detecting the intensity of intrinsic flu-orescence of proteins, a pulsed Nd:YAG laser at 266 nm and a UG1 filter were used. The amplified signals were transferred directly through a 10-kW resistor to a 24-bit A/D interface at 10 Hz (BorwinTM, JMBS Developments, Le Fontanil, France) and stored in a PC.
Separation
Separations were performed in 40-cm capillaries (Polymicro Technologies, Phoenix, AZ, USA), 75 mm i.d. and 365 mm o.d. Prior to analysis, the capillaries (effective length: 30 cm) were equilibrated with 0.1 M NaOH overnight, and
washed with TB buffer for at least 10 min. Injections were performed hydrody-namically at 22.5-cm height for 4 s, and separations were performed at 15 Kv.
RESULTS AND DISCUSSION Sensitivity
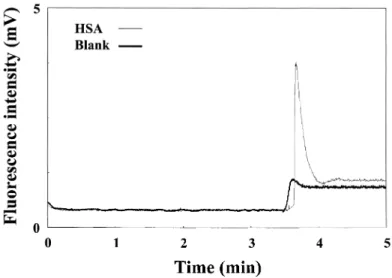
AB 580 molecules are anionic and not fluorescent, although they quickly become intensive fluorophores after binding with albumins. The maximum exci-tation wavelength and emission wavelength of the complex are around 593 and 608 nm, respectively. These characteristics make it quite suitable for on-column analysis of HSA in C,E using a relatively low-cost He-Ne laser. During separa-tion, HAS with slightly higher electrophoretic mobility toward the anode, tra-versed AB580, migrating from the buffer reservoir in the anode end and, subse-quently, formed complexes. Because electroosmotic flow (EOF) was higher than the electrophoretic mobility of HSA complexes, the analytes were detected near the cathode end. The electropherogram of 60 nM HSA is shown in Fig. 1. From the peak height and noise, the LOD (S/N = 3) for HSA was about 11.1 nM. Although the LOD was higher than that (ca. 5 nM) measuring with a
fluorome-Figure 1. Detection of 60 nM HSA in 40 mM TB buffer, pH 8.5, containing 1 mM AB580 by CE-LIF. Conditions: capillary filled with 40 mM TB buffer; total length = 40 cm; effective length = 30 cm; hydrodynamic injection: 22.5 cm for 4 s; run voltage = 15 kV.
ter,(4,23) the injection amount was only several tens of attomole (several nL of injection volume).
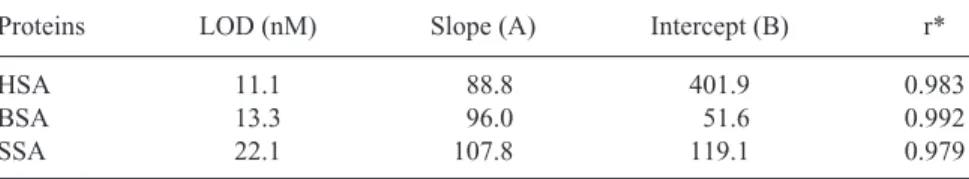
The baseline, slightly shifted after the peak corresponding to HSA com-plexes, was due to the small fluorescence background from AB 580 that was not filled in the capillary prior to analysis. A small occuring bump, shown in a blank test, was due to the concentration gradient near the interface between TB buffer and TB buffer containing AB 580. Table 1 shows the LOD values for HSA, BSA, and SSA are 11.1, 13.3, and 22.1 nM, respectively. The fluorescence intensity increased linearly with the concentration of the three proteins over the range of 60 nM to 6 mM. With such high sensitivity and a good linearity, this method should have the potential for analysis of HSA in biological samples.
Interferences
With a high resolving power, CE has become one of the most powerful tools for analysis of biological samples, such as plasma and urine. Thus, when HSA analysis was performed using AB 580 in CE, problems associated with matrices should not be pronounced compared to that with a fluorometer. To test this suggestion, we analyzed samples containing 10 mM common interferences, including pepsin, trypsin lactoglobulin, urea, and uric acid.(4,24) The recovery for 0.1 m M HSA is in the range of 98 to 102%. Our reasoning for good recover-ies is that the electrophoretic mobility values of HSA and interferences are differ-ent and AB 580 is very specific for HSA. Interferences may also come from other small molecules that bind to HSA in many types.(26) Most strongly bound are hydrophobic organic anions of medium size, 100-600 g/mol, such as palmi-tate acid (binding constant: 1.5 × 10⁸
). Tryptophan is less hydrophobic and small, which is held less strongly (binding constant: 1.0 × 10⁴
) but still specific.
Table 1. LOD and Linear Regression Calculations for Albumins in CE Using 10 mM AB 580
Proteins LOD (nM) Slope (A) Intercept (B) r*
HSA 11.1 88.8 401.9 0.983
BSA 13.3 96.0 51.6 0.992
SSA 22.1 107.8 119.1 0.979
*r is the linear regression coefficient. The concentration (y) of albumins could be calcu-lated using y = Ax + B, where x represents the peak height for albumins. The concentra-tion ranges of albumins determined were 60 nM to 6 mM.
To reveal the effects of small molecules on determining HSA using AB 580, we added 10 mM palmitate acid and tryptophan to the sample containing 0.5 mM HSA and performed the separation. A slight variation in the migration time (results not shown) was observed, indicating that these acids did bind to HSA. Unfortunately, we could not separate HSA complexes that did and did not contain fatty acids under this separation condition. Since the fluorescence intensity of HSA complexes did not change, we suggested that AB 580 might bind in a differ-ent site and the existence of these acids did not cause serious problems on detect-ing HSA.
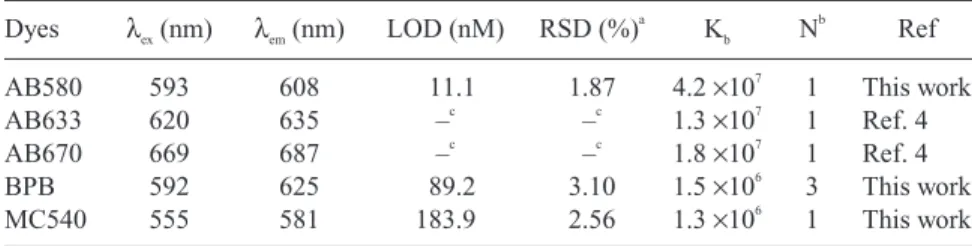
Comparison of AB580, BPB, and MC 540
To further explore the characteristics of high selectivity and sensitivity of AB 580 for analysis of HSA, it is instructive to determine the binding constant. We measured the fluorescence intensities of the complexes formed between con-stant amounts of albumins and different amounts of AB 580. From the slope of the Scatchard plot (not shown), the calculated binding constant was 4.2 × 10⁷
(R2 = 0.992), providing that 1:1 complexes formed. As shown in Table 2, AB 580 formed more stable complexes with HSA compared to those using BPB, and MC 540, other common dyes used for determination of HSA. As expected, the LOD values for HSA were higher using BPB and MC 540, which were 89.2 and 183.9 nM, respectively. Table 2 also shows that the reproducibility of quantitative results (peak height) using AB 580 (RSD = 1.87%) was better than those using BPB (RSD = 3.10%) and MC 540 (RSD = 2.56%), presumably because of the adsorption of BPB and MC540 on the capillary wall. It is well accepted, that the adsorption of solutes on the capillary wall is more profound for hydrophobic compounds,(27) leading to decreases in EOF and poor reproducibility. As a result, the RSD values of the migration time of HSA complexes using BPB and
Table 2. Comparison of the Analysis of HSA by Different Methods Dyes λex(nm) λem(nm) LOD (nM) RSD (%)
a
Kb N
b
Ref
AB580 593 608 11.1 1.87 4.2 ×10⁷ 1 This work
AB633 620 635 –c –c 1.3 ×10⁷ 1 Ref. 4 AB670 669 687 –c –c 1.8 ×10⁷ 1 Ref. 4 BPB 592 625 89.2 3.10 1.5 ×10⁶ 3 This work MC540 555 581 183.9 2.56 1.3 ×10⁶ 1 This work a
Three measurements of peak height. b
Numbers of dye molecules bound to each HSA. c
MC540 were both > 3.0%, which were higher than that using AB 580 (<1%). We should also mention that MC 540 was quite unstable at high pH. To that end, it is important to note that AB 580 is superior over BPB and MC 540 for determina-tion of HSA in terms of sensitivity, reproducibility, and specificity.
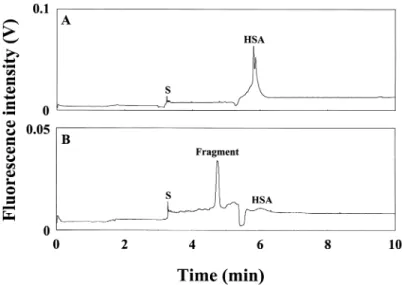
To examine our assumption that AB 580 forms 1:1 complex with HSA, HSA and its tryptic digest were separately analyzed using this method. In order to achieve better resolution, the separation was carried out in 0.6% PEO. Figure 2A shows two peaks corresponding to HSA complexes, likely due to monomers and dimmers. On the other hand, Fig. 2B shows that a new peak appeared and the two peaks corresponding to HSA dramatically decreased (HSA was digested markedly) when injecting the tryptic digest. In order to identify the new peak, we injected the same amount of trypsin for analysis. No peak was observed in 20 min (not shown), indicating that AB 580 is not selective for trypsin. Thus, we concluded that the peak had to be from the tryptic digest. As reported that there are more than 79 peptide fragments in tryptic digest of HSA, we inferred that AB 580 forms 1:1 complexes with HAS.(28)
Figure 2. Separation of samples containing HSA and trypsin digest of HSA, respec-tively, in 0.6 % PEO prepared in 40 mM TB, pH 8.5. (A) 1 mM HSA. (B) trypsin digest of HSA; [HSA] = 1 mM and [trypsin] = 5 nM. Capital S represents a system peak. Conditions: capillary filled with 100 mM TB buffer, pH 10.0. Others conditions were as Figure 1.
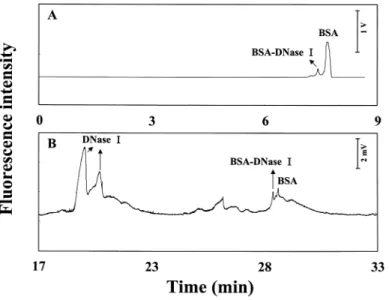
Interaction Between DNase I and BSA
It has long been known that DNase I requires divalent cations for full activ-ity to cleave DNA with a nicking activactiv-ity that is inhibited by BSA under neutral pH conditions.(29,30) The most pronounced inhibition occurs around pH 4.2. Figure 3A shows the separation of a sample containing BSA and DNase I with a ratio of 1:15 in 0.6% PEO. The peak corresponding to BSA became broader and the migration time increased with increasing the ratio of DNase I to BSA (results not shown). This is probably due to the adsorption of DNase I (glycoprotein) at high concentrations on the capillary wall. The peak in front of that correspond-ing to BSA only appeared at high concentrations of DNase I (10 times BSA con-centration). To identify this peak, we performed the separation of DNase I under the same condition. No peak was observed, indicating that AB 580 was not selec-tive for DNase I and the peak might correspond to the complex between BSA and DNase I.
To further support our assumption, we analyzed the sample using a Nd:YAG UV laser (266 nm) and the result was shown in Figure 3 B. As the con-centration of DNase I was increased (the first two peaks increased), the peak cor-responding to BSA-DNase I complex increased slightly, while the peak
corre-Figure 3. Separation of a sample containing 50 mM BSA and 0.75 mM DNase I by two different methods. (A) He-Ne laser and (B) Nd:YAG laser. Conditions: the same as Figure 2 in (A); capillary filled with 1500 mM TB buffer, pH 10, and buffer vials contained 0.6 % PEO prepared in 200 mM TB, pH 8.5, in (B).
sponding to BSA decreased slightly. The fact of a slight increase in the fluores-cence intensity and the need of high concentration of DNase I, suggested that the interaction between BSA and DNase I is weak. When using high concentrations of TB buffer, EOF was small and the electrophoretic mobility of proteins was higher. As a result, the separation times shown in Fig. 3B was much longer com-pared to those in Fig. 3A.
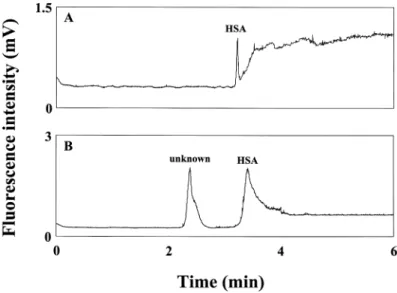
Urine and Blood Cells
To test the specific and sensitive features of AB 580, a 1:1 (v/v) diluted urine sample from a normal male was separated and the result was shown in Fig. 4A. The concentration of HSA in urine calculated from the peak height was 5.23 ±0.15 mg/L (78 ±2 nM, n = 5), which agreed with the mean concentration of HSA in urine (about 5.6 mg/L). Figure 4B shows the separation of 15.6 nL of a lysed blood sample (ca. 3-mL blood cells in 47-mL TB buffer). Comparing this electropherogram with that of the supernatant from the last wash cycle (no peak was detected), there is no doubt that the two peaks corresponded to components in lysed cells. The concentration of HSA calculated from the peak height of the second peak is 15.0 ±0.7 mM. The relatively greater amount of HSA (injection dependence of variance) and other proteins (proteins adsorption on the capillary
Figure 4. Analysis of HSA in urine and red blood cells using AB 580 by CE-LIF. (A) urine diluted 0.5-fold with 40 mM TB, pH 8.5; (B) red blood cells. Other conditions were as Figure 1.
wall, adsorption dependence of variance) in red blood cells than that in urine is the reason for a comparably broad peak corresponding to HSA shown in Fig. 4B. If we used the volume of one blood cell equal to 84 fL, the amount of HSA in sin-gle cells was about 8.2 ±0.2 zmol (n = 5). It should be noted that HSA might stay inside the cells or be strongly adsorbed in the membrane.
The other peak may be due to other proteins or small solutes that directly bind to AB 580 or have strong interactions with HSA. The fact that two peaks were obtained from lysed cells suggests that it is more precise for the analysis HSA in blood samples by CE than conventional means. The fact that only one peak and two peaks found in urine and red blood cells observed again supported that this method is very specific for HSA.
CONCLUSIONS
We have taken the advantages of high selectivity and sensitivity of AB 580 for HSA to develop a relatively low-cost CE-LIF method for analysis of albumins in biological samples. Compared to BPB and MC 540, AB 580 is a better probe for albumins in terms of sensitivity, selectivity, and reproducibility. This method allow us to separate the tryptic digest of HAS, and two peaks found in the elec-tropherogram implies that AB 580 and HSA form 1:1 complexes. Because of good reproducibility, high sensitivity, small samples injected, specificity, and rapidity, this method has the potential for evaluation of microaluminuria, which is important for early diagnosis of renal disease clinics. With high resolving power of CE and high specificity of AB 580 for albumins, this method will also be applied to study the interactions between other proteins or drugs and albumins.
ACKNOWLEDGMENT
This work was supported by the National Science Council of the Republic of China under contract number NSC 89-2113-M-002-062.
REFERENCES
1. Ballmer, P.E.; Weber, P.K.; Roy-Chaudhury, P.; McNurlan, M.A.; Watson, H.; Power, D.A. Kidney Int. 1992, 41, 132-138.
2. Jefferson, L.S.; Liao, W.S.; Peavy, D.E.; Miller, T.B.; Appel, M.C.; Taylor, J.M. J. Biol. Chem. 1983, 258, 1369-1375.
3. Eppel, G.A.; Nagy, S.; Jenkins, M.A.; Tudball, R.N.; Daskalakis, M.; Balazs, N.D.H.; Comper, W.D. Clin. Biochem. 2000, 33, 487-494.
5. Heegaard, N.H.H.; Kennedy, R.T. Electrophoresis 1999, 20, 3122-3133. 6. Parsons, M.P.; Newman, D.J.; Newall, R.G.; Price, C.P. Clin. Chem. 1999,
45, 414-417.
7. Tao, L.; Kennedy, R.T. Electrophoresis 1997, 18, 112-117.
8. Krull, I.S.; Deyl, Z.; Lingeman, H. J. Chromatogr. B 1994, 659, 1-17. 9. Pinto, D.M.; Arriaga, E.A.; Sia, S.; Li, Z.; Dovichi, N.J. Electrophoresis
1995, 16, 534-540.
10. Asermely, K.E.; Broomfield, C.A.; Nowakowski, J.; Courtney, B.C.; Alder, M. J. Chromatogr. B 1997, 695, 67-75.
11. Wan, Q.-H.; Le, X.C. Anal. Chem. 2000, 72, 5583-5589. 12. Hunt, G.; Nashabeh, W. Anal. Chem. 1999, 71, 2390-2397. 13. Chang, H.-T.; Yeung, E.S. Anal. Chem. 1993, 65, 2947-2951. 14. Lee, T.T.; Yeung, E.S. J. Chromatogr. 1992, 595, 319-325.
15. Chan, K.C.; Janini, G.M.; Muschik, G.M.; Issaq, H.J. J. Liq. Chromatogr. 1993, 16, 1877-1890.
16. Gianazza, E.; Galliano, M.; Miller, I. Electrophoresis 1997, 18, 695-700. 17. Wise, E.T.; Singh, N.; Hogan, B.L. J. Chromatogr. A 1996, 746, 109-121. 18. Pinto, D.M.; Arrigaga, E.A.; Craig, D.; Angelova, J.; Sharma, N.;
Ahmadzadeh, H.; Dovichi, N.J. Anal. Chem. 1997, 69, 3015-3021. 19. Baars, M.J.; Patonay, G. Anal. Chem. 1999, 71, 667-671.
20. Moody, E.D.; Viskari, P.J.; Colyer, C.L. J. Chromatogr. B 1999, 729, 55-64. 21. Schmerr, M.J.; Jenny, A.L.; Buligin, M.S.; Miller, J.M.; Hamir, A.N.;
Cutlip, R.C.; Goodwin, K.R. J. Chromatogr. A 1999, 853, 207-214. 22. Tseng, W.L.; Chang, H.-T. Anal. Chem. 2000, 72, 4805-4811.
23. Kessler, M.A.; Meinitzer, A.; Wolfbeis, O.S. Anal. Biochem. 1997, 248, 180-182.
24. Kessler, M.A.; Meinitzer, A.; Petek, W.; Wolfbeis, O.S. Clin. Chem. 1997, 43, 996-1002.
25. Chen, H.-S.; Chang, H.-T. Anal. Chem. 1999, 71, 2033-2036.
26. Richieri, G.V.; Anel, A.; Kleinfeld, A.M. Biochemistry 1993, 32, 7574-7580.
27. Ding, W.; Fritz, J.S. Anal. Chem. 1998, 70, 1859-1865.
28. Fisichella, S.; Foti, S.; Maccarrone, G.; Saletti, R. J. Chromatogr. A 1995, 693, 33-44.
29. Lesca, P.; Paoletti, C. Biochemistry 1969, 64, 913-919. 30. Eshima, N.; Muta, A.; Anai, M. J. Biochem 1983, 94, 345-352.
Received December 20, 2000 Manuscript 5466 Accepted March 19, 2001