The current population structure of the demersal hairtail (Trichiurus japonicus) in the western north Pacific was shaped by the Taiwan strait, as revealed by mitochondrial DNA
9
0
0
全文
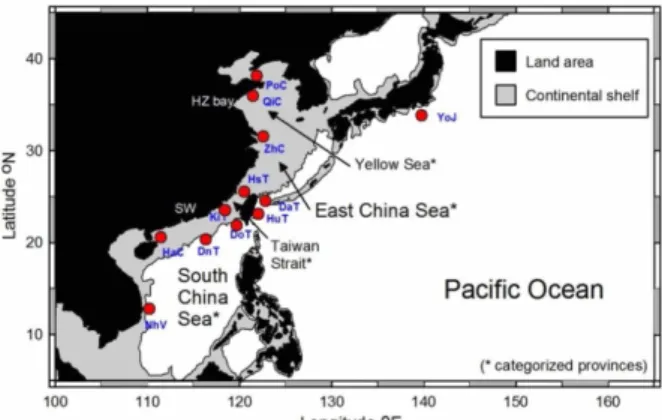
(2) Taiwania. larvae. Since hairtails are neritic spawners with restricted dispersal ability, regional flow patterns have a profound effect in shaping their stock structures. Demersal marine fish species that live along continental shelves are also greatly influenced by historical changes in sea level due to recurrent glaciations. When glaciation proceeds, the sea level drops, continental shelves narrow, and thus demersal habitats shrink. Large-scale habitat rearrangement can significantly shape the composition and the amount of intraspecific genetic variation. This is due to fluctuations in population size during range contraction and expansion events (Avise, 2000; Hewitt, 2000). Genetic diversity may be lost in small-sized populations because of habitat shrinkage and fragmentation, and conversely, genetic diversity may recover after post-glacial population growth because natural selection pressure is relaxed and sub-populations are reconnected. The continental shelves of the East (ECS) and South China Seas (SCS) are the largest two demersal habitats located in the marginal seas of the western North Pacific. Historically, declines in the sea level during glacial periods would have profoundly reduced the depths of the ocean basins and the shelf areas, and consequently might have weakened or stopped prevailing water currents that flow between marginal seas. Understanding marine fragmentation events that interrupt the gene flow among local populations is crucial to delineate stock boundaries for marine conservation. Since fishery stock is by definition a self-sustaining unit, failure to identify natural boundaries can lead to local over-fishing and subsequent unpredictable declines in population size (Utter, 1991; Waples, 1998). Because largehead hairtail is the most abundantly caught species in neritic fisheries in the western North Pacific (Anon., 2010), we chose to focus our efforts on this particular species. We collected samples throughout the western North Pacific from Japan to Vietnam and covered almost all known commercial fishing grounds in the area including its marginal seas of the Yellow Sea (YS), ECS, Taiwan Strait (TS) and SCS. Because the blue mackerel has a similar distributional ranges (Tzeng et al., 2009), we hypothesized that during Pleistocene ice-age maxima, the marine waterway (TS) between the ECS and SCS was effectively closed, and the blocked TS facilitated population differentiation of the hairtail in the western North Pacific.. MATERIALS and METHODS Sampling All fish analyzed in our study were collected by near-shore bottom trawlers or longliners (all worked on a daily basis, producing samples that were collected at 280. Vol. 61, No. 4. most 50 km from the shore) from 12 locations in the western North Pacific (Fig. 1). Our samples were divided into one of four marine provinces: samples from PoC and QiC were from the Yellow Sea (YS); ZhC, DaT, and HuT were from the East China Sea (ECS); HsT, KiT, and DoT were from the Taiwan Strait (TS); and DnT, HaC, and NhV were from the South China Sea (SCS), and YoJ from Japan served as a reference. Intensive sampling in the vicinity of Taiwan was designed to explore ecological and historical roles that the transitional Taiwan Strait may have played in differentiation of the population. The number of samples collected in each location or population is shown in Table 1. The whole fish or a small piece of tissue was obtained from freshly sampled specimens, and preserved in 95% ethanol at -20°C for DNA preparation.. Fig. 1. Sampling localities of hairtail populations in the western North Pacific. Labels of localities are formulized from the first two letters of sampling site (Da, Dashi; Do, Dongan; Dn, Donsa Island; Ha, Haikou; Hs, Hsinchu; Hu, Hualien; Ki, Kinmen; Nh, Nhatrang; Po, Ponlai; Qi, Qingdao; Yo, Yokohama; Zh, Zhousan), and the third capitalized letter denotes the country (C, China; J, Japan; V, Vietnam; T, Taiwan).. DNA extraction, amplification, and sequencing Genomic DNA was isolated from samples of about 5-g muscle or gill tissue. The sample tissue was homogenized and kept at 55°C overnight in lysis buffer (0.1 M EDTA, 0.5 M Tris-HCl (pH 8.0), 1% sodium dodecylsulfate (SDS), and 0.2 mg/mL proteinase K). Total DNA was purified following a standard phenol/chloroform extraction protocol (Sambrook & Russell, 2001). The CF (5’-TAGGCTTGAAAAACCACCGT-3’) and CR (5’-ACAAGAGCGGGGCTCTGG-3’) primer pairs were used to amplify the mitochondrial Cyt-b gene (Tzeng et al. 2007), and the DF (5’-ATATATAGTAATATYAACTTYAGTACACAT-3’) and DR (5’-CTATTGGGGCCTTATCCGGG-3’) primer pairs were used to amplify the mitochondrial D-loop (developed in this study). The amplification reaction was carried out with 100 ng of the template and 1 U Taq DNA polymerase (TaKaRa, Otsu, Japan) in 50 μL vials. The final concentrations were 400 nM of the forward and reverse primers, 100 μM of dNTP, 50 mM. 刊 期 術 學 學 大 臺灣. 庫 料 資.
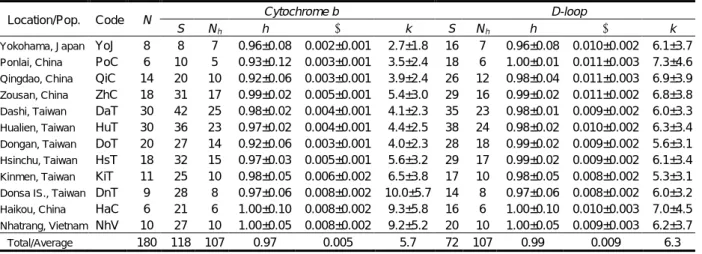
(3) December 2016. Tzeng et al.: Population structure of hairtail. Table 1. Descriptive statistics for hairtail populations, including sample locations, code for populations, sample size (N), number of polymorphic sites (S), number of haplotypes (Nh), haplotype diversity (h), nucleotide diversity (π), and average number of pairwise nucleotide difference (k). Location/Pop.. Code. YoJ Ponlai, China PoC Qingdao, China QiC Zousan, China ZhC Dashi, Taiwan DaT Hualien, Taiwan HuT Dongan, Taiwan DoT Hsinchu, Taiwan HsT Kinmen, Taiwan KiT Donsa IS., Taiwan DnT Haikou, China HaC Nhatrang, Vietnam NhV Yokohama, Japan. Total/Average. N 8 6 14 18 30 30 20 18 11 9 6 10 180. S 8 10 20 31 42 36 27 32 25 28 21 27 118. Nh 7 5 10 17 25 23 14 15 10 8 6 10 107. Cytochrome b h π 0.96±0.08 0.002±0.001 0.93±0.12 0.003±0.001 0.92±0.06 0.003±0.001 0.99±0.02 0.005±0.001 0.98±0.02 0.004±0.001 0.97±0.02 0.004±0.001 0.92±0.06 0.003±0.001 0.97±0.03 0.005±0.001 0.98±0.05 0.006±0.002 0.97±0.06 0.008±0.002 1.00±0.10 0.008±0.002 1.00±0.05 0.008±0.002 0.97 0.005. KCl, and 1.5 mM KCl 2 . The cycling conditions of the polymerase chain reaction (PCR) consisted of an initial denaturation step at 94°C for 3 min, followed by 25 cycles of reactions consisting of 94°C for 30 s, 57°C for 60 s, and 72°C for 70s, with a final extension at 72°C for 10 min. The PCR products were purified with a MinElute PCR Purification Kit, and sequenced on an ABI automatic sequencing machine (Perkin Elmer Corp., Norwalk, CA, USA) using a DYEnamic ET dye terminator cycle sequencing kit (MegaBACE). Sample DNA was sequenced bi-directionally, and the results were checked twice at every site of a sequence. Sequence alignment and data analyses The sequences obtained were aligned automatically and edited using Bioedit (vers. 5.0.6, Hall 1999). Gaps resulting from alignment were treated as missing data. Population genetic statistics were estimated using the software Arlequin 3.1 (Excoffier et al. 2005). The degree of polymorphism for each population was estimated, including the number of polymorphic sites (S), the number of haplotypes (N h ), the haplotype diversity (h; Nei 1987), the nucleotide diversity (π; Nei 1987), and the average number of pairwise nucleotide differences (k; Tajima 1983). The appropriateness of combining Cyt-b and D-loop data in an integrated analysis was determined by a partition homogeneity test (Farris et al. 1995) installed in PAUP* vers. 4.0 (Swofford 2003). This test performed 100 replicates of maximum-parsimony searches on a randomly partitioned dataset. The outcome suggested that the evolutionary properties of Cyt-b and D-loop were congruent (P = 0.12), meaning that it was suitable to combine the two datasets as a unit for estimating one general genetic distance. Genetic differences between each pair of populations were estimated by the fixation index, Φ ST (Excoffier et al. 1992). The significance of the estimations was assessed. k 2.7±1.8 3.5±2.4 3.9±2.4 5.4±3.0 4.1±2.3 4.4±2.5 4.0±2.3 5.6±3.2 6.5±3.8 10.0±5.7 9.3±5.8 9.2±5.2 5.7. S 16 18 26 29 35 38 28 29 17 14 16 20 72. Nh 7 6 12 16 23 24 18 17 10 8 6 10 107. D-loop h π 0.96±0.08 0.010±0.002 1.00±0.01 0.011±0.003 0.98±0.04 0.011±0.003 0.99±0.02 0.011±0.002 0.98±0.01 0.009±0.002 0.98±0.02 0.010±0.002 0.99±0.02 0.009±0.002 0.99±0.02 0.009±0.002 0.98±0.05 0.008±0.002 0.97±0.06 0.008±0.002 1.00±0.10 0.010±0.003 1.00±0.05 0.009±0.003 0.99 0.009. k 6.1±3.7 7.3±4.6 6.9±3.9 6.8±3.8 6.0±3.3 6.3±3.4 5.6±3.1 6.1±3.4 5.3±3.1 6.0±3.2 7.0±4.5 6.2±3.7 6.3. by permutation tests with 1000 rearrangements. Based on analysis of molecular variance (AMOVA) (Excoffier et al. 2005), genetic variance among populations was hierarchically partitioned according to geographic vicinity using the software SAMOVA 1.202 (Dupanloup et al. 2002). This analysis first defines groups of populations with explicit spatial proximity and potential homogeneity, before a maximally differentiated value (Φ CT ) from each other is determined. Based on the combined dataset of Cyt-b and D-loop, historical relationships among populations were estimated using the Neighbor-joining (NJ) method installed in the software MEGA 4 (Kumar et al. 2008). We used the NJ method to find intra-specific distinctions among ecological populations, because it is much simple and faster than the complex maximum likelihood Bayesian methods purposed for seeking all possible inter-specific phylogenetic relationships. For this method, the evolutionary divergence of nucleotide sequences was modeled with the likelihood method in Modeltest 3.7 (Posada and Crandall 1998). Genetic distances were estimated and corrected following the model of Tamura and Nei model (1993), with among-site rate variations adjusted by the shape of the gamma distribution (G = 0.813). The robustness of the NJ topology was examined using 10000 bootstrapped samples. In addition, a minimum-spanning tree was outlined to illustrate the genealogical relationships of the haplotypes using Arlequin 3.1 (Excoffier et al. 2005).. RESULTS High levels of sequence variation The combination of a complete Cyt-b gene (1141 bps) and a portion of the D-loop region (628 ~ 630 bps) of mitochondria exhibited 118 polymorphic sites. These variable sites were used to define 107 haplotypes (Table 1). For the Cyt-b gene, genetic diversity was. 刊 期 術 學 學 大 臺灣. 庫 料 資. 281.
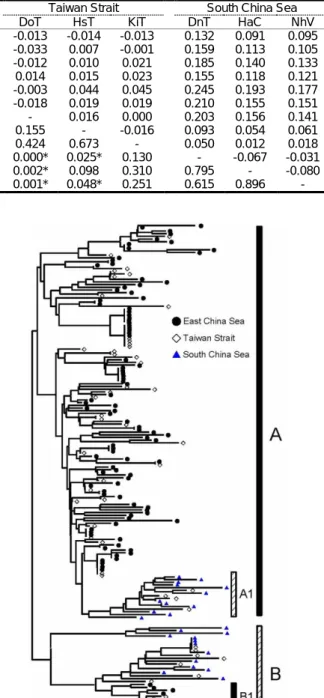
(4) Taiwania. Vol. 61, No. 4. Table 2. Pairwise Φst (above diagonal) and associated P-values (below diagonal) generated from a combination of mitochondrial cytochrome b and D-loop (1771 bps) sequences among hairtail populations in the western North Pacific. Yellow Sea YoJ PoC QiC YoJ 0.016 0.001 PoC 0.326 -0.060 QiC 0.436 0.959 ZhC 0.582 0.370 0.453 DaT 0.074 0.684 0.519 HuT 0.297 0.904 0.779 DoT 0.606 0.827 0.704 HsT 0.612 0.368 0.278 KiT 0.537 0.434 0.190 DnT 0.027* 0.021* 0.000* HaC 0.049* 0.042* 0.001* NhV 0.044* 0.039* 0.000* * Significant at P = 0.05. East China Sea ZhC DaT HuT -0.014 0.041 0.009 0.005 -0.018 -0.036 -0.002 -0.004 -0.014 0.019 0.021 0.106 0.008 0.085 0.209 0.188 0.529 0.941 0.178 0.009* 0.094 0.154 0.033* 0.157 0.001* 0.000* 0.000* 0.009* 0.000* 0.000* 0.001* 0.000* 0.000*. high as shown by haplotype diversity (h = 0.97 on average), while nucleotide diversity was moderate (π = 0.005). The average number of pairwise differences (k) was 5.7. The SCS populations (DnT, HaC, and NhV) had higher than average values of π and k (Table 1). In the D-loop portion (628 ~ 630 bps), an insertion at nucleotide (nt) 361, and a deletion at nt 286, and 72 polymorphic sites were found. The polymorphic sites translated into 107 haplotypes. Among them, the most common haplotype was shared by a group of nine individuals (1 at Ponlai, 1 at Qingdao, 2 at Dashi, 2 at Hualien, 1 at Dongan, and 2 at Nhatrang, covered almost whole studying range), while there were still 85 unique haplotypes. Therefore, the genetic diversity was high estimated from haplotype diversity of 0.99 on average, while nucleotide diversity was moderate only 0.009. Homogeneity tests indicated that nucleotide substitutions were inhomogeneous in the D-loop segment, and most of the polymorphisms were located at the positions of nt 340~390. Details of the descriptive population genetic statistics within each population are shown in Table 1. Population structure The results of pairwise comparisons on the fixation indices (Φ ST ) across the 12 locations are shown in Table 2. Significant genetic differences were found in 25 paired cases (at P = 0.05), suggesting certain populations of the SCS differed from the rest. Population structuring was further explored by the hierarchical AMOVA, and a significant level of genetic structuring was found among all local hairtail populations (Φ ST = 0.046, P < 0.001). Hierarchical partitioning of genetic differences indicated that the maximized value of Φ CT was achieved by a two-gene-pool model as shown by the AMOVA and SAMOVA analyses. The final two-gene-pool model exhibited that populations of the SCS (DnT, HaC, and NhV) were separated from the others, which included Japan (YoJ), YS (PoC and OiC), ECS (ZhC, DaT, HuT,), and TS (DoT, HsT and KiT). Both the pairwise comparisons and the AMOVA analyses confirmed that 282. DoT -0.013 -0.033 -0.012 0.014 -0.003 -0.018 0.155 0.424 0.000* 0.002* 0.001*. Taiwan Strait HsT KiT -0.014 -0.013 0.007 -0.001 0.010 0.021 0.015 0.023 0.044 0.045 0.019 0.019 0.016 0.000 -0.016 0.673 0.025* 0.130 0.098 0.310 0.048* 0.251. South China Sea DnT HaC NhV 0.132 0.091 0.095 0.159 0.113 0.105 0.185 0.140 0.133 0.155 0.118 0.121 0.245 0.193 0.177 0.210 0.155 0.151 0.203 0.156 0.141 0.093 0.054 0.061 0.050 0.012 0.018 -0.067 -0.031 0.795 -0.080 0.615 0.896 -. Fig. 2. The neighbor-joining tree constructed using Tamura and Nei distances with a gamma shape parameter of 1.013 obtained from Modeltest 3.7 for hairtail populations in the western North Pacific.. hairtail populations in the western North Pacific were structured into two distinctive geographical subgroups (i.e., the pan-ECS and the SCS). Historical relationships We assessed the influence of historical events on the hairtail populations by using NJ tree analyses, based on the combined dataset of the Cyt-b and the D-loop sequences (1771 bps). The tree estimation was. 刊 期 術 學 學 大 臺灣. 庫 料 資.
(5) December 2016. Tzeng et al.: Population structure of hairtail. Fig.3. Minimum-spanning network constructed from the haplotypes of mitochondrial cytochrome b sequences, obtained from hairtail populations in the western North Pacific. Filled circles denote samples from the East China Sea (ECS), hollow circles from the South China Sea (SCS), and hatched circles from the Taiwan Strait (transitional zone) situated between the ECS and SCS. The size of the symbols is proportional to the number of individuals sharing a particular haplotype. Each bar-symbol cross connection line represents one mutation step between haplotypes.. parameterized with Tamura-Nei distances and gamma corrections as determined by Modeltest. The tree first branched into two major groups of A and B (Fig. 2). This displayed distinct geographic patterns. Branch A included 65.3% samples from the locations in ECS or vicinities (i.e., ECS+YS+YoJ = 65.3%); detailed by YoJ (4.0%), PoC (4.0%), QiC (9.3%), ZhC (10.0%), DaT (19.3%) and HuT (18.7%). The remaining populations in the branch A were from the SCS (8.0%) and the transitional gateway of TS (26.7%). Branch A also produced a unique sub-branch A1, which was purely composed of only SCS samples (in total 75.0%; including DnT 31.2%, HaC 18.8% and NhV 25.0%) and TS samples (25.0%; HsT 12.5% and KiT 12.5.0%). It is intriguing that all members in the subset A-A1, defined as members of group A without its subgroup A1, were comprised of samples only from the general ECS and TS (no SCS). In summary, two subgroups were identified in the branch A: the major one being formed by the samples from the ECS and TS, and the minor one by samples from the TS and SCS. No branches showed mixing of gene pools of the ECS and SCS. Three quarters of the branch B was composed of. samples from the SCS (43.3%) and TS (30.0%), with the following specific composition: DoT (6.7%), HsT (13.3%), KiT (10.0%), DnT (13.3%), HaC (10.0%) and NhV (20.0%). This branch had a unique sub-branch B1, which contained no members from the SCS but whose members were either from ECS (80.0%; YoJ 20.0 %, ZhC 30.0 %, DaT 10.0 % and HuT 20.0 %) or TS (DoT, 20.0%). In short, two subgroups were found in the B branch, the first was composed of members of the SCS and TS, and the other was formed by members of the ECS and TS. The ECS and SCS were two sheer end-members with TS in the midst. The minimum-spanning network of haplotypes showed two star-like central groups (E1 and E2) formed by samples from the ECS and the transitional TS, and three peripheral groups (S1, S2, and S3) which included samples primarily from the SCS with a small amount of the TS (Fig. 3). Group S1 containing 80% of haplotypes from the SCS was three steps removed from the center of E1, while group S2 with 67% of the haplotypes from the SCS was five steps away from E1. Group S3 was composed purely of haplotypes of the SCS, and was a distant offshoot of the E1 group.. 刊 期 術 學 學 大 臺灣. 庫 料 資. 283.
(6) Taiwania. DISCUSSION Genetic diversity of hairtail populations This study is the first to evaluate the genetic diversity of western North Pacific hairtails using an extensive mitochondrial DNA collection. There also was a high rate of allozyme polymorphisms, with heterozygosity values ranging 0.067 ~ 0.103 (Wang et al. 1994), which are much higher than the average of 0.059 for other bony fishes (Ward et al. 1994). In contrast, nucleotide diversity (π) was relatively low for demersal hairtails (0.005 for Cyt-b and 0.009 for D-loop; Table 1). A similar pattern is found in other demersal fishes, such as willowy flounder (h = 0.94, π = 0.01; Xiao et al. 2008) and king weakfish (h = 0.515 ~ 0.909, π = 0.001 ~ 0.003; Santos et al. 2006). This pattern of genetic diversity can be attributed to rapid population expansion, bottleneck and founder events (Avise 2000). For hairtail populations in the marine provinces of the western North Pacific, it is apparent that the nucleotide diversity was lower in the YS and ECS (π = 0.004) compared to the SCS (0.008), with an intermediate level of diversity in the TS (Table 1). A similar trend of genetic diversity decreasing with increasing latitude has been found for many other fish populations (Gobbiesox maeandricus: Hickerson and Ross 2001; 60 vertebrate species: Martin and McKay 2004; Xiphister:Hickerson and Cunningham 2005; 8 tripterygiid fishes: Hickey et al. 2009). Low nucleotide diversity can result from a selective sweep, a recent founding event, or a small effective population size (Hedrick 2000). A reduction in genetic diversity might result from a population bottleneck due to geological events such as climatic changes and glaciation. Conversely, due to this diversity cline, we may suppose that geological changes in the past several millions years were seemingly more drastic in higher latitudes such as the YS and ECS than in the subtropical SCS regions. Marine barrier and population sub-structuring in various habitats Hairtail populations in the western North Pacific are highly structured, as shown by the hierarchical AMOVA and SAMOVA models - all populations are classified into one of two distinctive groups of the SCS and the pan-ECS (including the YoJ, YS, ECS and TS). However, Φ ST pairwise comparisons demonstrated that three local populations (DoT, HsT and KiT) from the intermediate marine province of the TS, were mixed in their allocation to the ESC or SCS (Figs. 1 & 2); the DoT sample could be categorized as belonging to the ECS, the KiT sample was linked to the SCS, and the HsT sample was mixed (Table 2). Therefore, these three populations represent peripheral isolates of the ECS and SCS primary populations. Our mitochondrial fingerprint analysis suggested that the TS served as a 284. Vol. 61, No. 4. transitional zone, allowing limited intermittent gene intrusions from the two independent populations of the ECS and SCS. If the TS is considered as a marine province, the result of the AMOVA and SMOVA suggest that the TS is more closely linked to the ECS rather than the SCS. Current-day water circulation patterns in the TS change seasonally, that may account for the closer link between the ECS samples and the TS samples. During summer and early autumn, the strong southwesterly monsoon winds prevent the southbound China Coastal Current (CCC) from reaching the southern part of the TS (Jan et al. 2002). During winter and early spring, the northeasterly monsoon blows the CCC further south such that it reaches the southern TS, where a thermo-haline front forms by the confluence of the CCC and an intruding Kuroshio branch (Wang and Chern 1987). Sometimes the front progresses a little further south into the SCS. The spawning period of the hairtail in the northern Taiwan is around March (Jean and Lee 1984), and their larvae could therefore use the CCC to reach the TS. The larval ecology and flow pattern support two independent units of hairtail populations (the ECS and SCS populations). However, four independent units of hairtail were suggested by Wang et al. (1994). They studied allozyme polymorphisms in the YS, ECS, and SCS, and they concluded that there are four local populations from the Chinese coasts: Haizhou (YS), Haigiau (ECS), Sanwue (northern SCS), and Sanya (SCS). Studies postulated that the YS population had been wiped out in the mid-1970s by widespread water pollution and long-term overfishing (Lin 1982). Our samples from PoC might represent immigrants from the ECS after the water quality was improved and the fisheries were more effectively regulated. Using recent samples taken from the YS, Yang and Gao (2007) found that the allozyme patterns supported the YS and ECS being of the same genetic unit. In our study, mitochondrial DNA findings suggested that there is a single population genetic unit for the YS and ESC (Table 2). This pattern may suggest that the ECS population secondarily expanded its range to the YS area recently. Regarding the populations in the SCS, Wang et al. (1994) suggested two groupings off the coast of southern China: Sanwue in the northern SCS close to the TS and Sanya in the middle SCS. These two groups had a rather small allozyme difference of 0.007, which should fall into the category of intra-population variations (0.007 ~ 0.192 for significant inter-population differences according to Ward and Elliott 2001). Mitochondrial differences support these findings as the intra-population differences in the SCS population were low (Table 2). The subdividing of the SCS was not considered reasonable. In short, hairtail species in the western. 刊 期 術 學 學 大 臺灣. 庫 料 資.
(7) December 2016. Tzeng et al.: Population structure of hairtail. North Pacific are structured into only two independent genetic units of the SCS and pan-ECS. Marine fishes are expected generally to exhibit little intra-specific genetic structuring among geographic regions, because oceans often lack effective physical barriers. However, for hairtails in the western North Pacific, a growing number of studies indicated that marine fishes also have a substantial amount of population structuring in marginal seas. Molecular genetic surveys have found evidence of cryptic population structuring in many coastal and neritic species caused by the limited dispersal capacity of fish larvae (Swearer et al. 2002). Knutsen et al. (2003) found that the genetic structure of Atlantic cod was due to limited passive transport of eggs and early larvae across marine boundaries. Even the highly migratory mackerel (Scomber scombrus) was found to exhibit genetic structuring due to its homing behavior (Zardoya et al. 2004). Both reasons could explain sub-structuring of the hairtails in the western North Pacific. Hairtails usually spawn pelagic eggs in inshore areas, and their larvae feed in nearshore waters (Martins and Haimovici 2000). Teleost fishes with pelagic eggs often match their spawning in environment with favorable physical conditions, such as current transport, horizontal advection, stability of the water column, and coastal upwelling (Bakun and Parrish 1980). Hairtail larvae and juveniles mainly eat anchovies, whereas larger adults shift to prey on other fish, such as priacanthids, sphyraenids, and sciaenids (Lee 1978). In order to increase the survival rate and long-term adaptation of their offspring, adult fishes should spawn in areas that are rich in larval food and that harbor larvae from suboptimal habitats. Hairtails chose to spawn when and where anchovies are abundant (Kim et al. 2005). In the ECS, the spawning period of the hairtails ranges from October to August, and it peaks around March in the vicinity of Taiwan (the southern part of the ECS; Jean and Lee 1984), and May to August in the middle of the ECS (Wu 1984). As hairtail maturation is related to water temperature, a geographical gradient of spawning periods that follows latitudinal temperature differences can be observed (Jean and Lee 1984; Wu 1984; Kwok and Ni 1999). The SCS population spawns two months earlier than the ECS population. Although there are widespread spawning locations in the ECS, the locations are most concentrated in the southern portion and least concentrated in the northern region (Wu 1984). Juvenile hairtails migrate northward with prevailing surface currents driving by the SW monsoon in order to feed during spring and summer, and they return back south by the end of autumn as the monsoon begins to switch (Misu 1961). This circular migration route and restricted spawning period highlight a homing behavior that maintains a self-sustained genetic unit in the ECS.. Seasonal water movements also assist the divergence of the ECS population from the SCS, because spawning in the ECS occurs in February through April, at which time the NE monsoon wanes and thus the southern movement of the ECS water is weakened. SCS hairtails spawn during December through February, and in this period, the NE monsoon wind carries the newborn larvae southward. At this point, the TS serves as a northern boundary that prevents the dispersal of eggs and larvae from the SCS to the ECS. Without the help of water circulation, there is little chance for eggs or larvae being dispersed across the marine boundary, thus explaining the geographic subdivision of the hairtails in the western North Pacific.. CONCLUSIONS Hairtails are a ubiquitous marine species, widely distributed around the world, and primarily captured commercially in the western North Pacific. They were long treated as a single biological species (T. lepturus) in catch statistics before the specific status of T. japonicus was confirmed by recent morphometric and Cyt-b analyses. This newly recognized species is the most abundant and most widely distributed trichiurid in the ECS and SCS. Based on the genetic sub-structuring found in this study, we suggest that two independent management units of the ECS and SCS should be implemented to manage these resources.. ACKNOWLEDGEMENTS We would like to thank Dr. Hon-Tsen Yu of the Department of Life Science, National Taiwan University, Taipei, Taiwan for taking samples from Ponlai (China) and Nhatrang (Vietnam) and Dr. Taro Ichii of the National Research Institute of Far Seas Fisheries, Yokohama, Japan for providing samples from Yokohama (Japan). Dr. Zhimeng Zhuang of the Yellow Sea Fisheries Research Institute, Chinese Academy of Fishery Sciences and Dr. Feng You of the Institute of Oceanography, Academia Sinica, Qingdao, China assisted with collecting samples in Ponlai, Qingdao and Zousan (China), and Dr Shao-Wu Yin of the Ocean College of Hainan University, Haikou, China assisted with sample collection in Haikou (China). This work was supported by grants (NSC96-2621-B-002-013 & NSC99-2621-B-002-004-MY3) from the National Science Council, Taiwan. Insightful suggestions from two anonymous reviewers are highly appreciated. The authors are grateful to Ms. K.Z. Chang for helping with laboratory administration.. LITERATURE CITED. 庫 料 資. Anonymous. 2010. FAO Yearbook. Fishery and Aquaculture Statistics. 2008. Food and Agriculture Organization, Rome. Avise, J.C. 2000. Phylogeography: the history and formation of species. Harvard University Press, Cambridge. 刊 期 術 學 學 大 臺灣. 285.
(8) Taiwania Bakun, A, and R.H. Parrish. 1980. Environmental inputs to fishery population models for eastern boundary current regions. In: Sharp, G. D. (ed), Workshop on the effects of environmental variation on the survival of larval pelagic fishes, Lima, Peru, 20 April– 5 May 1980, UNESCO, Lima. Dupanloup, I., S. Schneider and L. Excoffier. 2002. A simulated annealing approach to define the genetic structure of populations. Mol. Ecol. 11(12): 571–2581. Excoffier, L., P. Smouse and J. Quattro. 1992. Analysis of molecular variance inferred from metric distances among DNA haplotypes: Application to human mitochondrial DNA restriction data. Genetics 131: 479–491. Excoffier, L., G. Laval and S. Schneider. 2005. Arlequin ver. 3.0: An integrated software package for population genetics data analysis. Evol Bioinform Online 1: 47–50. Farris, J. S., M. Kallersjo, A.G. Kluge and C. Bult. 1995. Testing significance of incongruence. Cladistics 10(3): 315–319. Grosberg, R. K. and D. R. Levitan. 1992. For adults only? Supply-side ecology and the history of larval biology. Trends Ecol. Evol. 7(4): 130–133. Hall, T. A. 1999. BioEdit: a user-friendly biological sequence alignment editor and analysis: program for Windows 95/98/NT. Nucleic Acids Symp. Ser. 41: 95–98 Hedrick, P. W. 2000. Genetics of Populations, 2nd edition. Jones and Bartlett, Sudbury Hewitt, G. M. 2000. The genetic legacy of the Quaternary ice ages. Nature 405(6789): 907–913. Hickey, A. J. R., S. D. Lavery, D. A. Hannan, C. S. Baker and K. D. Clements. 2009. New Zealand triplefin fishes (Family Tripterygiidae): contrasting population structure and mtDNA diversity within a marine species flock. Mol. Ecol. 18(4): 680–696. Hickerson, M. J. and C. W. Cunningham. 2005. Contrasting quaternary histories in an ecologically divergent sister pair of low-dispersing intertidal fish (Xiphister) revealed by multilocus DNA analysis. Evolution 59(2): 344–360. Hickerson, M. J. and J. R. Ross. 2001. Post-glacial population history and genetic structure of the northern clingfish (Gobbiesox maeandricus), revealed from mtDNA analysis. Mar. Biol. 138(2): 407–419. Jan, S, J. Wang, C.-S. Chern and S.-Y. Chao. 2002. Seasonal variation of the circulation in the Taiwan Strait. J. Mar. Syst. 35: 249–268. Jean, C.-T. and S.-C. Lee. 1984. Reproductive biology of the ribbonfishes, Trichiurus lepturus and T. japonicus of Taiwan. Bull. Inst. Zool. Acad. Sinica. 23: 9–20. Kim, J.-Y., Y.-S. Kang, H.-J. Oh, Suh Y.-S. and J.-D. Hwang. 2005. Spatial distribution of early life stages of anchovy (Engraulis japonicus) and hairtail (Trichiurus lepturus) and their relationship with oceanographic features of the East China Sea during the 1997-1998 El Nino event. Estuar. Coast Shelf Sci. 63(1-2): 13–21. Knutsen, H., P. E. Jorde, C. Andre and N. C. Stenseth. 2003. Fine-scaled geographical population structuring in a highly mobile marine species: the Atlantic cod. Mol. Ecol. 12(2): 385–394. Kumar, S., J. Dudley, M. Nei and K. Tamura. 2008. MEGA: A biologist-centric software for evolutionary analysis of DNA and protein sequences. Briefings in Bioinform 9(4): 299–306.. 286. Vol. 61, No. 4. Kwok K.-Y. and H.-I. Ni. 1999. Reproduction of cutlassfishes Trichiurus spp. from the South China Sea. Mar. Ecol. Prog. Ser. 176: 39–47. Lee, S.-C. 1978. Food and feeding habits of ribbonfishes, Trichiurus japonicus and T. lepturus. Bull. Inst. Zool. Acad. Sinica. 17: 117–124. Lin, J.-Q. 1982. On the cases of the prematuration of the East China Sea hairtail (Trichiurus haumela). Mar. Sci. 4: 9– 15. [in Chinese] Lin, L.-S., J.-H. Cheng and J.-Z. Ling. 2007. Analysis on recent status of bottom trawl fishery recourses in the East China Sea. Mar. Fish. 29(4): 371–374. [in Chinese] Lin, X.-Z., F.G. Wang, J.-M. Pan, X.-D. Liu and Y.-J. Zheng. 1965. On the race of the hairtails Trichiurus haumela (Forskal) inhabiting coastal waters of China. J. Fish. China 2: 11–23. [In Chinese] Martin, P.R. and J.K. McKay. 2004. Latitudinal variation in genetic divergence of populations and the potential for future speciation. Evolution 58(5): 938–945. Martins, A.S. and M. Haimovici. 2000. Reproduction of the cutlassfish Trichiurus lepturus in the southern Brazil subtropical convergence ecosystem. Sci. Mar. 64: 97–105. McQuinn, I. H. 1997. Metapopulations and the Atlantic herring. Rev. Fish Biol. Fish. 7(3): 297–329. Misu, H. 1961. Studies on the fisheries biology of the ribbonfish (Trichiurus lepturus L.) in the East China and the Yellow Seas. (3) Distribution, migration and consideration of population. Bull. Seikai Reg. Fish. Res. Lab. 24: 115–131. Nei, M. 1987. Molecular Evolutionary Genetics. Columbia University Press, New York. Omori, M and Y. Seino. 1993. Feeding preference of the hairtail Trichurus lepturus Linnaeus in and neighbouring the waters where Sergia lucens swarms in Suruga Bay. Bull. Japan Soc. Fish. Oceanogr. 57: 15–23. Palumbi, S.R. 1994. Genetic divergence, reproductive isolation, and marine speciation. Ann. Rev. Ecol. Evol. Syst. 25(1): 547–572. Posada, D. and K. A. Crandall. 1998. MODETTEST: testing the model of DNA substitution. Bioinformatics 14(9): 817–818. Sambrook, J. and D. W. Russell. 2001. Molecular Cloning: A Laboratory Manual, 5th edition. Cold Spring Harbor Laboratory Press, New York. Santos, S., T. Hrbek, I. P. Farias, H. Schnider and I. Sampaio. 2006. Population genetic structuring of the king weakfish, Macrodon ancylodon (Sciaenidae), in Atlantic coastal waters of South America: deep genetic divergence without morphological change. Mol. Ecol. 15(14): 4361–4373. Swearer, S.E., J. S. Shima, M. E. Hellberg, S. R. Thorrold, G. P. Jones, D. R. Robertson, S. G. Morgan, K. A. Selkoe, G. M. Ruiz and R. R. Warner. 2002. Evidence of self-recruitment in demersal marine population. Bull. Mar. Sci. 70: 251–271. Swofford, D. L. 2003. PAUP*. Phylogenetic Analysis Using Parsimony. Version 4. Sinauer Associates, Sunderland. Tajima, F. 1983. Evolutionary relationship of DNA sequences in finite populations. Genetics 105: 437–460. Tamura, K. and M. Nei. 1993. Estimation of the number of nucleotide substitutions in the control region of mitochondrial DNA in humans and chimpanzees. Mol. Biol. Evol. 10: 512–526. 刊 期 術 學 學 大 臺灣. 庫 料 資.
(9) December 2016. Tzeng et al.: Population structure of hairtail. Tzeng, C.-H., C.-S. Chen and T.-S. Chiu. 2007. Analysis of morphometry and mitochondrial DNA sequences from two Trichiurus species in waters of the western North Pacific: taxonomic assessment and population structure. J. Fish Biol. 70(sb): 165–176. Tzeng, C.-H., C.-S. Chen, P.-C. Tang and T.-S. Chiu. 2009. Microsatellite and mitochondrial haplotype differentiation in blue mackerel (Scomber australasicus) from the western North Pacific. ICES J. Mar. Sci. 66(5): 816–825. Utter, F. M. 1991. Biochemical genetics and fishery management: an historical perspective. J. Fish Biol. 39: 1–20. Wang, J. and C.-S. Chern. 1987. The warm-core eddy in the northern South China Sea. I. preliminary observation on the warm-core eddy. Acta Oceanogr. Taiwanica 18: 92– 103. Wang, K.-L., P.-J. Zhang, L.-Y. Liu, F. You, C. Xu and J.-F. Wang. 1994. Biochemical genetic structure and identification of hairtail fish (Trichiurus) population in Chinese coastal waters. Acta Oceanologica Sinica 16: 93– 104 [in Chinese] Waples, R. S. 1998. Separating wheat from the chaff: patterns of genetic differentiation in high gene flow species. J. Hered. 89(5): 438–450.. Ward, R.D. and N. G. Elliott. 2001. Genetic population structure of species in the South East Fishery of Australia. Mar. Freshwater Res. 52(4): 563–573. Ward, R. D., M. Woodwark and D. O. F. Skibinski. 1994. A comparison of genetic diversity levels in marine, freshwater and anadromous fishes. J. Fish Biol. 44(2): 213–232. Wu, J.-Z. 1984. Spawning characters of Trichiurus haumela (Forskal) in off-shore waters of Zhejiang province. J. Zhejiang Ocean Univ. 3: 109–121. [in Chinese] Xiao, Y., M. Takahashi, T. Yanagimoto, Y. Zhang, T. Gao, M. Yabe and Y. Sakurai. 2008. Genetic variation and population structure of willowy flounder Tanakius kitaharai collected from Aomori, Ibaraki and Niigata in Northern Japan. Afr. J. Biotechnol. 7: 3836–3844. Yang, T.Y. and T. X. Gao. 2007. Isozyme analyses of Trichiurus haumela in the Yellow Sea and East China Sea. Mar. Fish. Res. 28: 44–49. [in Chinese] Zardoya, R., R. Castilho, C. Grande, L. Favre-Krey, S. Caetano, S. Marcato, G. Krey and T. Patarnello. 2004. Differential population structuring of two closely related fish species, the mackerel (Scomber scombrus) and the chub mackerel (Scomber japonicus), in the Mediterranean Sea. Mol. Ecol. 13(7): 1758–1798.. 刊 期 術 學 學 大 臺灣. 庫 料 資 287.
(10)
數據
相關文件
(Another example of close harmony is the four-bar unaccompanied vocal introduction to “Paperback Writer”, a somewhat later Beatles song.) Overall, Lennon’s and McCartney’s
After the Opium War, Britain occupied Hong Kong and began its colonial administration. Hong Kong has also developed into an important commercial and trading port. In a society
The Secondary Education Curriculum Guide (SECG) is prepared by the Curriculum Development Council (CDC) to advise secondary schools on how to sustain the Learning to
Robinson Crusoe is an Englishman from the 1) t_______ of York in the seventeenth century, the youngest son of a merchant of German origin. This trip is financially successful,
fostering independent application of reading strategies Strategy 7: Provide opportunities for students to track, reflect on, and share their learning progress (destination). •
volume suppressed mass: (TeV) 2 /M P ∼ 10 −4 eV → mm range can be experimentally tested for any number of extra dimensions - Light U(1) gauge bosons: no derivative couplings. =>
Define instead the imaginary.. potential, magnetic field, lattice…) Dirac-BdG Hamiltonian:. with small, and matrix
• Formation of massive primordial stars as origin of objects in the early universe. • Supernova explosions might be visible to the most
