Prospective validation of American Diabetes Association Risk Tool for predicting pre-diabetes and diabetes in Taiwan–Taichung Community Health Study
Chia-Ing Li1,2,3 , Ling Chien†4,, Chiu-Shong Liu5,6, Wen-Yuan Lin5,7, Ming-May Lai5,7, Cheng-Chun Lee2,8, Fei-Na Chen6, Tsai-Chung Li*4,9,10,11, Cheng-Chieh Lin*1,5,7,12
1 Department of Medical Research, China Medical University Hospital, Taichung, Taiwan
2 School of Medicine, College of Medicine, China Medical University, Taichung, Taiwan
3 Institute of Public Health, College of Public Health, China Medical University, Taichung, Taiwan
4 Graduate Institute of Biostatistics, College of Public Health, China Medical University, Taichung, Taiwan
5 Department of Family Medicine, China Medical University Hospital, Taichung, Taiwan
6 Department of Social Medicine, College of Medicine, China Medical University, Taichung, Taiwan
7 Department of Family Medicine, College of Medicine, China Medical University, Taichung, Taiwan
8 Department of Neurology, China Medical University Hospital, Taichung, Taiwan 9 Graduate Institute of China Medical Science, College of Chinese Medicine, China
Medical University, Taichung, Taiwan
10 Biostatistics Center, China Medical University, Taichung, Taiwan 11 Institute of Health Care Administration, College of Health Science, Asia
University, Taichung, Taiwan
12 School and Graduate Institute of Health Care Administration, College of Public Health, China Medical University, Taichung, Taiwan
* Corresponding to: Cheng-Chieh Lin & Tsai-Chung Li, China Medical University and Hospital, 2 Yu-De Road, Taichung, 40421, Taiwan, Tel: 886-4-22052121 ext. 7629, Fax: 886-4-22335695, e-mail: [email protected]
ABSTRACT
Background A simple diabetes risk tool that does not require laboratory tests would
be beneficial in screening individuals at higher risk. Few studies have evaluated the
ability of these tools to identify new cases of pre-diabetes. This study aimed to assess
the ability of the American Diabetes Association Risk Tool (ADART) to predict the
3-year incidence of pre-diabetes and diabetes in Taiwanese.
Methods This was a 3-year prospective study of 1021 residents with normoglycemia
at baseline, gathered from a random sample of residents aged 40-88 years in a
metropolitan city in Taiwan. The areas under the curve (AUCs) of three models were
compared: ADART only, ADART plus lifestyle behaviors at baseline, and ADART
plus lifestyle behaviors and biomarkers at baseline. The performance of ADART was
compared with that of 16 tools that had been reported in the literature.
Results The AUCs and their 95% confidence intervals (CIs) were 0.60 (0.54-0.66) for
men and 0.72 (0.66-0.77) for women in model 1; 0.62 (0.56-0.68) for men and 0.74
(0.68-0.80) for women in model 2; and 0.64 (0.58-0.71) for men and 0.75 (0.69-0.80)
for women in model 3. The AUCs of these three models were all above 0.7 in women,
but not in men. No significant difference in either women or men (p=0.268 and 0.156,
respectively) was observed in the AUC of these three models. Compared to 16 tools
women.
Conclusions ADART is a good screening tool for predicting the three-year incidence
of pre-diabetes and diabetes in females of a Taiwanese population. The performance
of ADART in men was similar to the results with other tools published in the
literature. Its performance was one of the best among the tools reported in the
literature.
Key words prospective study, general population, pre-diabetes, diabetes, American Diabetes Association Risk Tool
Introduction
Diabetes is an important public health problem in the world [1], even in developing countries [2]. In Lin’s study, using WHO diagnostic criteria, the
prevalence rates of diabetes and impaired glucose regulation (IGR) were 9.51% (male, 10.08%; female, 9.14%) and 14.40% (male, 14.48%; female, 14.35%) respectively in Fujian province, southeast China [2]. The prevalence of type 2 diabetes in
middle-aged adults in Taiwan increased steadily from 5.1% to 8.2% to 12.8% in 1970, 1986 and 1993, respectively [3, 4]. Among men aged 65 years and above, as reflected in the National Nutrition Survey in Taiwan, the prevalence increased dramatically from 13.1% to 17.6% to 28.5% in 1993–1996, 2002 and 2005–2008, respectively [4]. Newly diagnosed diabetes was found in 53.44% of diabetes subjects [3].
Diabetes has become one of the most challenging diseases threatening the public [5], hence early screening and effective prevention of diabetes has become a major public health issue. If we can prevent diabetes in the early stage, then we can take action against the disease and disability, and reduce complications and even death. To increase the sensitivity of the diagnostic test, the American Diabetes Association (ADA) lowered the cutoff for IFG from 110 to 100 mg/dl [6]; it was estimated that the number of Americans thought to have “pre-diabetes” was 41 million, using this cutoff point [7].
A simple diabetes risk tool that does not require any laboratory tests would be beneficial in screening individuals at higher risk. Previous cross-sectional or
longitudinal screening studies have evaluated the performance of questionnaire-based screening tools in identifying the prevalence or incidence of diabetes (8-23); however, few studies have evaluated the ability of those tools to identify new cases of
pre-diabetes.
for screening pre-diabetes has never been reported. To remedy this, we have set three aims for this study. First, we aimed to evaluate the performance of the American Diabetes Association Risk Tool (ADART) in identifying 3-year incident cases of pre-diabetes and diabetes in a prospective cohort study of Taiwanese aged 40-88 years in a metropolitan city in Taiwan. Second, we compared its performance with that of ADART plus lifestyle behaviors at baseline, and ADART plus lifestyle behaviors and biomarkers at baseline in this sample. Third, we compared the performance of
ADART in identifying the incidence of pre-diabetes and diabetes with that of 16 diabetes screening tools that had been reported in the literature.
Methods
Study population
This was a longitudinal epidemiological study based on data from the Taichung Community Health Study (TCHS). At baseline, a total of 2359 residents of Taichung City in Taiwan, aged 40 and over, were randomly selected in October 2004 using multistage sampling [25]. During the period April 2007 to June 2009, the original participants were invited to take part in a follow-up examination, and 1631 of the 2359 original participants agreed to participate. Among them, 610 (37%) were excluded from the analysis because they either had a history of diabetes mellitus or had evidence of pre-diabetes (FPG 100 mg/dl, according to the ADA). Therefore, the study population comprised 1021 individuals with normal blood glucose levels. This study was approved by the Human Research Committee of the China Medical
University Hospital and written informed consent was obtained from each participant. Data collection
Anthropometric measurements were obtained during the complete physical examination. Weight and height were measured on an auto-anthropometer (super-view, HW-666) while the subjects were shoeless and wearing light clothing. Body mass
index (BMI) was defined as weight in kilograms divided by height in meters squared. With the participant standing, waist circumference was measured midway between the superior iliac crest and the costal margin.
Blood pressure was measured using an electronic device (COLIN, VP-1000, Japan) three times after the subjects had rested for 20 minutes. The lowest systolic and diastolic blood pressure was recorded. Blood was drawn from an antecubital vein in the morning after a 12-hour overnight fast and was sent for analysis within four hours of blood collection. Biochemical markers such as fasting plasma glucose, high-density lipoprotein cholesterol (HDL-C), triglyceride, urine albumin, and creatinine were analyzed with a biochemical autoanalyzer (Beckman Coluter
Synchron System, Lx-20, Fullerton, CA, USA) at the Clinical Laboratory Department of China Medical University Hospital. The interassay and intraassay CVs for fasting plasma glucose were 4% and 4%, respectively. We measured cholesterol and
triglyceride in serum mode. Triglyceride levels were determined by an enzymatic colorimetric method. The HDL-C level was measured using a direct HDL-C method, and the low-density lipoprotein cholesterol (LDL-C) level was measured using a direct LDL-C method.
Data on sociodemographic characteristics, including gender, smoking, drinking, betel nut chewing, physical activity, time spent watching TV every week, family history of diabetes, family history of cardiovascular-related diseases,
physician-diagnosed diseases, and medication history were collected during the complete physical examination. Information regarding time spent watching TV was obtained using the open question “On average, how many hours a day (or a week) do you spend watching TV?”
American Diabetes Association Risk Tool
pre-diabetes [24]. The screening tool comprises eight self-reported items for both men and women, including age 45 years, BMI 25 kg/m2, family history of diabetes, race or ethnicity, level of physical activity, previously identified IFG or IGT, high blood pressure, HDL cholesterol ≦35 mg/dl (0.90 mmol/l) and/or triglyceride level 250 mg/dl (2.82 mmol/l), and history of vascular disease. There are two additional items for women: history of gestational diabetes mellitus (GDM) or delivery of a baby weighing >4000 grams (9 lbs), and the presence of polycystic ovary syndrome. In this study, we did not take race or ethnicity into account.
Statistical analysis
Baseline characteristics of individuals who were followed up and those who were not were compared using standardized mean differences, calculated as the difference in means of a variable divided by a pooled estimate of the standard deviation of the variable. This measure is not influenced by sample size and is useful for comparing cohorts in large observational studies. A value of 0.1 SD or less indicates a negligible difference in means between groups [26].Differences in proportions were assessed using the Chi-square test. To validate the performance of ADART combined with different diabetes risk factors, we derived three logistic regression models: ADART only, ADART plus lifestyle behaviors at baseline, and ADART plus lifestyle behaviors and biomarkers at baseline. Those variables which were statistically significant at a level of 0.25 were brought into the models [27]. A nonparametric method was used to test whether the areas under the curve (AUCs) for each receiver operating
characteristic curve of these three models or among different tools were different [28]. Determination of the optimal cutoff points that could be used to detect pre-diabetes or diabetes was based on the Youden index. We also calculated the net reclassification improvement (NRI) and integrated discrimination improvement (IDI) of the models that included ADART plus lifestyle behaviors at baseline or ADART plus lifestyle
behaviors and biomarkers at baseline compared with the model with ADART only according to the method of Pencina et al. [29]. For NRI, four risk categories were chosen a priori: very low risk (<10%), low risk (10–20%), intermediate (20-30%) and high risk (>30%).
Results
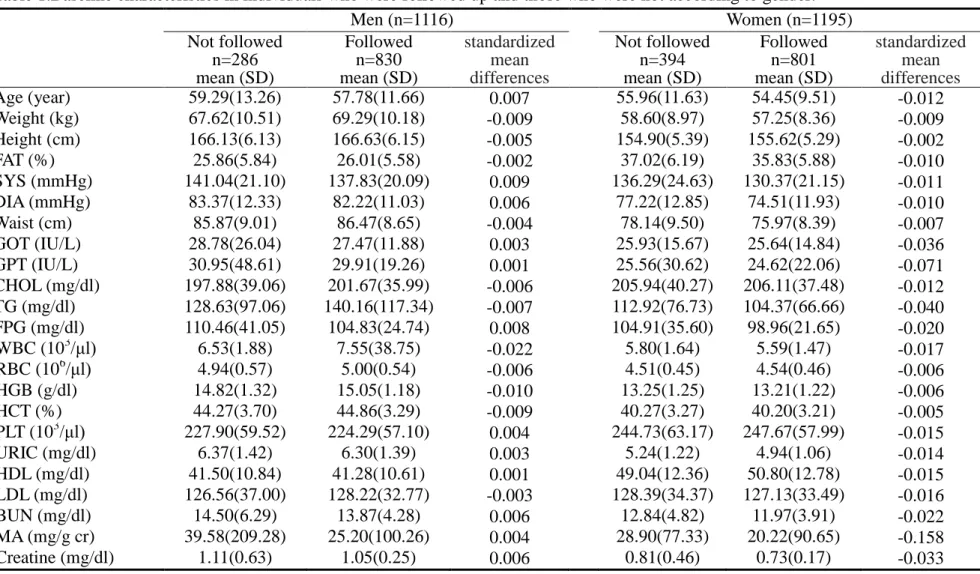
In general, there were no significant differences in distributions of
sociodemographic variables, anthropometric measurements, or levels of biomarkers between the men and women who were followed up and those who were not (Table 1). Of the 1021 participants in this sample, 184 (18%) had elevated FPG levels (≧100 mg/dl) during the three-year follow-up period. Men with abnormal FPG levels had lower monthly incomes, but had a higher prevalence of family history of
hyperlipidemia, higher diastolic blood pressure and triglyceride levels than men with normal levels of FPG. Women with abnormal FPG levels had lower levels of
education but higher weight, larger waist size, higher BMI, systolic and diastolic blood pressure, triglyceride levels and higher Framingham scores than women with normal FPG levels.
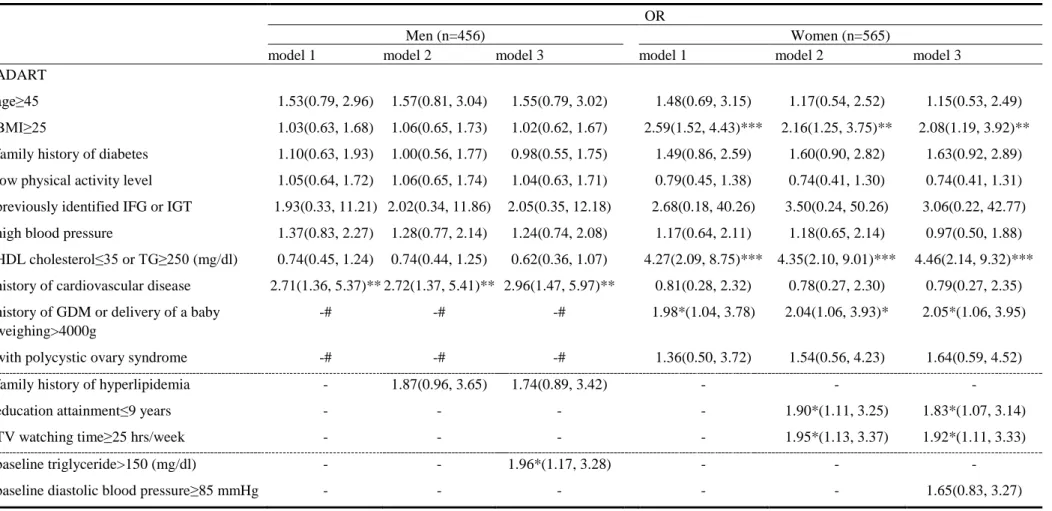
Model 1 showed that of the eight self-reported ADART variables, only a history of cardiovascular disease was associated with an increased incidence of abnormal FPG in men (OR=2.71, p<0.01) (Table 2). Model 1 also revealed that the likelihood of having abnormal FPG levels was higher in women with BMI≧25 kg/m2 (OR=2.59, p<0.001), HDL <35 mg/dl or TG≧250 mg/dl (OR=4.27, p<0.001), or gestational diabetes, or in women who delivered a neonate weighing >4000g (OR=1.98, p<0.05). In model 2, we further considered family history and lifestyle behaviors. Men with a family history of hyperlipidemia were at increased risk of abnormal FPG at a level of significance of 0.25. Women who had less than 9 years of education and those who watched TV for greater than or equal to 25 hours per week were at significantly
increased risk of abnormal FPG.
Model 3, which took ADART plus lifestyle behaviors and biomarkers at baseline into account, revealed that a history of cardiovascular disease and hypertriglyceride at baseline were significant variables in the final model in men; in women, however, there were no additional significant variables.
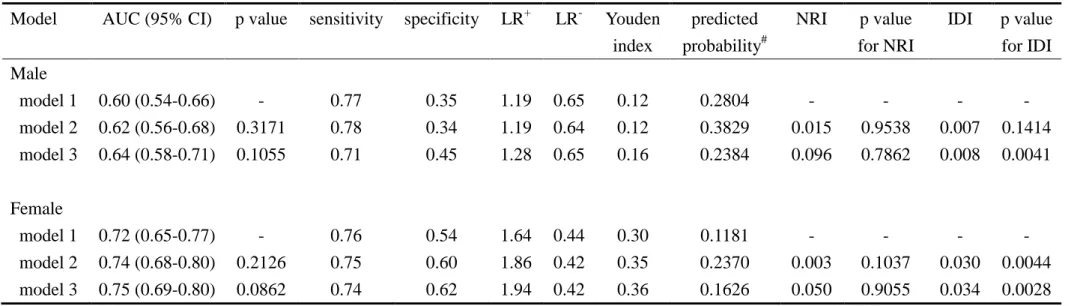
The areas under the receiver operating characteristic curves (AUC) for these three multivariate models were similar in men (AUC=0.60, 95% CI=0.54-0.66 for model 1; AUC=0.62, 95% CI=0.56-0.68 for model 2; and AUC=0.64, 95%
CI=0.58-0.71 for model 3; p value for overall test: 0.268) (Figure 1A). The AUC for these three multivariate models were also similar in women (AUC=0.72, 95% CI=0.66-0.77 for model 1; AUC=0.74, 95% CI=0.68-0.80 for model 2; and
AUC=0.75, 95% CI=0.69-0.80 for model 3; p value for overall test: 0.156) (Figure 1B); however, they were all above 0.7 and were much larger than those for men. Using the Youden index to determine the optimal cutoff points, we found that the sensitivity was 0.77 for men and 0.76 for women, and that the specificity was 0.35 for men and 0.54 for women (Table 3). In men, net reclassification improved by 1.5% when family history of hyperlipidemia was entered (model 2) and improved by 9.6% when baseline triglyceride was further entered (model 3) (p=0.9538 and 0.7862, respectively). The integrated discrimination improved by 0.007 and 0.008 for models 2 and 3, respectively (p=0.1414 and 0.0041, respectively). In women, net
reclassification improved by 0.3% when education and time for TV watching were entered (model 2) and improved by 5.0% when baseline diastolic blood pressure was further entered (model 3) (p=0.1037 and 0.9055, respectively). The integrated
discrimination improved by 0.030 and 0.034 for models 2 and 3, respectively (p=0.0044 and 0.0028, respectively).
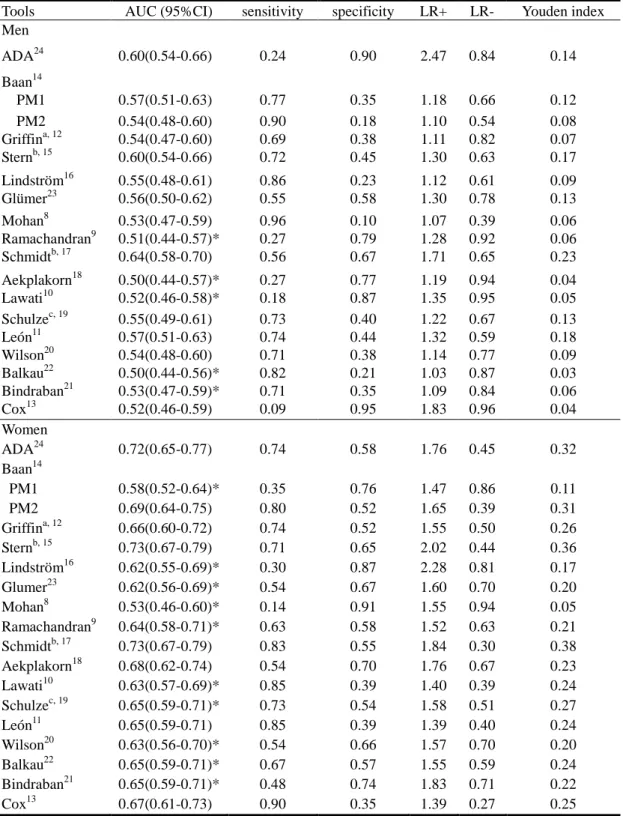
diabetes in our study are summarized in Table 4. The largest AUC for pre-diabetes and diabetes in men was 0.64 (95% CI: 0.58-0.70), developed by Schmidt, with 56% sensitivity and 67% specificity using optimal cutoff values. The AUCs of the ROC for pre-diabetes and diabetes using the ADA tool were significantly greater than those for the tools developed by Ramachandran, Aekplakorn, Lawati, Balkau, Bindraban, but there was no statistical difference in the AUCs of the ROC between the ADA tool and the tools developed by Baan, Griffin, Stern, Lindström, Glumer, Mohan, Schulze, de León, Cox, Wilson, and Schmidt. The largest AUC of the ROC for pre-diabetes and diabetes in women was 0.72 (95% CI: 0.65-0.77), with 74% sensitivity and 58% specificity. The AUCs for the ADA tool were significantly greater than for the tools developed by Baan PM1, Lindström, Glumer, Mohan, Romachandran, Lawati, Schulze, Balkau, Bindraban, and Wilson, but there were no statistical differences in the AUCs between the ADA tool, and the tools developed by Baan PM2, Griffin, Stern, Aekplakorn, de León, Cox, and Schimidt for pre-diabetes and diabetes.
None of these tools had a positive likelihood ratio greater than or equal to 4 in either men or women. On the other hand, three tools used for males and 10 for
females had a negative likelihood ratio less than or equal to 0.6. These useful tools for men were developed by Stern, Mohan, and Leon, and for women, were developed by the ADA, Baan, Griffin, Stern, Schmidt, Lawati, Schulze, Leon, Balkau, and Cox. Discussion
In the current study, we evaluated the performance of ADART in predicting pre-diabetes and diabetes based on questionnaires in a prospective cohort of Taiwanese. We found that ADART, which measures self-report variables including age, family history of diabetes, BMI, physical activity, known history of hypertension, gestational diabetes history, and obesity, was a valid tool for predicting the 3-year incidence of pre-diabetes and diabetes, in ethnic Chinese women.
After taking additional demographic factors, lifestyle behaviors, physiological factors and biomarkers into account, the differences in AUCs among these three ROCs were not significant in either men or women. Especially, when biomarkers were added to the model with ADART only, there was no improvement in the prediction of 3-year incidence in both men and women. Because ADART plus biomarkers at baseline did not improve the prediction of the three-year incidence of pre-diabetes and diabetes, compared with ADART only, this may indicate that
ADART alone can be applied to the general population for screening pre-diabetes and diabetes, or it may indicate that our study did not have enough power due to the moderate size of the sample. However, effect sizes calculated by the differences in AUC in men and women were 0.04 and 0.03, in sensitivity, 0.06 and 0.02, and in specificity, 0.1 and 0.08, respectively. Given this small magnitude of increase in effect size, there was limited improvement in screening pre-diabetes and diabetes.
An extensive literature review revealed that there are 16 measures for screening and identifying diabetes addition to ADART [8-23]. We found that only the tool developed by the Atherosclerosis Risk in Community (ARIC) Study had a higher AUC than that of ADART (0.64 vs. 0.60 in men; 0.73 vs. 0.72 in women), although the difference in the AUC between the two measures was not significant. The AUC for ADART were significantly higher than those for the tools developed by
Ramachandran, Aekplakorn, Al-Lawati, Balkau, and Bindraban [9, 18, 10, 21, 22] for men, and by Baan, Lindström, Glumer, Mohan, Romachandran, Al-Lawati, Schulze, Balkau, Bindraban, and Wilson for women [8-10, 14, 16, 19, 20, 21, 22, 23]. The predictive ability of ADART indicates that this tool can be used in clinical practice to assist in medical decision-making and to counsel people regarding the likely course of their potential disease. In particular, early lifestyle intervention and counseling should be implemented in order to reduce the risk of disease. We found that the screening
program combined with lifestyle behaviors or blood testing performed slightly better in men than in women. Although ADART was developed to be used in white and black populations, this risk assessment tool performed well in this Taiwanese population.
This is the first study to prospectively validate a tool for risk assessment of pre-diabetes and diabetes. Although we used a standardized data collection procedure and evaluated a large number of behavioral factors, we did not perform oral glucose tolerance testing or measure the 2-h glucose concentration. In addition, some of the variables measured with other tools, such as steroid use in Griffin’s study and
consumption of red meat and whole grain in Schulze’s study, were not included when we compared the predictive ability of ADART with that of the other tools.
In conclusion, we found that the use of ADART alone in community screening predicts the 3-year incidence of pre-diabetes and diabetes well in females. Its
performance was one of the best among the tools reported in the literature. This was the first testing of this simple screening tool in the Taiwanese population.
References
[1] Wild, S., Roglic, G., Green, A., Sicree, R., & King, H. (2004) Global prevalence of diabetes: estimates for the year 2000 and projections for 2030. Diabetes Care, 27(5), 1047-1053.
[2] Lin L, Chen G, Zou X, Zhao J, Zhu F, et al (2009) Diabetes, pre-diabetes and associated risks on Minnesota code-indicated major electrocardiogram
abnormality among Chinese: a cross-sectional diabetic study in Fujian province, southeast China. Obes Rev 10(4): 420-430.
[3] Pan WH, Yeh WT, Chang HY, Hwu CM, Ho LT (2003) Prevalence and
awareness of diabetes and mean fasting glucose by age, sex, and region: results from the Nutrition and Health Survey in Taiwan, 1993-1996. Diabet Med 20: 182-185.
[4] Tai TY, Yang CL, Chang CJ, Chang SM, Chen YH, et al (1987) Epidemiology of diabetes mellitus among adults in Taiwan, R.O.C. J Med Assoc Thai 70(Suppl. 2): 42-48.
[5] Roglic G, Unwin N, Bennett PH, Mathers C, Tuomilehto J, et al (2005) The Burden of Mortality Attributable to Diabetes: Realistic estimates for the year 2000 Diabetes Care 28:2130–2135.
[6] Report of the expert committee on the diagnosis and classification of diabetes mellitus. (2003) Diabetes Care 26 (Suppl 1): S5-S20.
[7] Phillips LS, Weintraub WS, Ziemer DC, Kolm P, Foster JK, et al (2006) All pre-diabetes is not the same: metabolic and vascular risks of impaired fasting glucose at 100 versus 110 mg/dl: the Screening for Impaired Glucose Tolerance study 1 (SIGT 1). Diabetes Care 29(6): 1405-1407.
[8] Mohan V, Deepa R, Deepa M, Somannavar S, Datta M (2005) A simplified Indian Diabetes Risk Score for screening for undiagnosed diabetic subjects. J Assoc Physicians India 53: 759-763.
[9] Ramachandran A, Snehalatha C, Vijay V, Wareham NJ, Colagiuri S (2005) Derivation and validation of diabetes risk score for urban Asian Indians. Diabetes Res Clin Pract 70(1): 63-70.
[10] Al-Lawati JA, Tuomilehto J (2007) Diabetes risk score in Oman: a tool to identify prevalent type 2 diabetes among Arabs of the Middle East. Diabetes Res Clin Pract 77(3): 438-444.
[11] Cabrera de Leon A, Coello SD, Rodriguez Perez Mdel C, Medina MB, Almeida Gonzalez D, et al (2008) A simple clinical score for type 2 diabetes mellitus screening in the Canary Islands. Diabetes Res Clin Pract 80(1): 128-133. [12] Griffin SJ, Little PS, Hales CN, Kinmonth AL, Wareham NJ (2000). Diabetes
risk score: towards earlier detection of type 2 diabetes in general practice. Diabetes Metab Res Rev 16(3): 164-171.
[13] Bindraban NR, van Valkengoed IG, Mairuhu G, Holleman F, Hoekstra JB, et al (2008) Prevalence of diabetes mellitus and the performance of a risk score among Hindustani Surinamese, African Surinamese and ethnic Dutch: a cross-sectional population-based study. BMC Public Health 8: 271.
[14] Baan CA, Ruige JB, Stolk RP, Witteman JC, Dekker JM, et al (1999)
Performance of a predictive model to identify undiagnosed diabetes in a health care setting. Diabetes Care 22(2): 213-219.
[15] Stern MP, Williams K, Haffner SM (2002) Identification of persons at high risk for type 2 diabetes mellitus: do we need the oral glucose tolerance test? Ann Intern Med 136(8): 575-581.
[16] Lindstrom J, Tuomilehto J (2003) The diabetes risk score: a practical tool to predict type 2 diabetes risk. Diabetes Care 26(3): 725-731.
[17] Schmidt MI, Duncan BB, Bang H, Pankow JS, Ballantyne CM, et al (2005) Identifying individuals at high risk for diabetes: The Atherosclerosis Risk in Communities study. Diabetes Care 28(8): 2013-2018.
[18] Aekplakorn W, Bunnag P, Woodward M, Sritara P, Cheepudomwit S, et al (2006) A risk score for predicting incident diabetes in the Thai population. Diabetes Care, 29(8): 1872-1877.
[19] Schulze MB, Hoffmann K, Boeing H, Linseisen J, Rohrmann S, et al (2007) An accurate risk score based on anthropometric, dietary, and lifestyle factors to predict the development of type 2 diabetes. Diabetes Care 30(3): 510-515. [20] Wilson PW, Meigs JB, Sullivan L, Fox CS, Nathan DM, et al (2007) Prediction
of incident diabetes mellitus in middle-aged adults: the Framingham Offspring Study. Arch Intern Med 167(10): 1068-1074.
[21] Bindraban N R, van Valkengoed IG, Mairuhu G., Holleman F, Hoekstra J B, et al (2008) Prevalence of diabetes mellitus and the performance of a risk score among Hindustani Surinamese, African Surinamese and ethnic Dutch: a cross-sectional population-based study. BMC Public Health 8: 271.
[22] Balkau B, Lange C, Fezeu L, Tichet J, de Lauzon-Guillain B, et al (2008) Predicting diabetes: clinical, biological, and genetic approaches: data from the Epidemiological Study on the Insulin Resistance Syndrome (DESIR). Diabetes Care 31(10): 2056-2061.
[23] Glumer C, Carstensen B, Sandbaek A, Lauritzen T, Jorgensen T, et al (2004) A Danish diabetes risk score for targeted screening: the Inter99 study. Diabetes Care 27(3): 727-733.
Care 27 (Suppl. 1): S11-S14.
[25] Lin CC, Liu CS, Lai MM, Li CI, Chen CC, et al (2007) Metabolic Syndrome and Its Associated Risk Factors in a Taiwanese Metropolitan Adult Population. BMC Public Health 7(1): 739-743.
[26] Mamdani M, Sykora K, Li P, Normand SLT, Streiner DL, et al (2005) Reader’s guide to critical appraisal of cohort studies, 2: Assessing potential for confounding. BMJ. 330(7497): 960-962.
[27] Hosmer DW, Lemeshow S. (1989) Applied logistic regression. John Wiley & Sons.
[28] DeLong ER, DeLong DM, Clarke-Pearson DL (1988) Comparing the areas under two or more correlated receiver operating characteristic curves: a nonparametric approach. Biometrics 44: 837-845.
[29] Pencina MJ, D’Agostino RB Sr, D’Agostino RB Jr, Vasan RS (2008) Evaluating the added predictive ability of a new marker: from area under the ROC curve to reclassification and beyond. Stat Med 27:157–172.
Figure Legends
Figure 1A—Comparing the AUCs of model 1, model 2, and model 3 in men Figure1B—Comparing the AUCs of model 1, model 2, and model 3 in Women
Table 1.Baseline characteristics in individuals who were followed up and those who were not according to gender. Men (n=1116) Women (n=1195) Not followed n=286 mean (SD) Followed n=830 mean (SD) standardized mean differences Not followed n=394 mean (SD) Followed n=801 mean (SD) standardized mean differences Age (year) 59.29(13.26) 57.78(11.66) 0.007 55.96(11.63) 54.45(9.51) -0.012 Weight (kg) 67.62(10.51) 69.29(10.18) -0.009 58.60(8.97) 57.25(8.36) -0.009 Height (cm) 166.13(6.13) 166.63(6.15) -0.005 154.90(5.39) 155.62(5.29) -0.002 FAT (%) 25.86(5.84) 26.01(5.58) -0.002 37.02(6.19) 35.83(5.88) -0.010 SYS (mmHg) 141.04(21.10) 137.83(20.09) 0.009 136.29(24.63) 130.37(21.15) -0.011 DIA (mmHg) 83.37(12.33) 82.22(11.03) 0.006 77.22(12.85) 74.51(11.93) -0.010 Waist (cm) 85.87(9.01) 86.47(8.65) -0.004 78.14(9.50) 75.97(8.39) -0.007 GOT (IU/L) 28.78(26.04) 27.47(11.88) 0.003 25.93(15.67) 25.64(14.84) -0.036 GPT (IU/L) 30.95(48.61) 29.91(19.26) 0.001 25.56(30.62) 24.62(22.06) -0.071 CHOL (mg/dl) 197.88(39.06) 201.67(35.99) -0.006 205.94(40.27) 206.11(37.48) -0.012 TG (mg/dl) 128.63(97.06) 140.16(117.34) -0.007 112.92(76.73) 104.37(66.66) -0.040 FPG (mg/dl) 110.46(41.05) 104.83(24.74) 0.008 104.91(35.60) 98.96(21.65) -0.020 WBC (103/μl) 6.53(1.88) 7.55(38.75) -0.022 5.80(1.64) 5.59(1.47) -0.017 RBC (106/μl) 4.94(0.57) 5.00(0.54) -0.006 4.51(0.45) 4.54(0.46) -0.006 HGB (g/dl) 14.82(1.32) 15.05(1.18) -0.010 13.25(1.25) 13.21(1.22) -0.006 HCT (%) 44.27(3.70) 44.86(3.29) -0.009 40.27(3.27) 40.20(3.21) -0.005 PLT (103/μl) 227.90(59.52) 224.29(57.10) 0.004 244.73(63.17) 247.67(57.99) -0.015 URIC (mg/dl) 6.37(1.42) 6.30(1.39) 0.003 5.24(1.22) 4.94(1.06) -0.014 HDL (mg/dl) 41.50(10.84) 41.28(10.61) 0.001 49.04(12.36) 50.80(12.78) -0.015 LDL (mg/dl) 126.56(37.00) 128.22(32.77) -0.003 128.39(34.37) 127.13(33.49) -0.016 BUN (mg/dl) 14.50(6.29) 13.87(4.28) 0.006 12.84(4.82) 11.97(3.91) -0.022 MA (mg/g cr) 39.58(209.28) 25.20(100.26) 0.004 28.90(77.33) 20.22(90.65) -0.158 Creatine (mg/dl) 1.11(0.63) 1.05(0.25) 0.006 0.81(0.46) 0.73(0.17) -0.033 SD: standard deviation.
Table 2.The ability of ADART plus lifestyle behaviors and biomarkers at baseline for predicting 3-year incidence of pre-diabetes and diabetes OR
Men (n=456) Women (n=565)
model 1 model 2 model 3 model 1 model 2 model 3
ADART
age≥45 1.53(0.79, 2.96) 1.57(0.81, 3.04) 1.55(0.79, 3.02) 1.48(0.69, 3.15) 1.17(0.54, 2.52) 1.15(0.53, 2.49) BMI≥25 1.03(0.63, 1.68) 1.06(0.65, 1.73) 1.02(0.62, 1.67) 2.59(1.52, 4.43)*** 2.16(1.25, 3.75)** 2.08(1.19, 3.92)** family history of diabetes 1.10(0.63, 1.93) 1.00(0.56, 1.77) 0.98(0.55, 1.75) 1.49(0.86, 2.59) 1.60(0.90, 2.82) 1.63(0.92, 2.89) low physical activity level 1.05(0.64, 1.72) 1.06(0.65, 1.74) 1.04(0.63, 1.71) 0.79(0.45, 1.38) 0.74(0.41, 1.30) 0.74(0.41, 1.31) previously identified IFG or IGT 1.93(0.33, 11.21) 2.02(0.34, 11.86) 2.05(0.35, 12.18) 2.68(0.18, 40.26) 3.50(0.24, 50.26) 3.06(0.22, 42.77) high blood pressure 1.37(0.83, 2.27) 1.28(0.77, 2.14) 1.24(0.74, 2.08) 1.17(0.64, 2.11) 1.18(0.65, 2.14) 0.97(0.50, 1.88) HDL cholesterol≤35 or TG≥250 (mg/dl) 0.74(0.45, 1.24) 0.74(0.44, 1.25) 0.62(0.36, 1.07) 4.27(2.09, 8.75)*** 4.35(2.10, 9.01)*** 4.46(2.14, 9.32)*** history of cardiovascular disease 2.71(1.36, 5.37)** 2.72(1.37, 5.41)** 2.96(1.47, 5.97)** 0.81(0.28, 2.32) 0.78(0.27, 2.30) 0.79(0.27, 2.35) history of GDM or delivery of a baby -# -# -# 1.98*(1.04, 3.78) 2.04(1.06, 3.93)* 2.05*(1.06, 3.95) weighing>4000g
with polycystic ovary syndrome -# -# -# 1.36(0.50, 3.72) 1.54(0.56, 4.23) 1.64(0.59, 4.52)
family history of hyperlipidemia - 1.87(0.96, 3.65) 1.74(0.89, 3.42) - - -
education attainment≤9 years - - - - 1.90*(1.11, 3.25) 1.83*(1.07, 3.14)
TV watching time≥25 hrs/week - - - - 1.95*(1.13, 3.37) 1.92*(1.11, 3.33)
baseline triglyceride>150 (mg/dl) - - 1.96*(1.17, 3.28) - - -
baseline diastolic blood pressure≥85 mmHg - - - 1.65(0.83, 3.27)
*:p<0.05; **:p<0.01; ***:p<0.001. -#: OR were not available because the items of ADART were only for women; -: OR were not available because the variables did not reach the level of significance set for entering into models. ADART: American Diabetes Association Risk Tool
Table 3.The predictive performance of American Diabetes Association Risk Tool
Model AUC (95% CI) p value sensitivity specificity LR+ LR- Youden index predicted probability# NRI p value for NRI IDI p value for IDI Male model 1 0.60 (0.54-0.66) - 0.77 0.35 1.19 0.65 0.12 0.2804 - - - - model 2 0.62 (0.56-0.68) 0.3171 0.78 0.34 1.19 0.64 0.12 0.3829 0.015 0.9538 0.007 0.1414 model 3 0.64 (0.58-0.71) 0.1055 0.71 0.45 1.28 0.65 0.16 0.2384 0.096 0.7862 0.008 0.0041 Female model 1 0.72 (0.65-0.77) - 0.76 0.54 1.64 0.44 0.30 0.1181 - - - - model 2 0.74 (0.68-0.80) 0.2126 0.75 0.60 1.86 0.42 0.35 0.2370 0.003 0.1037 0.030 0.0044 model 3 0.75 (0.69-0.80) 0.0862 0.74 0.62 1.94 0.42 0.36 0.1626 0.050 0.9055 0.034 0.0028 model 1: ADART, model 2: ADART+lifestyle behaviors at baseline, model 3: ADART+lifestyle behaviors+biomarkers;LR+=positive likelihood ratio test; LR-=negative likelihood ratio test; Youden index was defined as the maximum of (sensitivity+specificity-1); #: predicted probability for the optimal cutoff points; NRI: net reclassification improvement; IDI: integrated discrimination improvement.
Table 4. ADART and instruments published in literature in screening undiagnosed pre-diabetes and diabetes
Tools AUC (95%CI) sensitivity specificity LR+ LR- Youden index Men ADA24 0.60(0.54-0.66) 0.24 0.90 2.47 0.84 0.14 Baan14 PM1 0.57(0.51-0.63) 0.77 0.35 1.18 0.66 0.12 PM2 0.54(0.48-0.60) 0.90 0.18 1.10 0.54 0.08 Griffina, 12 0.54(0.47-0.60) 0.69 0.38 1.11 0.82 0.07 Sternb, 15 0.60(0.54-0.66) 0.72 0.45 1.30 0.63 0.17 Lindström16 0.55(0.48-0.61) 0.86 0.23 1.12 0.61 0.09 Glümer23 0.56(0.50-0.62) 0.55 0.58 1.30 0.78 0.13 Mohan8 0.53(0.47-0.59) 0.96 0.10 1.07 0.39 0.06 Ramachandran9 0.51(0.44-0.57)* 0.27 0.79 1.28 0.92 0.06 Schmidtb, 17 0.64(0.58-0.70) 0.56 0.67 1.71 0.65 0.23 Aekplakorn18 0.50(0.44-0.57)* 0.27 0.77 1.19 0.94 0.04 Lawati10 0.52(0.46-0.58)* 0.18 0.87 1.35 0.95 0.05 Schulzec, 19 0.55(0.49-0.61) 0.73 0.40 1.22 0.67 0.13 León11 0.57(0.51-0.63) 0.74 0.44 1.32 0.59 0.18 Wilson20 0.54(0.48-0.60) 0.71 0.38 1.14 0.77 0.09 Balkau22 0.50(0.44-0.56)* 0.82 0.21 1.03 0.87 0.03 Bindraban21 0.53(0.47-0.59)* 0.71 0.35 1.09 0.84 0.06 Cox13 0.52(0.46-0.59) 0.09 0.95 1.83 0.96 0.04 Women ADA24 0.72(0.65-0.77) 0.74 0.58 1.76 0.45 0.32 Baan14 PM1 0.58(0.52-0.64)* 0.35 0.76 1.47 0.86 0.11 PM2 0.69(0.64-0.75) 0.80 0.52 1.65 0.39 0.31 Griffina, 12 0.66(0.60-0.72) 0.74 0.52 1.55 0.50 0.26 Sternb, 15 0.73(0.67-0.79) 0.71 0.65 2.02 0.44 0.36 Lindström16 0.62(0.55-0.69)* 0.30 0.87 2.28 0.81 0.17 Glumer23 0.62(0.56-0.69)* 0.54 0.67 1.60 0.70 0.20 Mohan8 0.53(0.46-0.60)* 0.14 0.91 1.55 0.94 0.05 Ramachandran9 0.64(0.58-0.71)* 0.63 0.58 1.52 0.63 0.21 Schmidtb, 17 0.73(0.67-0.79) 0.83 0.55 1.84 0.30 0.38 Aekplakorn18 0.68(0.62-0.74) 0.54 0.70 1.76 0.67 0.23 Lawati10 0.63(0.57-0.69)* 0.85 0.39 1.40 0.39 0.24 Schulzec, 19 0.65(0.59-0.71)* 0.73 0.54 1.58 0.51 0.27 León11 0.65(0.59-0.71) 0.85 0.39 1.39 0.40 0.24 Wilson20 0.63(0.56-0.70)* 0.54 0.66 1.57 0.70 0.20 Balkau22 0.65(0.59-0.71)* 0.67 0.57 1.55 0.59 0.24 Bindraban21 0.65(0.59-0.71)* 0.48 0.74 1.83 0.71 0.22 Cox13 0.67(0.61-0.73) 0.90 0.35 1.39 0.27 0.25
a: The current study did not consider the item “prescribed steroid” that was in the original screening
tool;b: The current study did not consider the item “ethnic” that was in the original screening tool;c: The current study did not consider the items “ intake of red meat” and “ intake of whole-grain” that were in the original screening tool;*: p<0.05 for comparing the AUC of the specific screening tool with that of ADA