Distribution characteristics of methamphetamine and amphetamine
in urine and hair specimens collected from alleged methamphetamine
users in northern Taiwan
Sheng-Meng Wang
a,∗, Chih-Che Lin
a, Tien-Lai Li
a, Chun-Yao Shih
a,
Yun-Seng Giang
a, Ray H. Liu
baDepartment of Forensic Science, Central Police University, 56 Shujen Road, Kueishan, Taoyuan 33304, Taiwan bDepartment of Medical Technology, Fooyin University, Kaohsiung Hsien 831, Taiwan
Received 20 November 2005; received in revised form 4 January 2006; accepted 6 January 2006 Available online 27 April 2006
Abstract
This study was conducted to better understand the distribution characteristics of methamphetamine and amphetamine in urine and hair specimens collected from alleged methamphetamine users in the local population. It is anticipated that the data hereby obtained will be helpful to the interpretation of the time and pattern of drug use. Eight alleged methamphetamine-using arrestees from Keelung Police Department (north of Taipei, Taiwan) consented to contribute both urine and hair specimens. Each arrestee contributed seven urine specimens collected at 0, 12, 24, 48, 72, 96, and 120 h, respectively, after the arrest. Hair specimens were cut into 2-cm sections. The limits of detection and quantitation of the urine protocol were 40 and 50 ng/mL, respectively, for both amphetamine and methamphetamine, while the corresponding limits of detection and quantitation for the hair protocol were 0.8 and 1.0 ng/mg, respectively. The concentration variations of methamphetamine and amphetamine in the urine specimens exhibited three distinct patterns: (a) continuous decrease in the analytes’ concentrations for specimens collected at hours 0–120; (b) increase in the analytes’ concentrations in specimens collected at hours 0–12, followed by decrease; (c) increase in analytes’ concentrations in specimens collected at later times. Together with the amphetamine/methamphetamine concentration ratios found in these urine specimens, the observed trends in the changes of the analytes’ concentrations are helpful for the interpretation on the time of drug use. Unlike urine specimens, amphetamine/methamphetamine concentration ratios in various hair specimens and hair sections remain relatively constant.
© 2006 Elsevier B.V. All rights reserved.
Keywords:Gas chromatography–mass spectrometry (GC–MS); Amphetamine; Methamphetamine; Drug testing; Hair drug analysis; Drug distribution
1. Introduction
Most defendants accused of administrating drugs of abuse tend to deny the accusation in court. In Taiwan, for example, some of the alleged drug abusers would claim that they had just been first offenders, for according to the law first offend-ers are simply considered as patients to be remedied, whereas serial ones are to be penalized. The judge, in an effort to weigh the penalty properly, has to infer backward the kinds, amounts, times, frequency, and pattern of drug use based upon a urine test, preferably guided by such information as average drug metabolic rates and/or clearance periods. However, most of these
∗Corresponding author. Tel.: +886 3 3282321x4293; fax: +886 3 3286138.
E-mail address:wang531088@mail.cpu.edu.tw (S.-M. Wang).
data have been previously established for limited populations, mostly Westerners[1–5], and may not be exactly applicable to Oriental individuals, as there are a number of factors that may affect the drug absorption, distribution, metabolism, elimina-tion, and hence the interpretation of drug test results[6–20]. As a matter of fact, data with these regards for native Taiwanese have thus far been lacking due to numerous restrictions on the perfor-mance of human in vivo experiments. On the other hand, hair analysis for drugs of abuse has long been recognized as a use-ful tool for detecting and monitoring drug ingestion over a long period, and may serve as a complement of urine testing[21–28]. What is more complicated is that, in addition to the foregoing factors, hair pigments and proteins may also have to do with the appreciable differences between Westerners and Orientals in hair drug distributions[29–38]. The black eumelanins asso-ciated with Orientals are likely to exert stronger binding force 0003-2670/$ – see front matter © 2006 Elsevier B.V. All rights reserved.
to the drug than do the reddish-brown pheomelanins associated with Westerners, and lead to more positive tests.
Ever since the 1960s methamphetamine (MA) has been among the most prevalent drugs of abuse in Taiwan. And for years our laboratory has been engaged in the isotope dilution gas chromatographic–mass spectrometric (GC–MS) analysis of drugs of abuse, particularly amphetamines, in various matrices
[39–45]. To better understand the distribution characteristics of MA and its major metabolite, amphetamine (AP), in Taiwanese people’s urine and hair, we feel it necessary to conduct a valida-tion study. It is anticipated that the data hereby obtained will be helpful to the interpretation of the time and pattern of the drug use.
2. Experimental
2.1. Materials
Stock solutions of racemic d,l-MA [1 mg (i.e., 0.5 mg d-MA + 0.5 mg l-d-MA)/mL in methanol), d,l-AP (1 mg/mL in methanol), d,l-MA-d8(0.1 mg/mL in methanol), and d,l-AP-d8 (0.1 mg/mL in methanol) were purchased from Cerilliant Co., USA.
The derivatizing agent used in this study, pentafluoropropi-onic anhydride (PFPA), was ordered from Aldrich Chemical Co., USA. Ethyl acetate (EA), anhydrous sodium hydroxide, con-centrated hydrochloric acid, and methanol were obtained from Fisher Scientific, USA. All of the above agents and solvents were in analytical or reagent grade and were directly used with-out further purification.
2.2. Sample collection
Eight alleged methamphetamine-using arrestees from Keelung Police Department (north of Taipei, Taiwan) consented to contribute both of their urine and hair specimens. The back-grounds of the testees and the historical information about their drug use are summarized inTable 1. Each arrestee contributed seven urine specimens as a set collected at 0, 12, 24, 48, 72, 96, and 120 h, respectively, after the arrest. All urine specimens were preserved at −20◦C prior to analysis.
Head hair specimens were cut in small handfuls (totaling ca. 100 hairs per arrestee) near the scalp on the back of the head, held straight, pasted onto separate sheets of adhesive paper, and sealed in their respective pre-labeled envelopes.
2.3. Sample preparation
2.3.1. Extraction and chemical derivatization (ChD) of urine specimens
Urine specimens were subjected to liquid–liquid extraction (LLE) followed by ChD with PFPA. The detailed procedure has previously been described[44].
2.3.2. Cleaning, LLE (with digestion), and ChD of hair specimens
Hair specimens were cut into 2-cm sections. Each sec-tion was washed separately under ultrasonicasec-tion with 3-mL dichloromethane for 1 min followed by twice 1 min of 3-mL methanol. The methanol was decanted, and the hair dried under a stream of nitrogen gas. A 50-mg portion of the washed hair section to be analyzed was cut into 1–2 mm segments, and put into a screw-cap topped test tube. For a calibration standard, an appropriate amount each of the analytes (see Section2.4) and 250 ng each of the internal standards (ISs) were added to the hair; for an unknown hair section, simply 250 ng each of the ISs was added. The mixture was digested in 2 mL of 2N NaOH at 90◦C for 20 min, and then cooled to ambient temperature. A 4-mL aliquot of ethyl acetate was added, and the mixture was vortex-mixed for 5 min, followed by 5 min of centrifugation. The upper layer was transferred into another clean test tube and dried under a stream of nitrogen at 45◦C. For ChD, 50 !L of PFPA and 50 !L of ethyl acetate were added to the extract residue, and the tube was capped and the mixture incubated at 90◦C for 20 min, cooled to ambient temperature, and then purged at 45◦C with nitrogen gas to dryness. Bring the volume to 200 !L with ethyl acetate. A 1-!L aliquot of the reconstituted solution was injected for the GC–MS analysis.
2.4. GC–MS analysis and protocol calibration
The GC–MS instrumentation and related experimental con-ditions employed in this study have previously been described Table 1
The backgrounds of the eight alleged MA users to be tested and the historical information about their drug use Testee Gender Age Dyed hair? Accustomed means of
drug administration
Dosage and/or frequency
of drug usea Last drug use prior to this arrest
a Date of this
arrestb Drug(s) seizedwith this arrest
1 M 30 Yes Oral NAc 3/7/2004, MA 3/8/2004 MA
2 M 48 Yes Nasal NAc 12/1/2002, MA (0.1 g), nasal 3/23/2004 Nil
3 M 32 No Nasal NAc 3/24/2004, MA (0.2 g), nasal 3/24/2004 Nil
4 M 36 No Nasal NAc 4/7/2004, MA (0.2 g), nasal 4/9/2004 Nil
5 M 33 No Nasal Once every two weeks 3/31/2004, MA (0.1 g), nasal 4/21/2004 MA
6 M 39 No Nasal NAc 4/23/2004, MA, nasal 4/28/2004 MA
7 M 29 No Oral, nasal, injection Twice daily 5/7/2004, heroin, MA, oral, nasal 5/7/2004 Heroin, MA 8 M 41 No Nasal Small amount, once daily 3/1/2004, MA (small amount), nasal 3/2/2004 MA
aAccording to testee’s deposition.
b Also date of sample collection for hair and 0-h urine. cNA: information unavailable.
[44]. The assay calibrations were conducted using a five-point protocol. For plotting the urine method calibration curve, the MA/AP binary standard solutions were prepared by adding an appropriate amount (50, 100, 250, 500, and 1000 ng) each of the analytes and 250 ng each of the ISs to 1 mL of blank urine that had previously been certified negative for all drugs. For plot-ting the hair method calibration curve, the same amounts of the analytes and ISs were added to 50 mg of NaOH-digested blank hair.
3. Results and discussion
3.1. Mass chromatography
The determination of MA and AP in urine and hair spec-imens using LLE and PFPA–ChD followed by isotope dilu-tion GC–MS operated in electron impact/selected ion moni-toring mode (GC–EIMS SIM) has previously been reported
[22–25,44,45]. While stereochemically nonselective, this ana-lytical scheme is well suited for the evidential determination of sum d,l-MA and sum d,l-AP, and its QC/QA can meet the requirements of the US workplace urine drug testing program. To help validate the protocol in analyzing the present real-case urine and hair specimens as well as interpreting the results, how-ever, it would be informative to summarize some newly acquired basic and key features of the method performance.
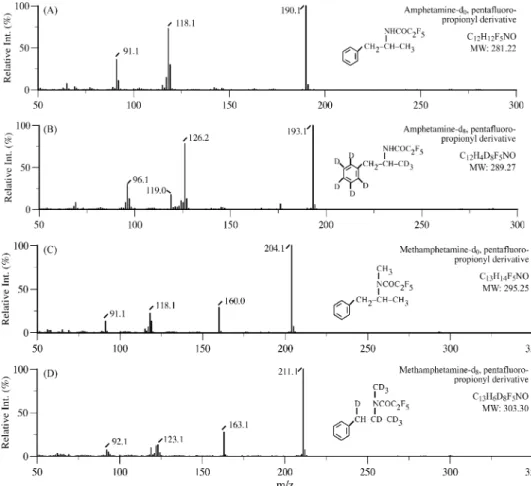
Fig. 1. The isotope dilution GC–EIMS SIM chromatogram obtained for a real-case urinary specimen containing racemic d,l-MA and racemic d,l-AP after the LLE/PFPA–ChD pre-treatment. The relevant retention times are listed in Table 2.
The qualitative aspects of the corresponding GC–EIMS SIM chromatograms and mass spectra obtained for urine and hair spikes as well as real-case specimens containing AP, MA,
AP-d8, and MA-d8 after the LLE and PFPA–ChD processes are essentially the same. Shown in Figs. 1 and 2 are one of the chromatograms and its relevant mass spectra obtained for a
Table 2
The retention times and qualifier/quantifier ions of the PFPA derivatized amphetamines inFig. 1
PFPA derivatized analyte or IS
Retention times (min)
Qualifier ions (m/z) Quantifier ions (m/z)
PFP–AP-d8 5.148 193, 126, 96 193
PFP–AP 5.170 190, 118, 91 190
PFP–MA-d8 5.775 211, 163, 122 211
PFP–MA 5.801 204, 160, 118 204
case urinary specimen. Also, the retention times recorded and the qualifier/quantifier ions selected for the four PFP–amphetamines are listed inTable 2. These data are in agreement with those previously reported.
3.2. Quantitation
The relevant five-point calibration equations, linearity ranges, linear correlation coefficients (r2), method limits of detection and quantitation (LODs/LOQs; previously defined[44,46]), and method recoveries for the determination of MA and AP in urine and hair by the protocol of choice are summarized inTable 3. All of these data are in agreement with or close to those previously reported[29,36,44,45,47,48]. As the accuracies and precisions for the measurements of drug levels are highly crucial to the following legal interpretation of the results, every quantifier-ion-abundance ratio used for plotting the calibration curves was the mean of triplicate analyses.
It is worthwhile to compare the LOQs achieved hereby with the currently US Federal MA cutoff concentrations for urine and hair specimens [49]. For urine, our LOQs (50 ng/mL for both MA and AP) sufficiently meet both the adopted (simulta-neous finding of MA! 500 ng/mL and AP ! 200 ng/mL) and the proposed (simultaneous finding of MA! 250 ng/mL and AP! 100 ng/mL) criteria. For hair, currently only a proposed cutoff is available in the States; that is, simultaneous find-ing of MA! 300 pg/mg and AP ! 50 pg/mg. Unfortunately, our LOQs at present (1.0 ng/mg for both MA and AP) are somewhat inferior to those proposed figures. We should tentatively
con-sider the 1.0-ng/mg LOQs as the cutoffs for the discussion that follows.
3.3. Real-case comparative study 3.3.1. About AP/MA amount ratio
To ensure the accuracies and precisions of the real-case anal-yses, some of the test urine and hair specimens, especially those showing abnormal increase in drug level, were subjected to trip-licate analyses. Some specimens were analyzed in duptrip-licate so long as the two firstly obtained data were close enough. Single analysis was adopted for those obviously negative specimens. As shown on the left of Table 4, the eight sets of urine spec-imens collected at hours 0–120 after the arrest gave AP assay outcomes ranging from 64 to 4153 ng/mL, which were mostly lower than those of the MA assays that ranged from 52 to 42,887 ng/mL. This correlates well with the AP/MA amount ratios that have a spread of 0.07–2.78 with 85% of the quantifi-able specimens (i.e., those analyzing higher than the method LOQ, 50 ng/mL for both AP and MA) giving ratios smaller than 1.00. In contrast, the eight sets of sectional hair speci-mens resulted in 1.59–14.2 ng/mg of AP and 6.11–168 ng/mg of MA (Table 4, right), with the method LOQs (1.0 ng/mg both) being our tentative cutoffs. It should be noted that all the hair sections have AP/MA ratios spanning between 0.01 and 0.22, with 95% of the quantifiable specimens giving ratios smaller than 0.20. This is different (in ratio value) from yet correlates well (in metabolic trend or pattern) with the urine counterpart, and further verifies that in hair AP is also the major metabo-lite of MA, but is distributed in a lower level than in urine. The difference in the AP/MA ratio between the two types of specimens is mainly attributed to the matrix effects on the adher-ence and/or metabolism of the drug. Generally speaking, the above statements concerning the AP/MA amount ratios for both urine and Oriental hair specimens are in agreement with those reported in the literature [5,8,49–51] except for a significant difference from those reported by Kronstand et al. for Western hair, where the hair AP/MA ratios are all higher than 0.25[30]. However, Kronstand’s study was conducted using selegiline, an APs-generating drug (i.e., a precursor drug to APs), rather
Table 3
Calibration equations, linearity ranges, linear correlation coefficients (r2), method limits of detection and quantitation (LODs/LOQs), and recoveries of analytes for the determination of MA and AP in urine and hair by LLE and PFPA–ChD followed by GC–EIMS SIM
Analyte Calibration equation Linearity range (ng/mL for urine; ng/mg for hair)
Linear correlation coefficient (r2)
LOD (ng/mL for urine; ng/mg for hair)
LOQ (ng/mL for urine; ng/mg for hair)
Recovery of analyte (%) (a) Instrumental calibrations (off-line extraction not covered and quantitative ChD presumed)
MA y= 0.0033x + 0.0137 50–1000 ng of MA 0.9998 AP y= 0.0041x − 0.025 50–1000 ng of AP 0.9999 (b) Method calibrations for urine specimens
MA y= 0.0028x + 0.1252 50–1000 0.9991 40 50 75
AP y= 0.0038x − 0.0455 50–1000 0.9997 40 50 75
(c) Method calibrations for hair specimens
MA y= 0.0033x + 0.0168 1–20 0.9993 0.8 1.0 90
Table 4
Distribution of AP and MA in urine and hair specimens collected from eight alleged MA-using arrestees
Testee Urine specimens Hair specimens
Collection time (hours after arrest)
AP (ng/mL) MA (ng/mL) AP/MA Length from the scalp (cm) AP (ng/mg) MA (ng/mg) AP/MA 1 0 662 5156 0.13 0–2 6.79 55.5 0.12 12 3914a 12908a 0.30 2–4 5.89 49.9 12 24 1240 2558 0.49 4–6 6.18 53.1 0.12 48 832 1024 0.81 6–8 3.88 55.7 0.07 72 169b 162b 1.04 8–10 NAc NAc NAc 96 NDd 54b <0.74 120 NDd NDd NAc 2 0 1048 9999 0.10 0–2 8.08 87.2 0.09 12 376 2349 0.24 2–4 7.97 77.5 0.10 24 554 862 0.44 4–6 NAc NAc NAc 48 104b 302b 0.34 72 69b 73b 0.95 96 NDd NDd NAc 3 0 205 2363 0.09 0–2 14.2 168 0.08 12 945 970 0.98 2–4 9.58 135 0.07 24 903 1539a 0.59 4–6 NDd 104 <0.01 48 693 558 1.24 6–8 8.26 115 0.07 72 225 81b 2.78 8–10 NAc NAc NAc 96 150b 82b 1.83 120 160b 69b 2.32 4 0 44b,e 57b 0.77 0–2 1.59 7.15 0.22 12 64b 182b 0.35 2–4 NDd 6.11 <0.13 24 42b,e 121b 0.35 4–6 NDd 9.08 <0.09 48 43b,e 88b 0.49 6–8 NDd 10.2 <0.08 72 NDd 66b <0.61 8–10 NAc NAc NAc 96 70b 52b 1.35 120 NDd 41b,e <1.00 5 0 291 1683 0.17 0–2 1.89 17.1 0.11 12 232 835 0.28 2–4 NDd 29.4 <0.03 24 142a 304a 0.45 4–6 NDd 27.0 <0.03 48 NDd 46 <0.87 6–8 NDd 22.6 <0.04 72 NDd NDd NAc 8–10 NAc NAc NAc 6 0 NDd NDd NAc 0–2 7.76 47.55 0.16 12 NDd NDd NAc 2–4 4.14 48.40 0.09 24 NDd NDd NAc 4–6 3.06 61.18 0.05 48 NDd NDd NAc 6–8 2.76 90.38 0.03 72 NDd NDd NAc 8–10 3.09 99.36 0.03 7 0 1973 3891 0.51 0–2 6.11 52.6 0.12 12 1788 3685 0.49 2–4 NAc NAc NAc 24 840 1057 0.79 48 455 901 0.50 72 287 287a 1.00 96 NDd 69 <0.58 120 NDd NDd NAc 8 0 2079 21176 0.10 0–2 3.90 71.4 0.05 12 2780 17126 0.16 2–4 NAc NAc NAc 24 1011 7132 0.14 48 866 4137 0.21 72 169 2438 0.07 96 2438a 30931a 0.08 120 4153a 42887a 0.10 aAbnormal increase. bBelow cutoff.
cNA: not applicable or specimen not available. dND: not detected.
than MA itself, and is not exactly comparable with the present study.
3.3.2. Interpretation of changes of MA and AP levels
At both hours 0 and 12, six (nos. 1–3, 5, 7, and 8) out of eight urine specimens tested ‘truly positive’ for the official MA test; i.e., analyzed above the international MA cutoff (500 ng/mL) and AP cutoff (200 ng/mL) simultaneously. At hour 24, five speci-mens (nos. 1–3, 7, and 8) remained ‘truly positive’; at hour 48, four specimens (nos. 1, 3, 7, and 8) remained ‘truly positive’. However, at hour 72 none remained ‘truly positive’, except that specimen no. 8 indicated at hour 96 an abnormal increase in both MA and AP. This was attributed to a new administration of MA on the fourth day since the first sampling as was confessed by the testee. Another peculiar rise in the urine drug level happened to testee no. 1 at as soon as hour 12. This was because, according to his confession, the testee had just administered MA immedi-ately prior to the arrest and at hour 0 the climax of metabolism had not been reached.
It may sound daring to compare the data obtained via such two diverse detection windows as urine (for detecting recent consumption of MA) and hair (for long-term consumption). However, for testees 1–3, 5, 7, and 8, it turned out that, with only few exceptions, those who had relatively higher levels of MA in the hair sections also showed relatively higher MA in the urine. Furthermore, the higher the urine MA, the longer it would remain above the cutoff; but even the highest (specimen no. 8) would not test ‘truly positive’ after hour 72. In contrast, testee no. 4 who had the lowest hair MA and AP also had the lowest urine MA and AP, which led to all straight-negative urine tests. It is noteworthy that urine specimens 4 and 6 all showed only low or even undetectable MA or AP throughout the five days of sample collection, whereas their hair specimens con-tained detectable and nearly constant amounts of the MA in every section provided although specimen 4 analyzed lower or undetectable AP in some of the outer sections. According to the later statement from testee no. 6 whose hair sections contained consistently high level of both MA and AP but urine specimens were totally negative, he had by chance stopped using the drug for a while before receiving the notice of urine collection. Thus, given more subjects, it might be expected that for Taiwanese people an MA test would turn negative no later than three days after a single dose.
Although only hair specimen no. 6 was long enough to allow for all the five planned sectional analyses (i.e., 0–2, 2–4, 4–6, 6–8, and 8–10 cm), the overall results of the sectional hair analysis were informative. Specifically, all the 0–2 cm sections provided by the eight alleged arrestees turned out to contain quantifiable amounts of MA and AP; except for specimens 4 and 5 which analyzed no AP, all the other available two to four sections (specimens 1–3 and 6) contained quantifiable amounts of both MA and AP; except for specimens 3–5 which analyzed no AP, all the other available four to six sections (specimens 1 and 6) contained quantifiable amounts of both MA and AP; except for specimens 4 and 5 which analyzed no AP, all the other available six to eight sections (specimens 1, 3, and 6) contained quantifiable amounts of both MA and AP; as for specimen 6,
all the five available sections contained high levels of both MA and AP. Let hair growth rate be about 1 cm per month, then tes-tees 1, 3–6 should have successively used some nearly constant amounts of MA for at least half a year.
4. Conclusions
In spite of the facts that the eight alleged MA users came from various backgrounds and that the actual times and dosages of drug use were hard to know (as a matter of fact, more closely monitored and controlled human in vivo experiments are almost infeasible in Taiwan), the results presented in this report once again demonstrated that LLE and PFPA–ChD followed by iso-tope dilution GC–EIMS SIM is a useful and reliable protocol for the determination of MA in urine and hair, and the short-term profiling of urinary drug levels assisted by the chronological information from sectional hair analysis is most helpful for the interpretation of the time and pattern of drug use.
The concentration variations of MA and AP in the urine spec-imens exhibited three distinct patterns: (a) continuous decrease in the analytes’ concentrations for specimens collected at hours 0–120; (b) increase in the analytes’ concentrations in specimens collected at hours 0–12, followed by decrease; (c) increase in analytes’ concentrations in specimens collected at later times. No matter which pattern is exhibited, a serial MA test would most likely turn negative in three days after a single dose. In contrast, any abnormal increase in both MA and AP accompa-nied by a AP/MA concentration ratios smaller than 1 might as well be attributed to a new administration of MA some time after the arrest. On the other hand, so long as the sectional hair analysis shows straight positives for both MA and AP and the AP/MA concentration ratios while keeping relatively constant remain smaller than 0.20, a totally negative serial urine test does not necessarily negate any recent use of MA.
For a real-case study to be more informative, (a) the number and source of testees need be increased; (b) the testees had better be made willing to provide longer and larger amounts of hair specimens for longer term sectional analyses as well as replicate analyses; this is because most of them have fear of bad looking in the back of their head. We will make more efforts in these matters.
Acknowledgments
Financial support by the National Bureau of Controlled Drugs, Department of Health, Republic of China, under Grant No. DOH93-NNB-1008 is gratefully acknowledged. The gener-ous offer of real-case urine and hair specimens from the Keelung City Police Department (Chien-Sheng Tiao, Chief), Taiwan, ROC, is highly appreciated.
References
[1] K.M. Jenkins, M.S. Young, C.R. Mallet, J. Anal. Toxicol. 28 (2004) 50. [2] P.S. Stout, K.L. Klette, C.K. Horn, J. Forensic Sci. 49 (1) (2004) 160. [3] G. Boatto, M. Nieddu, A. Carta, A. Pau, M. Palomba, B. Asproni, R.
[4] E.H. Taylor, P. Pat, J. Anal. Toxicol. 28 (2004) 190. [5] J.L. Valentine, J. Anal. Toxicol. 19 (1995) 581.
[6] A. Woolley, A Guide to Practical Toxicology, Taylor & Francis, Lon-don/New York, 2003.
[7] D. Anderson, D.M. Conning, Experimental Toxicology. The Basic Prin-ciples, The Royal Society of Chemistry, London, 1988.
[8] R.H. Liu, Forensic Sci. Rev. 4 (1) (1992) 51. [9] D.C. Haas, P.R. Sheehe, Headache 44 (2004) 1029. [10] D. Haifalah, J. Santavy, Biomed. Pap. 148 (1) (2004) 11.
[11] M.I. Palmatier, J.L. Wilkinson, D.M. Metschke, R.A. Bevins, Neuropsy-chopharmacology (2004) 1.
[12] W.B. Gentry, A.U. Ghafoor, W.D. Wsinger, E.M. Laurenzana, H.P. Hen-drickson, S.M. Ownes, Pharm. Biol. Behav. 79 (2004) 751.
[13] K. Chaturvedi, P.S. Cardona, J.W. Soper, D.V. Canfield, J. Forensic Sci. 49 (2004) 832.
[14] D.C. Lott, S.J. Kim, E.H. Cook Jr., H. de Wit, Neuropsychopharmacol-ogy (2004) 1.
[15] R.B. Rothman, S. Jayanthi, J.L. Cadet, X. Wang, C.M. Dersch, M.H. Baumann, N. Y. Acad. Sci. 1025 (2004) 151.
[16] M.G. Corda, G. Piras, D. Lecca, Behav. Brain Res. 157 (2005) 147. [17] S. Seidel, E.A. Singer, H. Just, H. Farhan, P. Scholze, O. Kudlacek,
M. Holy, K. Koppatz, P. Krivanek, M. Freissmuth, H.H. Sitte, Mol. Pharmacol. 67 (1) (2005) 140.
[18] Schwienbacher, M. Fendt, H.U. Schnitzler, Exp. Brain Res. 160 (2005) 538.
[19] Brebner, S. Ahn, A.G. Phillips, Psychopharmacology 177 (2005) 409. [20] D. Wrona, L. Sukiennik, M.K. Jurkowski, E. Jurkowlaniec, W. Glac, J.
Tokarski, Brain Behav. Immun. 19 (2005) 69.
[21] A.M. Baumgartner, P.F. Jones, W.A. Baumgartner, C.T. Black, J. Nucl. Med. 20 (1979) 748.
[22] T. Inoe, S. Seta, Forensic Sci. Rev. 4 (2) (1992) 89.
[23] M. Chiarotti, S. Strano-Rossi, Forensic Sci. Rev. 8 (2) (1996) 111. [24] D.E. Rollins, D.G. Wilkins, S.P. Gygi, M.H. Slawson, P.R. Nagasawa,
Forensic Sci. Rev. 9 (1) (1997) 23.
[25] D.L. Lin, R.M. Yin, H.C. Liu, C.Y. Wang, R.H. Liu, J. Anal. Toxicol. 28 (2004) 411.
[26] J.A. Ruth, P.R. Stout, Forensic Sci. Rev. 16 (2004) 115.
[27] H. Sachs, History of hair analysis, Forensic Sci. Int. 84 (1997) 7. [28] P. Kintz (Ed.), Drug Testing in Hair, CRC Press, Boca Raton, 1996. [29] J. Rohrich, G. Kauert, Forensic Sci. Int. 84 (1997) 179.
[30] R. Kronstand, A. Johan, D. Nil, L. Goran, J. Anal. Toxicol. 27 (2003) 135.
[31] C.R. Borges, J.C. Roberts, D.G. Wilkins, D.E. Rollins, J. Anal. Toxicol. 27 (2003) 125.
[32] D.J. Claffey, P.R. Stout, J.A. Ruth, J. Anal. Toxicol. 14 (2001) 1339. [33] H. Khun, Experientia 36 (1980) 863.
[34] S.F. DeLauder, D.A. Kidwell, Forensic Sci. Int. 107 (2000) 93. [35] D.A. Kidwell, D.L. Blank, Drug Testing in Hair, CRC Press, Boca
Raton, FL, 1996, p. 17.
[36] P. Kintz, V. Cirimele, Forensic Sci. Int. 84 (1997) 151.
[37] M. Akihiro, K. Munehiro, S. Noriaki, T. Hitoshi, J. Anal. Toxicol. 28 (2004) 132.
[38] S. Roman, P. Wojciech, J. Anal. Toxicol. 28 (2004) 77.
[39] S.-M. Wang, Y.-C. Ling, L.-C. Tsai, Y.-S. Giang, J. Chromatogr. A 715 (1995) 325.
[40] S.-M. Wang, Y.-S. Giang, Y.-C. Ling, J. Chromatogr. B 759 (2001) 17. [41] S.-M. Wang, Y.-S. Giang, Y.-C. Ling, Forensic Sci. J. 1 (1) (2002) 47,
http://www.cpu.edu.tw/fsjournal.
[42] Y.-S. Giang, S.-M. Wang, H.-L. Chiang, Forensic Sci. J. 2 (1) (2003) 27, http://www.cpu.edu.tw/fsjournal.
[43] S.-M. Wang, Y.-C. Ling, Y.-S. Giang, Forensic Sci. J. 2 (1) (2003) 5, http://www.cpu.edu.tw/fsjournal.
[44] S.-M. Wang, T.-C. Wang, Y.-S. Giang, J. Chromatogr. B 816 (2005) 131.
[45] S.-M. Wang, J. Chromatogr. B 825 (2005) 79.
[46] S.-L. Chou, M.-H. Yang, Y.-C. Ling, Y.-S. Giang, J. Chromatogr. B 799 (2004) 37.
[47] G. Cooper, D.L. Allen, K.S. Scott, J.S. Oliver, J. Ditton, I.D. Smith, J. Forensic Sci. 45 (2000) 400.
[48] S. Suzuki, T. Inoe, H. Hori, S. Iniyama, J. Anal. Toxicol. 13 (1989) 176.
[49] J.T. Cody, Forensic Sci. Rev. 6 (2) (1994) 81.
[50] E.J. Cone, M.A. Huestis, Forensic Sci. Rev. 1 (2) (1989) 121. [51] Y. Nakahara, Forensic Sci. Int. 70 (1995) 135.