Field emission of carbon nanotubes on anodic aluminum oxide template with
controlled tube density
Po-Lin Chen, Jun-Kai Chang, Cheng-Tzu Kuo, and Fu-Ming Pan
Citation: Applied Physics Letters 86, 123111 (2005); doi: 10.1063/1.1886260 View online: http://dx.doi.org/10.1063/1.1886260
View Table of Contents: http://scitation.aip.org/content/aip/journal/apl/86/12?ver=pdfcov
Published by the AIP Publishing
Articles you may be interested in
Carbon nanotubes synthesized by biased thermal chemical vapor deposition as an electron source in an x-ray tube
Appl. Phys. Lett. 86, 123115 (2005); 10.1063/1.1891299
Vertically aligned carbon nanofibers and related structures: Controlled synthesis and directed assembly
J. Appl. Phys. 97, 041301 (2005); 10.1063/1.1857591
Growth of multiwalled-carbon nanotubes using vertically aligned carbon nanofibers as templates/scaffolds and improved field-emission properties
Appl. Phys. Lett. 86, 053110 (2005); 10.1063/1.1852730
Growth behavior and interfacial reaction between carbon nanotubes and Si substrate
J. Vac. Sci. Technol. A 22, 1461 (2004); 10.1116/1.1735908
Field emission of large-area and graphitized carbon nanotube array on anodic aluminum oxide template
J. Appl. Phys. 93, 5602 (2003); 10.1063/1.1564882
This article is copyrighted as indicated in the article. Reuse of AIP content is subject to the terms at: http://scitation.aip.org/termsconditions. Downloaded to IP: 140.113.38.11 On: Thu, 01 May 2014 03:05:38
Field emission of carbon nanotubes on anodic aluminum oxide template
with controlled tube density
Po-Lin Chen, Jun-Kai Chang, Cheng-Tzu Kuo, and Fu-Ming Pana兲
Department of Materials Science and Engineering, National Chiao Tung University, Hsinchu, Taiwan
共Received 2 November 2004; accepted 13 February 2005; published online 17 March 2005兲
The tube number density of aligned carbon nanotubes共CNTs兲 grown over the nanoporous anodic aluminum oxide 共AAO兲 template can be directly controlled by adjusting the CH4/ H2 feed ratio during the CNT growth. We ascribe the variation of the tube density as a function of the CH4/ H2 feed ratio to the kinetic competition between outgrowth of cobalt-catalyzed CNTs from the AAO pore bottom and deposition of the amorphous carbon 共a-C兲 overlayer on the AAO template. A pore-filling ratio of 18% to 82% for the nanotubes overgrown out of nanopores on the AAO template can be easily achieved by adjusting the CH4/ H2feed ratio. Enhanced field emission properties of CNTs were obtained by lowering the tube density on AAO. However, at a high CH4concentration, a-C by-product deposit on the CNT surface can degrade the field emission property due to a high energy barrier and significant potential drop at the emission site. © 2005 American Institute of Physics. 关DOI: 10.1063/1.1886260兴
Carbon nanotubes共CNTs兲 have become one of the most promising candidates for field electron emitters to be used in future generations of cold-cathode flat panel displays and various vacuum microelectronic devices.1 For field mission display application, it is necessary to grow vertically aligned CNT arrays on a large area with suitable tube density and tube dimensions. In recent years, template methods, such as anodic aluminum oxide共AAO兲 nanotemplates in particular, have been widely introduced to produce well aligned and monodispersed CNT arrays.2When CNTs are grown in the AAO template without transition metal catalyst, the diam-eter, the length, the arrangement, and the packing density of nanotubes can faithfully replicate the pattern of the AAO nanopore structure. However, these tubes are very poor in graphitization.3 In the case of metal catalyst assisted growth of CNTs in the AAO template, crystallinity of CNTs can be remarkably improved, but a relatively high tube growth rate will lead to overgrowth and entanglement of the dense nanotubes.4 Since the field emission property of CNTs is greatly affected by the field-screening effect caused by neighboring nanotubes,5 it is necessary to well control the length and the spacing of CNTs. In this letter, we report that the tube density of the cobalt-catalyzed CNTs on the AAO template can be controlled by regulating the flow rate ratio of methane共CH4兲 to hydrogen 共H2兲 precursor gases during the CNT growth, and thereby field emission characteristics of CNTs can be adjusted.
In the experiment, two-step anodization, which has been reported in detail elsewhere,6was used to prepared ordered AAO pore channel arrays. The Co catalyst for the CNT growth was electrochemically deposited at the pore bottom. The CNT growth was carried out in the microwave plasma
共2.45 GHz兲 electron cyclotron resonance chemical
deposi-tion共ECR-CVD兲 system under a magnetic field strength of 875 Gauss. The gas mixture of CH4and H2was used as the carbon source. The total gas flow rate was kept constant at 22 sccm. The other growth conditions were: microwave
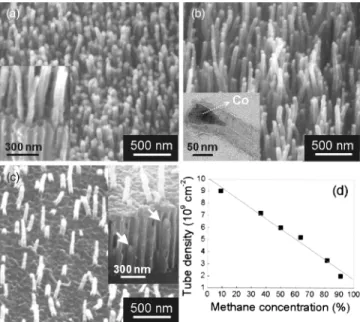
power 700 W, substrate bias −150 V, working pressure 0.25 Pa, growth temperature 600 ° C, and growth time 30 min. The CH4concentration in the gas precursor was var-ied from 9% to 91% in order to investigate the influence of the CH4/ H2 ratio on the CNT growth. Figures 1共a兲–1共c兲 show the side-view scanning electron micrographs共SEM兲 of the AAO templated CNTs grown at CH4 concentrations of 9%, 50%, and 91%, respectively. As shown, the CNT density changes dramatically depending on the carbonaceous gas content. At the CH4 concentration of 9%关see Fig. 1共a兲兴, the tube density of CNT is as high as 9.0⫻109tubes/ cm2, indi-cating a pore-filling ratio of about 82%, which is defined as the density ratio of the nanotubes to the AAO pores. At an extremely high CH4concentration of 91%关see Fig. 1共c兲兴, the
a兲
Electronic mail: [email protected]
FIG. 1. Side-view SEM images of the AAO templated CNTs grown at CH4 concentrations of共a兲 9%, 共b兲 50%, and 共c兲 91%. The insets in 共a兲 and 共c兲 are the cross-sectional view of the CNTs. The inset in共b兲 is the TEM image of the CNT.共d兲 The tube density of CNTs grown over the AAO nanopores as a function of the CH4concentration.
APPLIED PHYSICS LETTERS 86, 123111共2005兲
0003-6951/2005/86共12兲/123111/3/$22.50 86, 123111-1 © 2005 American Institute of Physics
This article is copyrighted as indicated in the article. Reuse of AIP content is subject to the terms at: http://scitation.aip.org/termsconditions. Downloaded to IP: 140.113.38.11 On: Thu, 01 May 2014 03:05:38
tube density decreases significantly to about 2.0
⫻109tubes/ cm2, corresponding to a pore-filling ratio of about 18%. The inset in Fig. 1共b兲 shows the transmission electron microscopy 共TEM兲 image of the CNTs. It clearly shows that a Co catalyst particle is encapsulated at the tube tip and covered by graphitic cap, suggesting that the CNT growth is via the tip-growth mechanism.7
While the Co-catalyzed CNTs were grown in the AAO template, deposition of carbonaceous by-product on the AAO template took place simultaneously.8As shown in Fig. 1共c兲, the AAO surface was covered by a thin layer of deposit, which seriously blocked the outgrowth of CNTs. Auger elec-tron spectroscopy 共AES兲 was used to study the chemical composition of the deposit. The shape of the carbon 共KVV兲 peak in the Auger spectrum共not shown兲 reveals that the de-posit is most likely composed of amorphous carbon共a-C兲. The a-C layer is formed by plasma decomposition of CH4 and H2, and deposited on the AAO surface during the CNT growth, in particular, at high CH4/ H2feed ratios.
9
The a-C deposition seems to play an important role in control of the tube density of CNTs on the AAO template. During the CNT growth in the CH4/ H2plasma, the a-C by-product is concur-rently deposited on the AAO template, whereas it can be quickly etched away by reactive hydrogen species in the plasma.10At a high CH4/ H2 feed ratio, the a-C deposition overwhelms the etch reaction, resulting in steady growth of the a-C.9 The a-C layer will gradually cover up the AAO nanopores and prevent nanotubes from growing out of the nanopores. As shown in the inset of Fig. 1共c兲, some short nanotubes marked by white arrows are buried inside the na-nopores. Those CNTs which have already grown out of the nanopores can continuously grow up since the CNT growing site is at the tip of the nanotubes共tip-growth mechanism兲. At the CH4 concentration of 91%, only about 18% of CNTs grew out of the AAO nanopores. On the other hand, at a low CH4/ H2feed ratio, the AAO surface is almost free from the a-C layer 关see the inset of Fig. 1共a兲兴 since it was quickly etched away by hydrogen species, leading to efficient CNT growth and thus a very high tube density. Figure 1共d兲 shows that the tube density is inversely proportional to the CH4 concentration. In addition to the tube density, the CNTs grown at CH4 concentration of 91% are shorter than those grown at 50% and 9% as shown in Figs. 1共a兲–1共c兲. This is probably due to that the a-C layer may also be deposited on the CNT, which can hinder reactive carbonaceous species from reaching the Co catalyst, hence reducing the CNT growth rate.
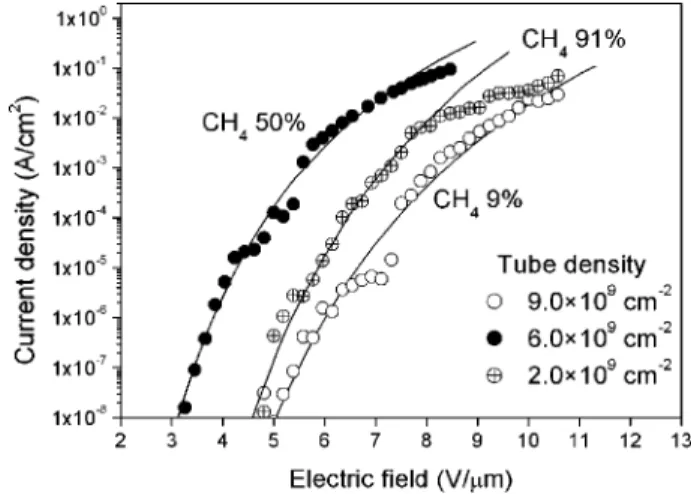
Figure 2 shows the field emission current density共J兲 as a function of the applied electric field 共E兲 for the AAO tem-plated CNTs with three different tube densities shown in Figs. 1共a兲–1共c兲. Measurements were conducted by the simple diode configuration and performed in a vacuum about 10−6Torr. The anode is a platinum wire with a hemispherical tip 1 mm in diameter. The distance between the CNTs and the anode was about 100m. The CNT film with the highest density of 9.0⫻109tubes/ cm2 shows the worst emission property in terms of the highest turn-on electric field 共Eto兲
共8.1 V/m兲 and the lowest current density, where Etois de-fined herein as the electric field required to produce an emis-sion current density of 1 mA/ cm2. As the tube density de-creases to about 6.0⫻109tubes/ cm2, the field emission property is remarkably improved 共Eto⬃5.2 V/m兲. How-ever, when the tube density decreases further to about 2.0
⫻109tubes/ cm2 the field emission property deteriorates
共Eto⬃7.4 V/m兲. The dependence of the emission current on the applied electric field for a tip emitter can be described via the Fowler–Nordheim共F–N兲 relation11
J⬀ Eloc2 exp共− 6.8 ⫻ 107⌽3/2/Eloc兲, 共1兲 where⌽ is the local work function of the emitter tip, and Eloc is the effective local electric field at the tip. According to the relation, the emission current is only dependent on the local electric field at the emission site assuming a constant work function on the emitter tip. The local field depends on the applied bias共V兲 and the radius 共R兲 of a free-standing emitter tip, yielding Eloc= V / kR, where k is a geometric factor with a value between 1 and 5. According to the SEM micrographs shown in Fig. 1, the CNTs grown at different CH4 concen-trations show little difference in the tip radius and shape, and hence all the three CNT samples presumably have similar values of k and R. The three samples differ in morphology mainly by two parameters, the tube density, and length. The better field emission characteristic of the CNT film deposited with 50% CH4 compared with the sample with 9% CH4 is probably due to a slighter field-screening effect.5However, it has been reported that a single CNT with a higher aspect ratio of the tube can have a larger field enhancement, and thus have a lower Eto and a higher emission current.
12 Be-cause the CNT tube arrays were grown out of the AAO na-nopore channels, the three samples have a similar tube diam-eter about 75 nm. The average tube lengths protruding out of the AAO surface are estimated to be 1230 nm, 1110 nm, and 237 nm for CNTs grown with CH4 concentrations of 9%, 50%, and 91%, respectively. Thus the tube aspect ratios of the three CNT samples are 26.3, 24.7, and 13.0, respectively, when the height of the CNT portion imbedded in the AAO template, which is about 740 nm thick, is taken into account. According to the J – E curve shown in Fig. 2, at applied fields below 6 V /m, the emission current density difference be-tween the two denser CNT samples is more than three or-ders. This is far more than expected for such a small differ-ence in the aspect ratio between the two samples. The large differences in the Eto and the emission current density be-tween the two samples can thus be attributed to the field-screening effect. Moreover, compared with the CNTs grown with 91% CH4, the film with 9% CH4 shows inferior
field-FIG. 2. Field emission current density共J兲 as a function of electric field 共E兲 for the CNTs grown on the AAO template with the three different tube densities shown in Figs. 1共a兲–1共c兲. The solid curves are F–N fits using the low current/field regions which do not show saturation.
123111-2 Chenet al. Appl. Phys. Lett. 86, 123111共2005兲
This article is copyrighted as indicated in the article. Reuse of AIP content is subject to the terms at: http://scitation.aip.org/termsconditions. Downloaded to IP: 140.113.38.11 On: Thu, 01 May 2014 03:05:38
emission characteristic in the low field regime. Because the film of the highest tube density has a higher aspect ratio, it would be expected to have better field emission characteris-tic if the field-screening effect were insignificant. Therefore the highest Eto and lowest emission current density of the CNT film deposited with 9% CH4 suggests that the field-screening effect plays a significant role on the field emission property. On the other hand, although the higher tube aspect ratio of the CNT film deposited with 50% CH4may improve the field emission property as compared with the CNTs grown with 91% CH4, the former has worse field-screening effect than the later due to the higher tube density. We be-lieve that the a-C deposit on the CNT tip is likely a major factor deteriorating the field emission characteristic of the CNTs grown with 91% CH4.
The F – N plot for the J – E curve of Fig. 2 is shown in Fig. 3. For the CNTs grown with 91% CH4, the F – N plot clearly exhibits two linear segments with a slope of about −13500 V−1 in the low field regime and a slope of about −5200 V−1 in the high field regime. The other two CNT samples do not show such an obvious slope break although they also have a nonlinear feature in the F – N plots. Nonlin-earity of F – N plots for CNTs has been widely reported, and, in general, is ascribed to space charge effect13and/or energy barrier modification by an dielectric overlayer deposited on the CNTs during CNT growth.14,15Breakdown of the dielec-tric overlayer16 are also proposed to be responsible for the nonlinear behavior. However, the breakdown of the dielectric overlayer is excluded since the field emission result is repro-ducible. If the CNT tip is heavily coated by the a-C deposit, the effective local work function and conductivity of the emitter can be significantly modified, resulting in a marked deviation from the normal F – N plot. As discussed previ-ously, during the CNT growth, a-C is deposited on the AAO surface and, possibly, the CNTs as well, and the amount of a-C deposit increases with increasing the CH4concentration in the gas mixture. For a very thin a-C overlayer, electrons emitted from the CNT can easily tunnel through the thin a-C dielectric layer under a moderate electric field. The work function modification on the emitter tip might just slightly alter the emission current and thus the Eto. But as the dielec-tric overlayer becomes thicker, the width of the energy
bar-rier becomes wider, and thus electrons tunneling through the dielectric layer become difficult. A higher electric field is required to decrease the effective barrier height and narrow the barrier width so that electron tunneling and thus field emission can become thriving. Moreover, it has been re-ported that resistance present in the field emitter structure can lead to field emission degradation.17 If the emitter resis-tance or the emission current is large, a potential drop through the emitter will occur, lowering the local field at the emission site. This can cause deviation of the field emission from the normal F – N characteristic in the high emission current regime. Because significant a-C deposit is present on the CNT film grown with 91% CH4, the potential drop oc-curring through the dielectric overlayer at the emission site as field emission electrons leave CNT tips will be larger than that of the other two samples. This is probably an important reason why the CNT sample grown with 91% CH4 has the F – N plot remarkably different from that of the other two samples, which have much less a-C deposit during the CNT growth.
In summary, the tube density and length of CNTs grown from the AAO nanopores vary with the CH4/ H2feed ratio. A high CH4concentration leads to the heavy deposition of an a-C deposit on the AAO surface. Although the a-C can ef-fectively decrease the CNT density on the AAO template, thereby decreasing the field-screening effect and increasing the field enhancement, it notably deteriorates the electron field emission property of the CNTs. The nonlinearity of the F – N plot of the CNTs is ascribed to the deposition of the a-C overlayer on the CNT tip. The CNTs grown at 50% CH4 show the best field emission property.
This work was supported partly by the National Science Council of Taiwan, under Contract Nos. NSC92-2210-M-009-001 and NSC93-2120-M-009-007.
1
Yahachi Saito and Sashiro Uemura, Carbon 38, 169共2000兲. 2
J. Li, C. Papadopoulos, J. M. Xu, and M. Moskovits, Appl. Phys. Lett. 75, 367共1999兲.
3
Y. C. Sui, D. R. Acosta, J. A. González-León, A. Bermúdez, J. Feucht-wanger, B. Z. Cui, J. O. Flores, and J. M. Saniger, J. Phys. Chem. B 105, 1523共2001兲.
4
Soo-Hwan Jeong, Ok-Joo Lee, and Kun-Hong Lee, Chem. Mater. 14, 1859共2002兲.
5
L. Nilsson, O. Groening, C. Emmenegger, O. Kuettel, E. Schaller, and L. Schlapbach, Appl. Phys. Lett. 76, 2071共2000兲.
6
H. Masuda and K. Fukuda, Science 268, 1466共1995兲. 7
R. T. K. Baker, Carbon 27, 315共1989兲. 8
Soo-Hwan Jeong, Ok-Joo Lee, Kun-Hong Lee, Sang-Ho Oh, and Chan-Gyung Park, Chem. Mater. 14, 4003共2002兲.
9
K. B. K. Teo, M. Chhowalla, G. A. J. Amaratunga, W. I. Milne, G. Pirio, P. Legagneux, F. Wyczisk, J. Olivier, and D. Pribat, J. Vac. Sci. Technol. B
20, 116共2002兲. 10
Olivier M. Küttel, Oliver Groening, Christoph Emmenegger, and Louis Schlapbach, Appl. Phys. Lett. 73, 2113共1998兲.
11
I. Brodie and P. Schwoebel, Proc. IEEE 82, 1006共1994兲. 12
C. J. Edgcombe and U. Valdre, Solid-State Electron. 45, 857共2001兲. 13
N. S. Xu, S. Z. Deng, and J. Chen, Ultramicroscopy 95, 19共2003兲. 14
Hiroyoshi Tanaka, Seiji Akita, Lujun Pan, and Yoshikazu Nakayama, Jpn. J. Appl. Phys., Part 1 43, 864共2004兲.
15
H. Gao, C. Mu, F. Wang, D. S. Xu, K. Wu, and Y. C. Xie, J. Appl. Phys. 93, 5602共2003兲.
16
P. G. Collins and A. Zettl, Phys. Rev. B 55, 9391共1997兲. 17
O. Groning, O. M. Kuttel, P. Groning, and L. Schlapbach, J. Vac. Sci. Technol. B 17, 1970共1999兲.
FIG. 3. Corresponding F – N plots of data shown in Fig. 2. The slopes of the F – N plot for the CNTs grown at 91% CH4are also indicated in the figure.
123111-3 Chenet al. Appl. Phys. Lett. 86, 123111共2005兲
This article is copyrighted as indicated in the article. Reuse of AIP content is subject to the terms at: http://scitation.aip.org/termsconditions. Downloaded to IP: 140.113.38.11 On: Thu, 01 May 2014 03:05:38