行政院國家科學委員會專題研究計畫 成果報告
台灣期貨市場之市場結構與市場品質
計畫類別: 個別型計畫 計畫編號: NSC93-2416-H-004-039- 執行期間: 93 年 08 月 01 日至 94 年 07 月 31 日 執行單位: 國立政治大學國際貿易學系 計畫主持人: 郭維裕 報告類型: 精簡報告 處理方式: 本計畫可公開查詢中 華 民 國 94 年 10 月 31 日
The Effect of Trading Mechanism on the Market Quality of
Taiwan Futures Exchange
Weiyu Kuo
October 2005
Weiyu Kuo is an associate professor of the Department of International Trade, National Chengchi
Abstract
On July 29, 2002, the Taiwan Futures Exchange decided to transform its original
call auction trading mechanism into a continuous auction trading mechanism in order
to improve the quality of the futures market in Taiwan. This transformation provides
us with a unique opportunity to examine the effect of trading mechanism on the
market quality. We evaluate the market quality according to twelve different
measures commonly used in the literature of market microstructure. We also
investigate the change in the adverse selection cost due to the transformation of
trading mechanism by decomposing the bid-ask spread into two components, the
order processing cost and the adverse selection cost, based on the model of Lin,
Sanger, and Booth (1995). In general, our results show that the continuous auction
market has better market liquidity, lower price volatility, and greater market depth
than the call auction market. In other words, the market quality of the TAIFEX
actually improves after switching to the new trading mechanism. Furthermore, the
continuous auction market is also more effective than the call auction market in
resolving the problem of information asymmetry in the TAIFEX according to the
component structure estimated by the model of Lin, Sanger, and Booth. Interestingly,
this result is inconsistent with the results of Madhavan (1992), Pagano and Röell
1.
Introduction
The relationship between market structure and market quality has long attracted
academic attention in decades. In general, there are three popular types of market
structure in worldwide capital markets. They are the quote-driven market, the
order-driven market, and the hybrid market. The quote-driven market is also called
continuous dealer market. In this type of market, dealers are responsible for
posting firm quotes before actual transactions. In other words, investors are able to
obtain firm price quotations from market makers prior to order submission, so that
they can trades immediately with a market maker without waiting for order
execution. In contrast, in an order-driven market, investors submit their orders for
execution through either a continuous auction process or a periodic auction process.
In the former, investors submit orders for immediate execution by dealers on an
exchange floor or against existing limit orders submitted by public investors or
dealers. Yet, in the latter, orders of investors are aggregated for a certain period of
time and then matched at a single market clearing price at predetermined points of
time during a trading day. Nevertheless, most capital markets are operating as
hybrid markets that are complex hybrids of these three types of market structures.
Based on a Bayes-Nash equilibrium model, Madhavan (1992) examines and
contrasts the price formation process under the continuous dealer market, the
continuous auction market, and the periodic auction market. An important finding
of Madhavan (1992) is that the periodic auction market aggregates information
efficiently and is more robust to problems of information asymmetry since it can
operate where a continuous auction market fails. In particular, he shows that the
information asymmetry cost is higher in continuous auction markets than that in
cost implies higher bid-ask spread, he does not explicitly derive this result in this
paper. Pagano and Röell (1992) consider a model in which market prices are set by
risk neutral competitive market makers, so that the order flow exerts price pressure
entirely due to its informational content. According to this model, they find that the
bid-ask spread is lower in the periodic auction market than on the continuous dealer
market and intermediate in the continuous auction market. In a similar framework,
Pagano and Röell (1996) find that due to its greater market transparency, a periodic
auction market has lower expected trading costs for liquidity traders than a
continuous auction market. By manipulating trading rules and information sets in
laboratory asset markets, Schnitzlein (1996) investigates the relative performance of
periodic auction and continuous auction under asymmetric information. He also
finds that the adverse selection costs incurred by liquidity traders are significantly
lower under the periodic auction market than the continuous auction market. In
summary, these theoretical articles show that the bid-ask spread and its information
asymmetry component are significantly lower in a periodic auction market than in a
continuous auction market.
There exist many studies focusing on testing the aforementioned theoretical
predictions empirically. Basically, these studies evaluate the difference in market
quality under different market structures. Christie and Huang (1994) examine the
change in transaction costs for firms that move from NASDAQ, a dealer market, to
the NYSE (AMEX), a specialist market. They report a significant reduction in
trading costs based on various market liquidity measures. Huang and Stoll (1996)
also find larger execution costs for a sample of NASDAQ stocks than those for a
matched sample of NYSE stocks. In this paper execution costs are measured in
termsofthequoted spread,theeffectivespread,therealized spread,theRoll’s (1984) implied spread, and the post-trade variability. De Jong, Nijman, and Röell (1995)
compare the costs of trading French stocks listed both on the Paris Bourse, an
electronic continuous auction market, and on SEAQ International in London, a
continuous dealer market. They find that for small transactions, the former has
lower implicit trading costs than the latter measured by the effective and quoted
bid-ask spreads. Blemmerhassett and Bowman (1998) study the impact on
transaction costs of the switch from an open outcry or oral auction market, a type of
order-driven markets, to an electronic continuous auction market. They find that
the bid-ask spread declines after the switch.
Although examining the value effects for stocks transferring from a daily call
auction market to an iterated continuous call auction market, Amihud, Mendelson,
and Lauterbach (1997) also find a significant increase in liquidity for this
transformation as measured by the liquidity ratio, which measures the trading
volume associated with a unit change in the stock price. As a mirror image study
of Amihud, Mendelson, and Lauterbach (1997), Lauterbach (2001) examines the
change in market liquidity for 97 stocks that moved from continuous trades back to
single daily call auctions. He finds that upon exiting continuous trades, stock
liquidity drops. In contrast to Christie and Huang (1994) and Huang and Stoll
(1996), Clyde, Schultz, and Zaman (1997) investigate 47 stocks that voluntarily left
the AMEX from 1992 through 1995 and listed on the NASDAQ and find that both
effective and quoted spreads increase by about 100 percent after listing on the
NASDAQ. Degryse (1999) studies the market liquidity improvement resulting
from competition between the Brussels CATS market, an electronic continuous
auction market,and London’sSEAQ-I, a dealer market. He finds that both the effective and quoted bid-ask spreads are smaller in the Brussels CATS market.
the AMEX between 1971 and 1994. Although they find significant liquidity
improvement as measured by percentage spread, trading volume, liquidity ratio,
Hasbrouck’s (1993) , and nonsystematic variance of stock returns estimateds
based on the market model, the degree of improvement actually varies across these
different measures. Based on these results, they conclude that liquidity has many
facets and cannot be represented by the bid-ask spread alone.
Based on a sample of stocks traded on the London Stock Exchange, a dealer
market, and also traded as ADRs on the NYSE, a specialist market, Huang and Stoll
(2001) show that the London dealer market exhibits higher bid-ask spreads than the
NYSE specialist market. Kehr, Krahnen, and Theissen (2001) compare execution
costs in two parallel trading mechanisms in the Frankfurt Stock Exchange: the
specialist market and the electronic continuous auction market. They find that
order execution costs for small trades in the specialist market are lower than the
quoted spread in the continuous market, while order execution costs for large
transactions in the specialist market are higher than the spread in the continuous
market. This result implies that specialists are indeed able to distinguish
informational trades from liquidity trades and then adjust the spread accordingly to
protect themselves from trading with informed traders. In addition, Theissen (2002)
analyzes the trading costs in the floor and computerized trading systems that exist in
parallel in the German stock market. He finds that the bid-ask spread is not
generally lower in one trading mechanism, but the electronic trading mechanism is
less attractive for less liquid stocks since it is more vulnerable to information trading.
From the above literature review, we can reach the following conclusions: (i)
Previous studies heavily concentrated on comparing transaction costs in a
quote-driven market and an order-driven market, especially a dealer market or a
on equity market and very little attention has been paid to other markets, such as
bond markets and derivatives markets. (ii) These studies employ various measures
to examine market quality. These measures include the bid-ask spread, the
effective bid-ask spread, the liquidity ratio, the trading volume, the price volatility,
the Hasbrouck’s , the nonsystematic variance of stock returns estimated based ons
the market model, and so on. However, all these measures cannot reflect the
adverse selection costs incurred by investors in a market. Hence, how to quantify
the information asymmetry cost is also important to the market quality under a
market structure.
In comparison to the vast literature on the market structure of equity markets,
some papers have investigated the relationship between market structure and market
quality in derivatives markets recently. Given that many market participants and
scholars have argued that open outcry markets should be more liquid than
computerized markets in providing market liquidity for futures contracts, Pirrong
(1996) empirically examines this claim based on market liquidity in the
computerized Deutsche Terminborse (DTB) Bund market and the open outcry
London International Financial Futures Exchange (LIFFE) Bund market. He finds
that the former is more liquid than the latter. By investigating the liquidity of the
same Bund markets, Frino, McInish, and Toner (1998) also show that the quoted
bid-ask spreads are wider on the LIFFE than the DTB, even after controlling for
their determinants. This result is in line with that of Pirrong (1996). Tse and
Zabotina (2001) examine transaction costs and market quality of FTSE 100 Index
futures contracts after the LIFFE decided to transfer the trading venue for these
contracts from an open outcry market to an electronic market. Like Pirrong (1996)
quality in terms of smaller variance of the pricing error than the former.
Combining the two streams of relevant literature, we find that for equity
markets, previous studies focus on comparing the difference in market quality
between the dealer market and the continuous auction market, and for derivatives
markets, previous studies focus on comparing market quality in the open outcry
market and the computerized auction market. To the best of our knowledge, no
papers so far have paid any attention to the difference in market quality between a
periodic auction market and an electronic auction market. It may simply because
this kind of event rarely happens in worldwide markets if there is any. The decision
of the Taiwan Futures Exchange (TAIFEX) to switch its original electronic
periodic auction market to an electronic continuous auction market on July 29, 2002,
therefore, provides us with a unique opportunity to compare the market quality of
these two different market structures.
Taking advantage of this rare switch in market structure and considering the
multi-facet property of market liquidity suggested by Elyasiani, Hauser, and
Lauterbach (2000), we examines the change in market liquidity after the transition
based on various measures of market quality including the bid-ask spread, the
effective bid-ask spread, the equally weighted bid-ask spread, the equally weighted
effective bid-ask spread, the dollar-volume weighted bid-ask spread, the
dollar-volume weighted effective bid-ask spread, the trading volume, the number of
trades, the trade size, the price volatility, the liquidity ratio and the information
asymmetry component of the bid-ask spread.
In general, our results show that the continuous auction market has better market
liquidity, lower price volatility, and greater market depth than the call auction market.
the new trading mechanism. Furthermore, the continuous auction market is also
more effective than the call auction market in resolving the problem of information
asymmetry in the TAIFEX according to the component structure estimated by the
model of Lin, Sanger, and Booth. Interestingly, this result is inconsistent with the
results of Madhavan (1992), Pagano and Röell (1992, 1996), and Schnitzlein (1996).
The remainder of the paper is organized as follows. Section 2 provides a brief
description of the trading mechanism of the Taiwan Futures Exchange. Section 3
introduces the data set and empirical methodology. Section 4 presents and discusses
our empirical results. Section 5 concludes the paper.
2.
Trading Mechanisms of Taiwan Futures Exchange
Acknowledging that a channel for risk management is essential to the efficiency
of the domestic financial market and to the competitive advantages in the global
markets, the first futures exchange in Taiwan, the Taiwan Futures Exchange
(TAIFEX), was founded in 1998. Its first product, the Taiwan Stock Exchange
Capitalization Weighted Stock Index (TX) futures contract, was formally traded on
July 21st, 1998. The goal of TAIFEX is to provide a safe harbor and a leveled
playing field for the investors to meet their needs at all times. Furthermore, after a
full year transaction of the TX futures contract, the TAIFEX introduced the Electronic
contract on July 21st, 1999. Since then, the TAIFEX has kept expanding its product
line in order to provide investors with more hedging channels. In particular, the
Mini-TX futures contract and the TX options contract started trading on April 9th,
2001 and December 24th, 2001, respectively. Moreover, the TAIFEX added two
more products, equity options contract and the Taiwan 50 futures contract, to its
existent product line in 20031. As shown in Table 1, the total transaction volume of
these futures and options contracts experienced an enormous growth during the period
from 2002 to 2003. Specifically, the annual transaction volume of the TAIFEX in
2003 achieved a record of 31,874,934 contracts, equivalent to average daily
transaction volume of 128,067 that represents an impressive growth of over 300
percent of the annual transaction volume in 2002 of 7,944,254 contracts, equivalent to
average daily trading volume of 32,033.
The TAIFEX opens at 8:45 a.m. and closes at 1:45 p.m., Monday to Friday. The
TAIFEX begins to receive orders at 8:30 a.m. Both limited and market orders are
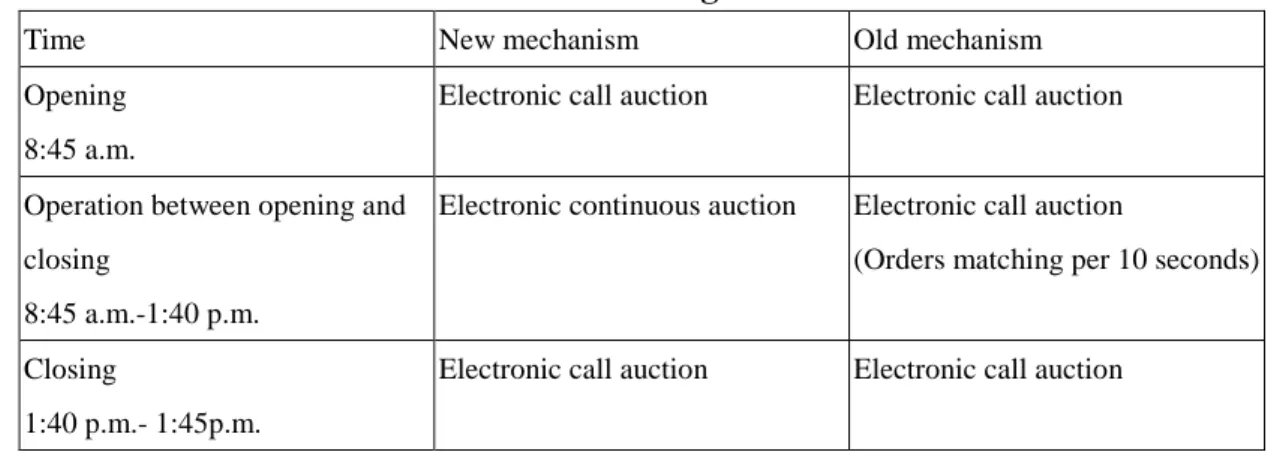
acceptable. Before July 29th, 2002, the TAIFEX operated as an electronic call
auction market. In addition to the opening and closing call auctions, the periodic
call auctions were operated throughout the rest of the trading day, in which orders
were matched every 10 seconds at a market price that maximizes the trading volume.
In order to improve the efficiency of execution and the price response to market
information, the TAIFEX decided to transfer from the original electronic call auction
system to an electronic continuous auction system for all of its futures contracts on
July 29th, 2002. Table 2 summarizes the structures of these two trading
mechanisms.
In the new trading mechanism, the opening and closing call auctions are kept
intact and a continuous auctions system is operated between the opening and closing
times. In the continuous auction system, an order is matched immediately once it
enters the Electronic Trading System (ETS). The order execution priority and
matching principles are described as follows:
(I) Priority will be firstly given to the orders with the best bid/offer prices and
secondly the earliest time of entry into the ETS. Market orders are prior to
limit orders.
(II) Orders with an identical bid or offer price entering before market opening
will be ranked randomly.
(III) Orders to buy or sell at the market price can be considered as limit orders
registered with limit-up or limit-down, respectively.
(IV) Buy orders registered with prices higher than the market price and sell
(V) If not filled during the day, orders will be cancelled automatically. All
orders must be traded within the price limits that are determined by the
TAIFEX after the market closes on the previous business day.
3.
Data Description and Empirical Methodology
3.1 Data Description
This study investigates the impact of trading mechanism on the market quality of
the TAIFEX based the intraday data of the TX futures contract, the TE futures
contract, and the TF futures contract. The data are collected from the Taiwan
Economic Journal Intraday Data Bank, which is compiled from the data file provided
by the TAIFEX. The intraday data include the time-stamped quotes and trades for
all traded contracts. By discarding the first and the last 5-minute data to reduce the
potential biases caused by the overnight effect and the closing auction, we conduct
our empirical study based on the quoted bid and ask prices, the transaction prices, and
the transaction volumes for the nearest month contracts traded on the TAIFEX from
8:50 a.m. to 1:40 p.m..
The new trading mechanism started on July 29th, 2002. To make the market
participants understand the new trading mechanism, the TAIFEX began to hold
introduction activities at the end of May 2002. To avoid the empirical results
March 2002 to May 2002 and from October 2002 to December 2002, omitting the
data from June 2002 to September 2002.
Other screening criteria taken to assemble the data are described as below:
(Ⅰ) Any record without transaction volumes is discarded from the sample.
(Ⅱ) To ensure the correction of the empirical study, recording errors and missing
data are also excluded. The transaction prices and quotes must be positive.
The lowest ask must exceed the highest bid. The transaction prices that
violate the price limits, 7% higher or lower than the pervious day’s closing
prices, are discarded as well.
(Ⅲ) The sample is divided into two groups to compare the change of liquidity
and transaction costs components. The sample before the enforcement is
formed from May 2002 and the post-event window is formed from October
2002 to December 2002.
Table 3 contains the specification of the TX Futures, the TE Futures, and the TF
futures.
3.2 Empirical Methodology
According to O’Hara(1995),marketstructuresmay differin threedimensions: market participants, trading locations, and trading rules. Loosely speaking, market
structures differ in determining who can trade, what they can trade, and when, where,
certainly affect its market quality commonly measured in terms of market liquidity,
price efficiency, price volatility, and trading profits. Better market quality should
be manifested in high market liquidity, high price efficiency, low price volatility, and
fair trading profits to different types of traders.
Measuring the quality of a market in terms of price efficiency needs a specific
asset pricing model. The dependence of price efficiency on an asset pricing model
may result in the problem of joint hypothesis testing similar to that in testing the
market efficiency. Besides, our data are not detailed enough for us to calculate the
average trading profits for different types of traders before and after the
transformation of the trading mechanism. Hence, we focus on evaluating the
market quality in terms of market liquidity and price volatility, especially the market
liquidity.
The efficiency of a trading mechanism in resolving information asymmetry
existing in the market is frequently regarded as an important characteristic of a
desirable trading mechanism. However, the aforementioned liquidity and volatility
measures cannot adequately reflect the adverse selection costs incurred by investors
in a market. Hence, how to quantify the information asymmetry cost is also crucial
when one evaluates the quality of a market structure. We employ the spread
decomposition model of Lin, Sanger, and Booth (1995) to extract the order
processing component and the adverse selection component of the quoted bid-ask
spread. Based on this decomposition, we are able to investigate the change in the
degree of information asymmetry due to the transformation of the trading
mechanism in the TAIFEX.
3.2.1 Liquidity Measures
their orders executed quickly at the lowest cost. There are various measures used to
describe the liquidity of a market, which may have the same or different patterns.
This study focuses on liquidity measures including the quoted spread, the effective
spread, the percentage quoted spread, the percentage effective spread, the
dollar-volume-weighted average percentage quoted spread, the
dollar-volume-weighted average percentage effective spread, the trading volume, the
number of trades, the trade size, and the liquidity ratio.
A. Bid-Ask Spread
In order-driven markets, public limit orders provide liquidity to the market and
establish the bid-ask spread. The quoted bid-ask spread is determined as the
difference between the lowest price of the sell limit orders and the highest price of the
buy limit orders. The effective spread is determined as the difference of the
transaction price and the mid-point of the bid-ask prices. The bid-ask spread
represents a part of the transaction costs facing traders who desire to make their orders
executed immediately and actively.
There are six types of bid-ask spreads computed in this paper:
(Ⅰ) the quoted spread
1 1 t t qt A B S , t =1, 2, 3…n. (1)
highest buying order and the lowest selling order announced after the transaction t-1
is executed, which become the ask and bid price for the transaction t.
(Ⅱ) the effective spread
1 t t et P M S , (2) where 2 ) ( 1 1 1 t t t B A M , t =1, 2, 3…n. (3)
Pt is the trading price of transaction at time t and the Mt-1 is the most recent quoted
midpoint.
(Ⅲ) the percentage quoted spread
1 1 1 100 % t t t qt M B A S , t =1, 2, 3…n. (4)(Ⅳ) the percentage effective spread
1 1 200 % t t t et M M P S , t =1, 2, 3…n. (5)
(Ⅴ) the dollar-volume-weighted average percentage quoted spread
n t n t t qt t w q V S V S 1 1 % % . (6)where Viis the volume of transaction t.
(Ⅵ) the dollar-volume-weighted average percentage effective spread
n t n t t et t w e V S V S 1 1 % % . (7)To calculate all measures corresponding to the transaction t, At-1 and Bt-1 is
calculated instead of Atand Bt since Atand Bt will be disclosed only after orders are
matched at time t.
B. Volume, Number of Trades and Trade Size
Many empirical studies associate volume with liquidity. (Amihud, Mendelson,
Lauterbach, 1997; Elyasiani, Hauser, and Lauterbach, 2000) Theoretically, the
trading volume or trading frequency of a security is positively related to its liquidity
(Mendelson, 1982, 1985; Amihud and Mendelson, 1986). Academics show that the
transaction costs limit trading activities. (O’Hara, 1995; Blennerhassett and Bownman,
1998) The number of trades and the trade size are also viewed as the measures of
trading frequency. To compare the market liquidity of different trading mechanisms
on the TAIFEX, we calculate the trading volume, the number of trades and the trade
size as the average values of each trading day.
C. Volatility
Volatility is also a key variable to measure the market performance. Traders
can liquidate their securities with only little price movements in a low volatility
market. Madhavan (1992) indicates that the call market mechanism forces traders to
reveal the information existing in the market through order placement, which results
higher information costs, which cause lower market liquidity. To evaluate the
market quality in terms of price volatility, we calculate the standard deviations of the
transaction prices and the rates of return as the proxies of price volatility.
D. Liquidity Ratio
The liquidity ratio measures the trading volume associated with a unit change of
the transaction price. The higher the ratio is, the better ability a market has to absorb
large amount of transactions without inducing large price movements. (Amihud,
Mendelson, and Lauterbach, 1997, Elyasiani, Hauser, and Lauterbach, 2000) The
liquidity ratio is defined as follows.
n t n t t t R V LR 1 1 , (8)where Vt and Rt are the trading volume and the rate of return for the transaction at
time t and the summation is over all transactions during a trading day.
3.2.2 The Bid-Ask Spread Components
Several models have been proposed for estimating the information asymmetry
cost or the adverse selection cost by decomposing the quoted bid-ask spread, e.g.,
Glosten and Harris (1988), Stoll (1989), George, Kaul, and Nimalendran (1991), Lin,
Sanger, and Booth (1995), Madhavan, Richardson, and Roomans (1997), and Huang
and Stoll (1997). All these models decompose the spread into two or three
information asymmetry cost. Considering the fact that there is no designated market
maker in the TAIFEX and the empirical results of Menyah and Paudyal (2000) and
Van Ness, Van Ness, and Warr (2001)2 about the performance of these spread
decomposition models in capturing information asymmetry cost, we decide to use the
model of Lin, Sanger, and Booth (1995) to extract the adverse selection component of
the quoted bid-ask spread.
Lin, Sanger, and Booth (1995) estimate three parameters in their models: the
order processing cost (γ), the adverse selection cost (λ), and the order persistence
(θ). Consider a market sell (buy) order that is executed at the dealer’s bid price
(ask price) Bt (At) at time t. Let Qt (At Bt)/2 be the quote midpoint at time t.
t t
t P Q
z , where Ptis the transaction price, represents one-half the signed effective
spread with zt< 0 for a sell order and zt> 0 for a buy order. These parameters can be
estimated from the following regressions:
1 1 t t t t Q z e Q , (9) 1 1 t t t z z , (10)
where the disturbance terms, et+1 and ηt+1 are assumed to be uncorrelated. In (9)
and (10), λreflects the quote revision as a fraction of the effective spread zt and θ
2 Majois and Winne (2003) also suggest that since the inventory cost may not exist in order-driven
markets due to the absence of liquidity suppliers, the two-way decomposition models, therefore, provide better estimates of the adverse selection cost. In addition, Brockman and Chung (1999) use
reflects the order persistence.
With (9), (10), and zt Pt Qt, the order processing cost for the trade at time t can be estimated by the following equation:
t t t t t t P Q Q z z P1 ( 1 ) 1 1 zt ut , (11)
where 1 and ut1 et1 .t1 To identify whether the spread
components change after the enforcement of the new trading mechanism, the
parameters, λ, γ, and θ are estimated separately for the samples before and after
the enforcement.
4.
Empirical Results
Before discussing the empirical results, we should remind that according to the
model of Madhavan (1992) and the laboratory experiment of Schnitzlein (1996), the
adverse selection costs incurred by liquidity traders are lower under the call auction
market than the continuous auction market and that the expected total trading costs for
liquidity traders are also lower under the call auction market than the continuous
auction market based on the models of Pagano and Röell (1992, 1996). Our results
provide empirical validation for these theoretical predictions.
Twelve proxies of market quality are calculated for three types of futures
two separate sample periods. The first period spans three months from March 2002
to May 2002 when the trading mechanism was operated as a call auction market while
the second period is from September 2002 to December 2002 when the trading
mechanism was switched to a continuous auction market. Note that the proxies are
not calculated in the same data frequency. In particular, while the quote spread, the
effective spread, the percentage quote spread, and the percentage effective spread are
computed based on intradaily observations, the other proxies are computed based on
daily observations.
4.1 Liquidity
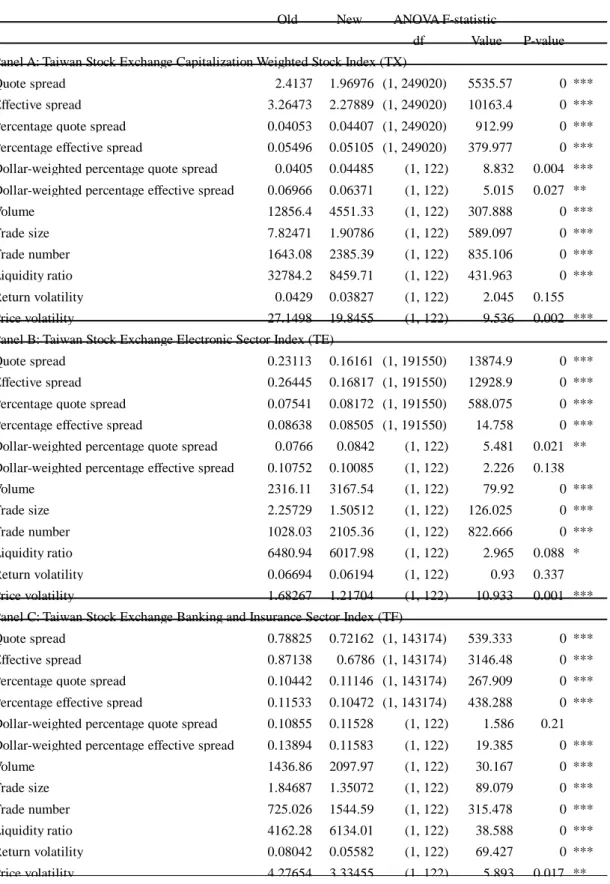
Table 4 compares the liquidity measures before and after the enforcement of the
electronic continuous auction mechanism for the three types of futures contracts.
Three interesting features emerge from Table 4: (i) As for those liquidity measures
based on the bid-ask spread, the quote spread, the effective spread, the percentage
quote spread, the percentage effective spread, and the dollar-weighted percentage
effective spread all decrease significantly after the change of trading mechanism with
the only exception of the dollar-weighted percentage quote spread that increases
significantly. This result implies that the market liquidity improves in a great deal in
the continuous auction market so that the total transaction costs facing liquidity
of Pagano and Röell (1992, 1996). (ii) In contrast to the results of the spread-based
liquidity measures, the results for the proxies related to the trading volume are not
consistent for the three types of futures contract. Specifically, the transformation of
trading mechanism causes larger trading volume, larger trade number, and smaller
trade size for the TE and TF futures but smaller trading volume, large trade number,
and smaller trade size for the TX futures. Nevertheless, these results still point to
better market liquidity of the TX, TE, and TF futures in the continuous auction market.
(iii) For the TF and TE futures, the liquidity ratio, the price volatility, and the return
volatility all decrease significantly. The decrease of liquidity ratio implies that the
market depth of the TF and TE futures becomes shallow in the continuous auction
market. As for the TF futures, the liquidity ratio actually increases while the price
volatility and the return volatility both decrease as the TF and TE futures. In other
words, the market depth of the TF futures improves in the continuous auction market.
As shown in Table 4, the quote spread, the effective spread, the percentage
effective spread, and the dollar-weighted percentage effective spread for the TF, TE,
and TF futures are all significantly lower in the continuous auction market than those
in the original call auction market. Take the TX futures for example, the quote
spread decreases almost 20% from 2.4 index points to 2.0 index points; the effective
effective spread decreases from 0.054% to 0.051%. These results indicate that the
new trading mechanism may offer lower transaction costs for investors. However,
both the percentage quote spread and the dollar-weighted percentage quote spread
become significantly larger for these three types of futures contract in the continuous
auction market. For instance, the percentage quote spread and the dollar-weighted
percentage quote spread for the TX futures significantly increases about 10% from
0.041% to 0.044% and from 0.041% to 0.045%, respectively. It is apparent that
different measures of liquidity may not lead to the same conclusion, a manifestation
of the multi-facet property pointed out by Elyasiani, Hauser, and Lauterbach (2000).
In addition, the percentage effective spread represents the true costs facing traders
when they want their orders to be traded immediately but the percentage of quote
spread only indicates the difference between the price of the best limit-buying order
and the price of the best limit-selling order, which may not be executed at the next
transaction. Overall, these results suggest that the new trading mechanism offers
lower transaction costs for traders than the old one.
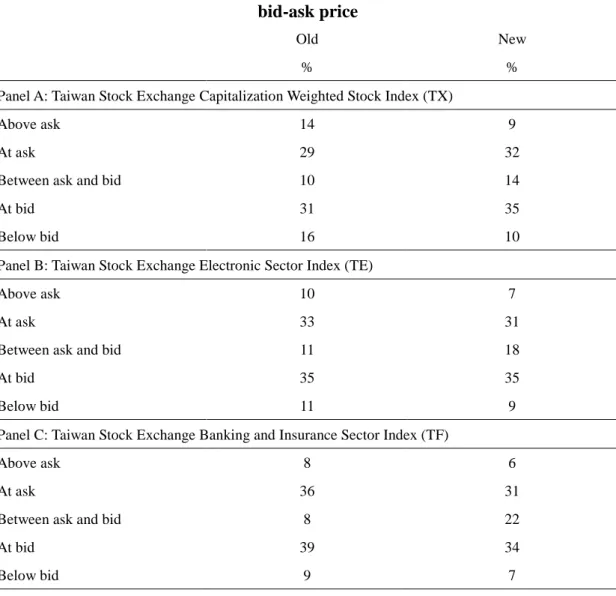
It is of interest to note that the percentage effective spread decreases while the
percentage quote spread increases. In order to understand the underlying reason of
this result, we examine the distribution of transaction price with respect to the quote
market, 30 percent of the transaction prices for the TX futures falls outside the quote
prices (above the ask price or below the bid price) and 60 percent at the quote prices
(at the ask price plus at the bid price). Only 10 percent stays inside the quote prices.
In the continuous auction market, the percentage for the transaction prices to fall
outside the quote prices decreases to 19% and that at the quote prices increases to
67%. Moreover, the percentage for the transaction prices to stay inside the quote
prices also increases to 14%. The transaction prices for both the TE and the TF
futures have similar patterns as shown in Panel B and C of Table 5. These patterns
explain exactly why the percentage effective spreads for the TX, the TE, and the TF
futures decrease while the percentage quote spreads increase.
Turning to the liquidity measures based on the trading volume, we find that the
trade size and the number of trade for the three types of futures contract become
smaller and higher, respectively. Take the TX futures for example, its trade size
declines significantly by 75% from 7.8 contracts to 1.9 contracts per transaction
whereas its number of trade increases significantly by 45% from 1643 to 2385 per
trading day. The result based on the trading volume is not as consistent as that based
on the trade size and the number of trade. In particular, although the average daily
trading volumes of the TE and TF futures increase significantly after the switch of the
declines significantly by nearly 65% from 12856 contracts to 4551 contracts.
Obviously, the trading mechanism does not have the same effect on the trading
volume of the TX, the TE, and the TF futures. Despite this inconsistent result, we
still can conclude that in general, the continuous auction market improves the market
liquidity and offers lower transaction costs for investors in the TAIFEX.
It is well known that the market depth and the price volatility are two important
indicators of market quality. Great market depth and low price volatility are
indicative of good market quality. It is apparent from Table 4 that both the price
volatility and the volatility of rate of return become lower for the TX, the TE, and the
TF futures in the continuous auction market, suggesting better market quality due to
the change of the trading mechanism. For instance, the price volatility and the return
volatility for the TF futures decline significantly from 4.28 index points to 3.33 index
points and from 0.08% to 0.06%, respectively. However, the result of the liquidity
ratio is a bit different. While the liquidity ratio for the TF futures increases
significantly from 4162.3 contracts to 6134 contracts, the liquidity ratio for the TX
and TE futures actually decreases from 32784.2 contracts to 8459.7 contracts and
from 6480.9 contracts to 6018 contracts. It implies that the market depth for the TF
futures improves significantly in the continuous auction market whereas the market
4.2 Bid-Ask Spread Components
In this section we employ the spread decomposition model of Lin, Sanger, and
Booth (1995) to separate the bid-ask spread into the order processing component and
the adverse selection cost component for the TF, the TE, and the TF futures in the call
auction market and the continuous auction market, respectively. Before we actually
estimate the model, we would like to study the behavior of the effective spread, zt,
which is important to the model estimation.
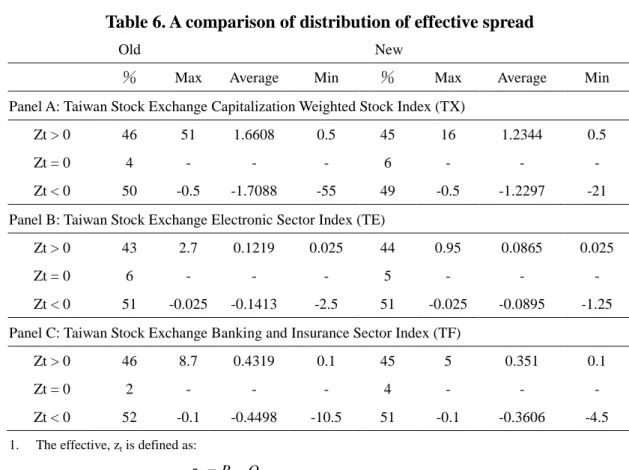
Table 6 summaries the distribution of effective spread. A transaction with zt>0
means that it is triggered by a buying order while a transaction with zt<0 indicates that
it is triggered by a selling order. Panel A of Table 6 shows that in the original call
auction market, 46 percent of the transactions for the TX futures are triggered by
buying orders; 50 percent are trigged by selling orders; and only 4 percent are traded
at the quote midpoint. After the market transforms to a continuous auction market,
45 percent of the transactions are triggered by buying orders; 49 percent are triggered
by selling orders; and the transactions occurring at the quote midpoint slightly
increase to 6 percent.
As shown in Panel B, the pattern of the transactions for the TE futures is a bit
different from that for the TX futures. After the transformation of the trading
percent to 44 percent while the transactions occurring at the quote midpoint decrease
by 1 percent to 5 percent. The figures in Panel C of Table 6 suggest that the
transactions for the TF futures, which are triggered by buying and selling orders, both
decrease by 1 percent. In contrast, the transactions occurring at the quote midpoint
increase by 2 percent.
It is obvious that in both types of trading mechanism, the transactions are
triggered more often by selling orders than buying orders. Since we cannot clearly
identify whether those transactions with zt=0 are triggered by selling orders or buying
orders, the estimation of the spread decomposition model would be biased if the
percentage of this kind of transactions is very high. Fortunately, less than 6 percent
of the transactions is matched at the quote midpoint. Hence, it is unlikely that the
transactions with zt=0 have significant impact on the estimation of the spread
components.
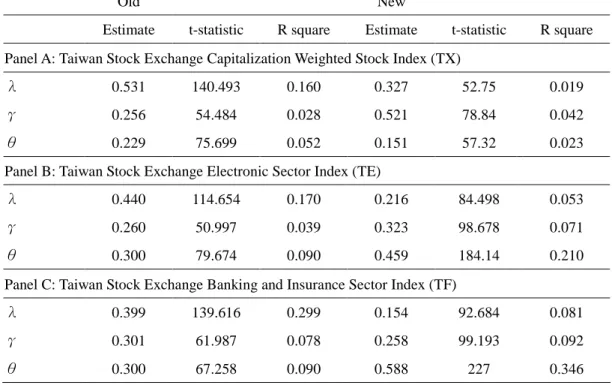
We present the estimates of the spread components for the TX, TE, and TF
futures in Table 7. We specifically report the estimates for those three parameters in
the model, the adverse information cost (λ), the order processing cost (γ), and the
persistence of order arrival (θ), the t-statistics for the estimates and the R-square
values for the estimated models.
decreases by almost 20% from 0.53 in the call auction market to 0.33 in the
continuous auction market while the order processing cost increases by 26% from
0.26 to 0.52. The estimates of the order persistence parameter decrease slightly by
8% from 0.23 to 0.15. In other words, the transactions are less persistent in the
continuous auction market. Furthermore, the adverse selection cost is the largest
component of the effective spread for the TX futures in the call auction market
whereas the order processing cost becomes the major component in the continuous
auction market.
Panel B indicates that after switching to the continuous auction market, the
adverse selection component for the TE futures decreases from 0.44 to 0.22 while the
order processing cost increases slightly from 0.26 to 0.32. However, unlike the TX
futures, the estimate of the order persistence for the TE futures increases from 0.3 to
0.46 and becomes the largest component of the effective spread. Therefore, the
continuous auction market is also effective in resolving the problem of information
asymmetry for the TE futures. As shown in Panel C, the installation of the
continuous auction trading system results in lower adverse selection cost and order
processing cost for the TF futures. Nevertheless, the transactions of the TF futures
become more persistent because the order persistence estimate increases sharply from
adverse selection cost to the traders involving in the transactions of the TF futures
contract.
According to the results in Table 7, we know that the change of trading
mechanism may have different effects on the component structure of the effective
spread for different futures contracts in the TAIFEX. While the order processing
cost for the TF futures declines, those for the TX and TE futures actually increase.
This increase of the order processing cost is consistent with the finding of Lin, Sanger,
and Booth (1995) and Huang and Stoll (1997) that the order processing cost declines
as the trade size increases. It is because the trade size of the TX and TE futures
increases indeed in the continuous auction market. The most consistent result in this
section is that the continuous auction trading mechanism can effectively reduce the
adverse selection cost for all three types of futures contracts. However, this result is
inconsistent with the predictions of the models of Madhavan (1992), Pagano and
Röell (1992, 1996), and Schnitzlein (1996). It would be intriguing to investigate this
result further in our future research.
5.
Conclusions
On July 29th, 2002, the TAIFEX decided to switch its trading mechanism from the
original call auction market to the continuous auction market. This decision
market quality of futures market. In this paper, the market quality is evaluated based
on twelve commonly used proxies including the quoted spread, the effective spread,
the percentage quoted spread, the percentage effective spread, the
dollar-volume-weighted average percentage quoted spread, the
dollar-volume-weighted average percentage effective spread, the trading volume, the
number of trades, the trade size, the liquidity ratio, the price volatility, and the
volatility of the rate of return. Besides, the change in the adverse selection cost due
to the switch of trading mechanism is also investigated based on the spread
decomposition model of Lin, Sanger, and Booth (1995).
Our empirical results confirm the finding of Elyasiani, Hauser, and Lauterbach
(2000) that market liquidity indeed has many facts and cannot be represented by the
bid-ask spread alone. In particular, the empirical results show that the quote spread,
the effective spread, the percentage effective spread, and the dollar-weighted
percentage effective spread are lower in the continuous auction market. However,
the other liquidity measures do not illustrate the same pattern. Overall, although not
very consistent, these results based on the liquidity measures suggest that the market
quality of the continuous auction market is better than the call auction market.
Besides, the continuous auction market is also more effective than its counterpart in
Amihud, Y. and H. Mendelson, 1986, Asset Pricing and the Bid-Ask Spread, Journal of Financial Economics 17, 223-249.
Amihud, Y., H. Mendelson, and B. Lauterbach, 1997, Market Microstructure and Securities Values: Evidence from the Tel Aviv Stock Exchange, Journal of Financial Economics 45, 365-390.
Blennerhassett, M., and R.G. Bowman, 1998, A Change in Market Microstructure: The Switch to Electronic Screen Trading on the New Zealand Stock Exchange, Journal of International Financial Markets, Institutions and Money 8, 261-276. Brockman, P., and D.Y. Chung, 1999, Bid-Ask Spread Components in an
Order-Driven Environment, Journal of Financial Research 22, 227-246.
Christie, W.G., and R.D. Huang, 1994, Market Structures and Liquidity: Transactions Data Study of Exchange Listings, Journal of Financial Intermediation 3, 300-326.
Clyde, P., P. Schultz, and M. Zaman, 1997, Trading Costs and Exchange Delisting: The Case of Firms that Voluntarily Move from the American Stock to the Nasdaq, Journal of Finance 52, 2103-2112.
Degryse, H., 1999, The Total Cost of Trading Belgian Shares: Brussel versus London, Journal of Banking & Finance 23, 1331-1355.
De Jong, F., T. Nijman, and A. Röell, 1995, A Comparison of the Cost of Trading French Shares on the Paris Bourse and on SEAQ International, European Economic Review 39, 1277-1301.
Elyasiani, E., S. Hauser, and B. Lauterbach, 2000, Market Response to Liquidity Improvements: Evidence from Exchange Listings, The Financial Review 41, 1-14.
Frino, A., T.H. McInish, and M. Toner, 1998, The Liquidity of Automated Exchanges: New Evidence from German Bund Futures, Journal of International Financial Markets, Institutions and Money 8, 225-241.
George, T.J., G. Kaul, and M. Nimalendran, 1991, Estimation of the Bid-Ask Spread and Its Components: A New Approach, Review of Financial Studies 4, 623-656. Glosten, L.R., L.E. Harris, 1988, Estimating the Components of the Bid/Ask Spread,
Journal of Financial Economics 21, 123-142.
Hasbrouck, J., 1993, Assessing the Quality of a Security Market: A New Approach to Transaction-cost Measurement, The Review of Financial Studies 6, 191-212. Huang, R.D., and H.R. Stoll, 1996, Dealer versus Auction Markets: A Paired
Comparison of Execution Costs on NASDAQ, Journal of Financial Economics 41, 313-357.
Huang, R.D., and H.R. Stoll, 1997, The Components of the Bid-Ask Spread: A General Approach, Review of Financial Studies 10, 995-1034.
Huang, R.D. and H.R. Stoll, 2001, Tick Size, Bid-Ask Spreads, and Market Structure, Journal of Financial and Quantitative Analysis 36, 503-522.
Kehr, C., J.P. Krahnen, and Erik Theissen, 2001, The Anatomy of a Call Market, Journal of Financial Intermediation 10, 249-270.
Lauterbach, B., 2001, A Note on Trading Mechanism and Securities’ Value: The Analysis of Rejects from Continuous Trade, Journal of Banking and Finance 25, 419-430.
Lin, J., G.C. Sanger, and G.G. Booth, 1995, Trade Size and Components of the Bid-Ask Spread, Review of Financial Studies 8, 1153-1183.
Madhavan, A., 1992, Trading Mechanisms in Securities Markets, Journal of Finance 47, 607-641.
Madhavan, A., M. Richardson, and M. Roomans, 1997, Why Do Security Prices Change? A Transaction-Level Analysis of NYSE Stocks, Review of Financial Studies 10, 1035-1064.
Majois, C., and R.D. Winne, 2003, A Comparison of Alternative Spread Decomposition Models on Euronext Brussels, working paper.
Mendelson, H., 1982, Market Behavior in a Clearing House, Econometrica 50, 1505-1524.
Mendelson, H., 1986, Random Competitive Exchange: Price Distributions and Gain from Trade, Journal of Economic Theory 37, 254-280.
Menyah, K. and K. Paudyal, 2000, The Components of Bid-Ask Spreads on the London Stock Exchange, Journal of Banking and Finance 24, 1767-1785.
O’Hara,M.,1995,Market Microstructure Theory, Blackwell Publishers Ltd, Oxford, UK.
Pagano, M. and A. Röell, 1992, Auction and Dealership Markets: What is the difference?, European Economic Review 36, 613-623.
Pagano, M., and A. Roell, 1996, Transparency and Liquidity: A Comparison of Auction and Dealer Markets with Informed Trading, Journal of Finance 51, 579-611.
Pirrong, C., 1996, Market Liquidity and Depth on Computerized and Open Outcry Trading Systems: A Comparison of DTB and LIFFE Bund Contracts, Journal of Futures Markets 16, 519-543.
Roll, R., 1984, A Simple Implicit Measure of the Effective Bid-Ask Spread in an Efficient Market, Journal of Finance 39, 1127-1139.
Schnitzlein, C.R., 1996, Call and Continuous Trading Mechanisms Under Asymmetric Information: An Experimental Investigation 51, 1996, 613-636. Stoll, H.R., 1989, Inferring the Components of the Bid-Ask Spread: Theory and
Tse, Y. and T.V. Zabotina, 2001, Transaction Costs and Market Quality: Open Outcry Versus Electronic Trading, Journal of Futures Markets 21, 713-735.
Theissen, E., 2002, Floor versus Screen Trading: Evidence from the German Stock Market, Journal of Institutional and Theoretical Economics 158, 32-54.
Van Ness, B.F., R.A. Van Ness, and R.S. Warr, 2001, How Well Do Adverse Selection Components Measure Adverse Selection?, Financial Management Autumn, 77-98.
Table 1. The volumes of products traded on the TAIFEX
Contract Annual Volume 2003 Annual Volume 2002 % Increase
Futures
TAIEX Futures (TX) 6,514,691 4,132,040 57.66 Electronic Sector Index Futures (TE) 990,752 834,920 18.66 Finance/Insurance Sector Index
Futures (TF)
1,126,895 366,790 207.23 Mini-TAIEX Futures (MTX) 1,316,712 1,044,058 26 Taiwan 50 Futures (T5F) 4,068 N/A (Launch date:
June 30th, 2003)
N/A
Total (Futures) 9,953,118 6,377,808 N/A
Options
TAIEX Options (TXO) 21,720,083 1,566,446 1286.58 Equity Options (STO) 201,733 N/A (Launch date:
January 20th, 2003)
N/A
Total (Options) 21,921,816 1,566,446 N/A
Total (Futures & Options) 31,874,934 7,944,254 301.23
Source: the article “2003:Record VolumefortheFifth ConsecutiveYearforTAIFEX” on the official website of the Taiwan Future Exchange.
Table 2. The new and old trading mechanism of TAIFEX
Time New mechanism Old mechanism Opening
8:45 a.m.
Electronic call auction Electronic call auction Operation between opening and
closing
8:45 a.m.-1:40 p.m.
Electronic continuous auction Electronic call auction
(Orders matching per 10 seconds) Closing
1:40 p.m.- 1:45p.m.
Table 3. Contracts specification of the TX Futures, the TE Future, and the TF
futures3
Item Description Underlying Index
Taiwan Stock Exchange Capitalization Weighted Stock Index
Taiwan Stock Exchange Electronic Sector Index
Taiwan Stock Exchange Banking and Insurance Sector Index
Ticker Symbol TX TE TF
Delivery Months Spot month, the next calendar month, and the next three quarter months Last Trading Day The third Wednesday of the delivery month of each contract
Trading Hours
08:45AM-1: 45 PM Taiwan time Monday through Friday of the regular business days of the Taiwan Stock Exchange
Contract Size NT$200 * Index NT$4,000 * Index NT$1,000 * Index Minimum Price
Fluctuation
One index point (NT$200)
0.05 index point (NT$200)
0.2 index point (NT$200) Daily Price Limit +/- 7% of previous day's settlement price
Margin
The initial and maintenance margin levels as well as the collecting measures prescribed by the FCM to its customers shall not be less than those required by the TAIFEX. The margin levels will be adjusted and announced by the TAIFEX in accordance with "the Criteria and Collecting Methods regarding the Clearing Margins".
Daily Settlement Price The last trading price of the closing session or otherwise determined by the TAIFEX according to the trading rules
Final Settlement Day The first business day following the last trading day. All of the open interests after the final settlement day shall be settled on the final settlement price.
Final Settlement Price
The final settlement price for each contract is computed from the first fifteen-minute volume-weighted average of each component stock's prices in the index on the final settlement day. For those component stocks that are not traded during the beginning fifteen- minute interval on the final settlement day, their last closing prices would be applied instead.
Settlement Cash settlement
Table 4. A comparison of liquidity before and after the enforcement of electronic continuous auction trading mechanism
*** 1% Significant Level ** 5% Significant Level * 10% Significant Level Old New df Value P-value Quote spread 2.4137 1.96976 (1, 249020) 5535.57 0 *** Effective spread 3.26473 2.27889 (1, 249020) 10163.4 0 *** Percentage quote spread 0.04053 0.04407 (1, 249020) 912.99 0 *** Percentage effective spread 0.05496 0.05105 (1, 249020) 379.977 0 *** Dollar-weighted percentage quote spread 0.0405 0.04485 (1, 122) 8.832 0.004 *** Dollar-weighted percentage effective spread 0.06966 0.06371 (1, 122) 5.015 0.027 ** Volume 12856.4 4551.33 (1, 122) 307.888 0 *** Trade size 7.82471 1.90786 (1, 122) 589.097 0 *** Trade number 1643.08 2385.39 (1, 122) 835.106 0 *** Liquidity ratio 32784.2 8459.71 (1, 122) 431.963 0 *** Return volatility 0.0429 0.03827 (1, 122) 2.045 0.155 Price volatility 27.1498 19.8455 (1, 122) 9.536 0.002 *** Quote spread 0.23113 0.16161 (1, 191550) 13874.9 0 *** Effective spread 0.26445 0.16817 (1, 191550) 12928.9 0 *** Percentage quote spread 0.07541 0.08172 (1, 191550) 588.075 0 *** Percentage effective spread 0.08638 0.08505 (1, 191550) 14.758 0 *** Dollar-weighted percentage quote spread 0.0766 0.0842 (1, 122) 5.481 0.021 ** Dollar-weighted percentage effective spread 0.10752 0.10085 (1, 122) 2.226 0.138 Volume 2316.11 3167.54 (1, 122) 79.92 0 *** Trade size 2.25729 1.50512 (1, 122) 126.025 0 *** Trade number 1028.03 2105.36 (1, 122) 822.666 0 *** Liquidity ratio 6480.94 6017.98 (1, 122) 2.965 0.088 * Return volatility 0.06694 0.06194 (1, 122) 0.93 0.337 Price volatility 1.68267 1.21704 (1, 122) 10.933 0.001 *** Quote spread 0.78825 0.72162 (1, 143174) 539.333 0 *** Effective spread 0.87138 0.6786 (1, 143174) 3146.48 0 *** Percentage quote spread 0.10442 0.11146 (1, 143174) 267.909 0 *** Percentage effective spread 0.11533 0.10472 (1, 143174) 438.288 0 *** Dollar-weighted percentage quote spread 0.10855 0.11528 (1, 122) 1.586 0.21 Dollar-weighted percentage effective spread 0.13894 0.11583 (1, 122) 19.385 0 *** Volume 1436.86 2097.97 (1, 122) 30.167 0 *** Trade size 1.84687 1.35072 (1, 122) 89.079 0 *** Trade number 725.026 1544.59 (1, 122) 315.478 0 *** Liquidity ratio 4162.28 6134.01 (1, 122) 38.588 0 *** Return volatility 0.08042 0.05582 (1, 122) 69.427 0 *** Price volatility 4.27654 3.33455 (1, 122) 5.893 0.017 ** ANOVA F-statistic
Panel A: Taiwan Stock Exchange Capitalization Weighted Stock Index (TX)
Panel C: Taiwan Stock Exchange Banking and Insurance Sector Index (TF) Panel B: Taiwan Stock Exchange Electronic Sector Index (TE)
Table 5. A summary of distribution of transaction price with respect to the quote bid-ask price
Old New
% %
Panel A: Taiwan Stock Exchange Capitalization Weighted Stock Index (TX)
Above ask 14 9
At ask 29 32
Between ask and bid 10 14
At bid 31 35
Below bid 16 10
Panel B: Taiwan Stock Exchange Electronic Sector Index (TE)
Above ask 10 7
At ask 33 31
Between ask and bid 11 18
At bid 35 35
Below bid 11 9
Panel C: Taiwan Stock Exchange Banking and Insurance Sector Index (TF)
Above ask 8 6
At ask 36 31
Between ask and bid 8 22
At bid 39 34
Table 6. A comparison of distribution of effective spread
Old New
% Max Average Min % Max Average Min Panel A: Taiwan Stock Exchange Capitalization Weighted Stock Index (TX)
Zt > 0 46 51 1.6608 0.5 45 16 1.2344 0.5
Zt = 0 4 - - - 6 - -
-Zt < 0 50 -0.5 -1.7088 -55 49 -0.5 -1.2297 -21 Panel B: Taiwan Stock Exchange Electronic Sector Index (TE)
Zt > 0 43 2.7 0.1219 0.025 44 0.95 0.0865 0.025
Zt = 0 6 - - - 5 - -
-Zt < 0 51 -0.025 -0.1413 -2.5 51 -0.025 -0.0895 -1.25 Panel C: Taiwan Stock Exchange Banking and Insurance Sector Index (TF)
Zt > 0 46 8.7 0.4319 0.1 45 5 0.351 0.1
Zt = 0 2 - - - 4 - -
-Zt < 0 52 -0.1 -0.4498 -10.5 51 -0.1 -0.3606 -4.5
1. The effective, ztis defined as:
t t t P Q
z
where Ptis the transaction price, represents one-half the signed effective spread with zt< 0 for a sell order and zt> 0 for a buy orders.
Table 7. Empirical Estimates of the spread components of the Effective spread
Old New
Estimate t-statistic R square Estimate t-statistic R square Panel A: Taiwan Stock Exchange Capitalization Weighted Stock Index (TX)
λ 0.531 140.493 0.160 0.327 52.75 0.019 γ 0.256 54.484 0.028 0.521 78.84 0.042 θ 0.229 75.699 0.052 0.151 57.32 0.023 Panel B: Taiwan Stock Exchange Electronic Sector Index (TE)
λ 0.440 114.654 0.170 0.216 84.498 0.053 γ 0.260 50.997 0.039 0.323 98.678 0.071 θ 0.300 79.674 0.090 0.459 184.14 0.210 Panel C: Taiwan Stock Exchange Banking and Insurance Sector Index (TF)
λ 0.399 139.616 0.299 0.154 92.684 0.081 γ 0.301 61.987 0.078 0.258 99.193 0.092 θ 0.300 67.258 0.090 0.588 227 0.346
6. Each parameter is estimated for the nearest –month contract of each of the three products, TX, TE, and TF in each of the periods, the old trading system and the new trading system.
7. The adverse information is estimated:
1
1
Qt zt et (9)
where Qt1Qt1Qt, Qtis the quote midpoint at time t; zt Pt Qt, Ptis the trade price at time t; λ
is the adverse information component of effective spread. 8. The order processing cost is estimated:
1 1 Pt zt ut (11) where t t t P P P
1 1 ; γis the order processing component of effective spread. 9. The order persistence is estimated:
1
1
t t
t z
z