www.elsevier.com/locate/renene
Assessment of wind characteristics and wind
turbine characteristics in Taiwan
Tsang-Jung Chang
a,∗, Yu-Ting Wu
a, Hua-Yi Hsu
a,
Chia-Ren Chu
b, Chun-Min Liao
aaDepartment of Bioenvironmental Systems Engineering, National Taiwan University, Taipei, 10617
Taiwan
bDepartment of Civil Engineering, National Central University, Taoyuan, 32054 Taiwan
Received 23 July 2002; accepted 8 September 2002
Abstract
Wind characteristics and wind turbine characteristics in Taiwan have been thoughtfully ana-lyzed based on a long-term measured data source (1961–1999) of hourly mean wind speed at 25 meteorological stations across Taiwan. A two-stage procedure for estimating wind resource is proposed. The yearly wind speed distribution and wind power density for the entire Taiwan is firstly evaluated to provide annually spatial mean information of wind energy potential. A mathematical formulation using a two-parameter Weibull wind speed distribution is further established to estimate the wind energy generated by an ideal turbine and the monthly actual wind energy generated by a wind turbine operated at cubic relation of power between cut-in and rated wind speed and constant power between rated and cut-out wind speed. Three types of wind turbine characteristics (the availability factor, the capacity factor and the wind turbine efficiency) are emphasized. The monthly wind characteristics and monthly wind turbine characteristics for four meteorological stations with high winds are investigated and compared with each other as well. The results show the general availability of wind energy potential across Taiwan.
2002 Elsevier Science Ltd. All rights reserved.
Keywords: Wind energy; Wind characteristics; Wind turbine characteristics; Weibull wind speed distri-bution; Taiwan
∗ Corresponding author. Fax: 886-2-23635854.
E-mail address: tjchang@ccms.ntu.edu.tw (T.-J. Chang).
0960-1481/03/$ - see front matter2002 Elsevier Science Ltd. All rights reserved. PII: S 0 9 6 0 - 1 4 8 1 ( 0 2 ) 0 0 1 8 4 - 2
1. Introduction
Taiwan, a rapidly industrializing society with population density as high as 602 people/km2 (22 million people within an island of 36,000 km2), has faced a number
of energy utilization challenges at the beginning of the 21st century. Firstly, 89% of total energy supply in 2000 came from imported fossil fuels (petroleum 51%, coal 31%, and natural gas 7%) [1]. Availability of imported energy supplies and fluctuations in international energy prices strongly influences island-wide economic development. The newly elected government has decided not to construct any new nuclear power plants in the future, and the currently operating nuclear power plants (9% of the total energy supply) will be halted gradually. It is expected that the increasing use of fossil fuels would result in rapidly increasing CO2emissions, which
apparently violates the implementation of the Kyoto Protocol. Secondly, the concen-trated power supply system is connected by two 345 KV transmission lines and hence reduces the independence and flexibility of regional power supplies during natural disasters such as earthquakes and typhoons. The island-wide power supply system shut down twice in 1999 due to a landslide-induced transmission tower failure in central Taiwan in July and a severe earthquake occurring in September. To face the aforementioned energy utilization challenges, the government has begun to react, including planning the utilization of renewable energy sources.
The global wind energy industry has been setting a record for newly installed generating capacity since the late 1990s. Technological progress has also dramati-cally reduced the price of wind power in favorable locations in such a way that the rate of growth appeared likely to maintain wind’s position as one of the world’s fastest growing energy sources [2]. Besides, the wind climate in Taiwan, including the Asia monsoon and tropical cyclones during the summer season and the northeast trade winds during the winter season, induces high winds in many places. As a result, among various renewable energy sources in Taiwan, wind energy could be in the short term one of the most promising renewable energy sources. It could provide a much greater proportion of energy production in places with good wind.
Academic attempts regarding the evaluation of wind energy potential for different regions by using various probability distribution functions have been carried out by some researchers. Most of the researches have indicated that the Weibull wind speed distribution is accurate for wind energy estimation [3]. Jamil et al. [4] developed an evaluation method to estimate wind energy density and other wind characteristics in Iran based on the two-parameter Weibull wind speed distribution. Rosen et al. [5] used two kinds of the Weibull distributions to analyze wind potential energy of two windy sites located in the coastal region of Red Sea. Eritrea. Li [6] and Lu et al. [7] conducted mathematical investigations using the two-parameter Weibull wind speed distribution to examine wind power potential and wind turbine characteristics in Hong Kong. Recently, Mathew et al. [8] presented an analytical approach to study the wind energy density, energy available in the wind spectra, and the energy received by turbine by using the Rayleigh wind speed distribution. Jangamshetti and Rau [9] and Balouktsis et al. [10] addressed a statistical model and nomogram
method to investigate wind turbine characteristics for various wind turbine generators by using the same sets of wind data at Kappadgudda wind power station, India.
The above studies either investigated wind characteristics (wind speed and wind energy density) only, or focused on part of wind turbine characteristics of a given wind turbine generator such as the capacity factor. For example, for a very large rotor together with a very small generator, a wind turbine would run at full capacity and thus achieve a very high capacity factor. But it could produce very little elec-tricity, resulting in low wind turbine efficiency. In such a situation, considering only the capacity factor cannot provide overall information on wind turbine characteristics. To understand in depth wind turbine characteristics of a given generator for different locations, three types of wind turbine characteristics (the availability factor, the capacity factor and the wind turbine efficiency of a chosen wind turbine) are addressed and investigated. A two-stage procedure for estimating wind resources in Taiwan is firstly evaluated. The monthly wind speed distributions, wind power den-sities, and aforementioned wind turbine characteristics are next studied and used to map out the general availability of wind energy potential across Taiwan.
2. Mathematical formulation
There are several continuous mathematical functions, or called the probability den-sity functions, that can be used to model the wind speed frequency curve by fitting time-series measured data. In wind power studies, the Weibull and Rayleigh prob-ability density functions are commonly used and widely adopted [3]. Herein the Weibull distribution is used since the Rayleigh distribution is only a subset of it.
2.1. Weibull distribution of wind speed
The Weibull probability density function is a special case of a generalized two-parameter Gamma distribution. Weibull distribution can be characterized by its prob-ability density function f(V) and cumulative distribution function F(V) as follows:
f(V)⫽k c( V c) k⫺1e⫺(V/c)k (1) and F(V)⫽ 1⫺e⫺(V/c)k (2)
where c is the scale parameter, k is the shape parameter, and V is wind speed. The scale and shape parameter can be estimated by using the maximum likelihood method [11] as suggested in the following iterative Eqs. [11]
k⫽
冉
冘
n i⫽ 1 Vk iln(Vi)冘
n i⫽ 1 Vk i ⫺冘
n i⫽ 1 ln(Vi) n冊
⫺1 (3)c⫽
冉
1 n冘
n i⫽ 1 Vk i冊
1/k (4) where Vi is the wind speed in time stage i and n is the number of non zero windspeed data points.
As the scale and shape parameter have been calculated, two meaningful wind speeds for wind energy estimation, the most probable wind speed and the wind speed carrying maximum energy, can be easily obtained. The most probable wind speed denotes the most frequent wind speed for a given wind probability distribution and is expressed by VMP⫽ c
冉
k⫺1 k冊
1/k . (5)The wind speed carrying maximum energy represents the wind speed which carries the maximum amount of wind energy, and is expressed as follows [4]:
VMaxE⫽ c
冉
k⫹ 2 k
冊
1/k
(6)
2.2. Wind power density
It is well known that the power of the wind that flows at speed V through a blade sweep area A increases as the cubic of its velocity and is given by
P(V)⫽1
2rAV
3
(7) wherer is fluid density. Wind power density of a site based on a Weibull probability
density function can be expressed as follows [3,4]:
P A⫽
冕
⬁ 0 P(V)f(V)dV⫽1 2rc 3⌫冉
k⫹ 3 k冊
(8)where ⌫ denotes the Gamma function. Once wind power density of a site is given, the wind energy density for a desired duration (a month or a year) can be expressed as
E A⫽ 1 2rc 3⌫
冉
k⫹ 3 k冊
T (9)where T the time period (or duration). For example, T is 720 hr for monthly duration.
2.3. Wind energy generated by an ideal wind turbine
A wind turbine is basically designed to convert wind energy to electrical energy. For an ideal wind turbine, the wind energy available in the wind can be completely
extracted so that the turbine rotor starts to function at cut-in speed VI and power
generated increases as wind speed increases until it reaches the rated wind speed
VR. At wind speeds between the rated wind speed and cut-off wind speed VO, a
constant rated power is generated corresponding to the rated wind speed by PR⫽
1 / 2rAV3
R. At wind velocities exceeding cut-off wind speed, the turbine is completely
shut down. As a result, the wind energy generated by an ideal wind turbine operated at an increasing relation of power between cut-in and rated wind speed and a constant rate power PRbetween rated and cut-out wind speed can be given by
ETW⫽ T
冕
⬁ 0 P(V)f(V)dV ⫽ T(冕
VR VI P(V)f(V)dV⫹冕
VO VR PRf(V)dV) (10)Substituting P(V)⫽ 1/2rAV3 and a constant rated power generated by an ideal
wind turbine PR⫽ 1/2rAV3Rinto Eq. (10) yields
ETW⫽ r 2TA
冉冕
VR VI V3k c冉
V c冊
k⫺1 e⫺(V/c)kdV⫹ V3 R冕
VO VR k c冉
V c冊
k⫺1 e⫺(V/c)kdV冊
(11)The integrals in Eq. (11) cannot be analytically solved, but they can be easily calculated by any typical numerical integration techniques such as Simpson’s rule or Gauss quadrature. Herein the six-point Gauss-Legendre quadrature is used.
2.4. Actual wind energy output from a wind turbine
The power in the wind is converted into the mechanical-rotational energy of a wind turbine rotor, which would reduce the speed of the air mass. The wind energy available in the wind cannot be extracted completely by any real wind turbine, as the air mass would be stopped completely in the intercepting rotor area. For wind turbine machines that operate at constant power PR with maximum efficiency
between rated and cut-out speed and at increasing power between cut-in and rated speed, the actual wind power output from the wind turbine PT is determined by the
turbine performance curve, which is well described by the following expression.
PT(V)⫽
冦
0 (a1V3 ⫹ a2V2⫹ a3V⫹ a4)PR PR 0 , , , , V⬍ VI VIⱕV ⬍ VR VRⱕV ⬍ VO VⱖVO , (12)where a1, a2, a3, and a4 are regression constants of the turbine performance curve.
It should be noted that using a cubic function in Eq. (12) is only for regression purpose. It is desirable to use other polynomial functions to fit the turbine
perform-ance curve. Taking the Vestas V47-660 KW turbine [12] as example, Fig. 1 depicts the performance curve of this turbine, in which the rate power is PR⫽ 660 KW.
This turbine has a rotor diameter of 47 m (the blade sweep area A⫽ 1,735 m2) and
a hub height of 45 m. The cut-in, rated, and cut-off speed are 4 m/s, 15 m/s, and 25 m/s, respectively. The regressed values of a1, a2, a3, and a4 in Eq. (12) are ⫺
0.00169, 0.04446, ⫺0.24764, and 0.39209, respectively.
Combining Eqs. (1), (7) and (12) yields the actual wind energy output from a wind turbine in the following, which is the output electrical power at each wind speed PT(V) multiplied by the probability of the wind speed experienced f(V) and
integrated over all possible wind speeds.
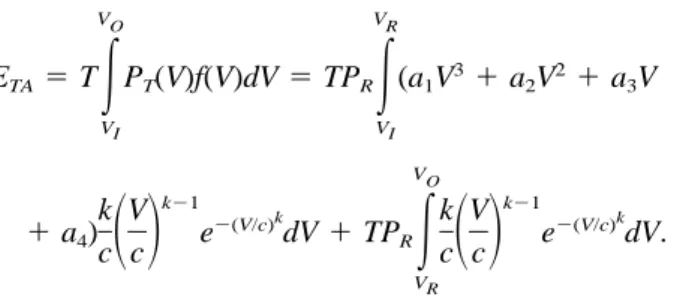
ETA⫽ T
冕
VO VI PT(V)f(V)dV⫽ TPR冕
VR VI (a1V3⫹ a2V2⫹ a3V (13) ⫹ a4) k c冉
V c冊
k⫺1 e⫺(V/c)kdV ⫹ TPR冕
VO VR k c冉
V c冊
k⫺1 e⫺(V/c)kdV.The integrals in Eq. (13) are also calculated by the six-point Gauss-Legendre quad-rature. The typical wind-speed probability densities of Taiwan in January and August are also plotted in Fig. 1. The wind energy integration in Eq. (13) can be clearly seen in Fig. 1, which reveals that the actual wind energy produced in August is more than in January.
2.5. Wind turbine efficiency, capacity factor, and availability factor of a wind turbine
Since the wind energy available in the wind cannot be completely extracted by any wind turbine, the wind turbine efficiency h, defined as the ratio of the actual
Fig. 1. The performance curve of the Vestas V47-660 KW turbine and typical wind-speed probability densities in January and August in Taiwan.
wind energy output from a wind turbine to the wind energy generated by an ideal wind turbine, is meaningful for evaluating turbine performance and can be expressed as the ratio of Eq. (13) to Eq. (11).
h⫽ ETA
ETW
. (14)
It can be seen from Eqs. (11), (13) and (14) that the wind turbine efficiency is not only a function of wind turbine performance, but also a function of wind speed distribution. The wind turbine efficiency enables us to figure out the relationship between energy available in the wind and how much energy a turbine can transfer. It is important to note that the theoretical optimum for utilizing the power in the wind by reducing its speed was first discovered by Betz in 1926, as shown in many wind energy textbooks [2,3]. According to Betz, under the assumption that the tur-bine swirl and transmission losses were neglected, the theoretically maximum power that can be extracted from the wind is 59% of the wind power available in the wind. Therefore, for any wind turbine, the wind turbine efficiency h should not
exceed 0.59.
On the other side, the capacity factor is also an important index in measuring the productivity of a wind turbine. It compares the actual power production of a turbine over a given duration with the amount of power of the turbine operated at maximum output 100% of the same amount of duration. A wind turbine operating with the full capacity for a duration T can produce so called the rated wind energy as follows:
ETR⫽ TPR. (15)
Dividing the actual energy production of a wind turbine by the rated wind energy yields the capacity factor as
CF⫽ ETA ETR ⫽
冕
VR VI (a1V3 ⫹ a2V2 ⫹ a3V⫹ a4) k c( V c) k⫺1e⫺(V/c)kdV (16) ⫹冕
VO VR k c( V c) k⫺1e⫺(V/c)k dVThe availability factor is defined as a measurement of the operation percentage of a wind turbine. It refers to the percentage of time that a wind turbine is operating, which depends on wind turbine characteristics and wind energy potential. For a wind turbine having the cut-in speed VIand cut-off speed VO, the availability factor AFis
the probability of P(VIⱕV ⬍ VO), which can be calculated using the following
equ-ation. AF⫽ P(VIⱕV ⬍ VO)⫽
冕
VO VI k c冉
V c冊
k⫺1 e⫺(V/c)kdV (17)In general, the availability factor increases as the decrease of the cut-in wind speed of a wind turbine and the increase of the cut-off wind speed and mean wind speed. Most modern wind turbines have high values of the availability factor. However, much of the time it can be utilizing part of the power in the wind and it will be generating at less than full capacity, which is determined by the other two factors, i.e., the wind turbine efficiency and the capacity factor.
For example, with a very large rotor and a very small generator, a wind turbine would run at full capacity in such a way that its capacity factor remains high. But it could produce very little electricity, resulting in low wind turbine efficiency. On the contrary, for the same rotor together with a very large generator, the capacity factor will be lower as a result but the wind turbine efficiency could be higher. Consequently, to completely describe wind turbine characteristics, the availability factor, the capacity factor, and the wind turbine efficiency of a specific wind turbine should be considered together. Table 1 gives the wind energy characteristics for two-parameter Weibull distribution and all of the wind turbine characteristics used in the present study.
3. Case study of wind characteristics and wind turbine characteristics
Taiwan is located in the East Asia subtropical zone with an area of 36,000 km2.
The Central Mountains are across Taiwan from north to south with average elevation of 1500 m. The wind regime of Taiwan during a year is largely characterized by the same mechanisms, including the Asia monsoon and tropical cyclones during summer and fall seasons, the northeast trade winds during winter and spring, and local convergence of the wind environment due to the Central Mountains. The Asia monsoon climate is predominant with southern or southwestern winds from May to October, whereas strong trade winds blow with accelerated speeds and wind direction suddenly changing to northeastern during winter and spring season (from November to April). As a combined effect of the aforementioned mechanisms, the patterns of the yearly and monthly mean wind speed over Taiwan are highly variable, both spatially and temporally. In addition, the tropical cyclone season comes during the period May to November, in which typhoons and tropical cyclones bring extreme wind conditions to possibly shut down a wind turbine.
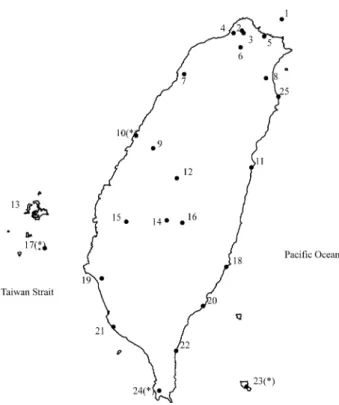
The surface hourly mean wind speed was obtained from Taiwan Central Weather Bureau, which has set up 25 meteorological stations across Taiwan. The geographical locations and details of the 25 meteorological stations used are depicted in Fig. 2 and Table 2, respectively. Most of the meteorological stations have a 39 year data source (1961–1999) of hourly mean wind speed except five relatively new stations having 19–31 year data. As shown in Table 2, anemometer measurements at all 25 stations were taken from different heights from the ground level, which are all differ-ent from the standard height of 10 m above the ground level adopted by the World Meteorological Organization. To transfer the anemometer height to the standard level or other desired heights, the power law equation is herein used.
Table 1
Wind energy characteristics for Weibull distribution and wind turbine characteristics Wind characteristics
Mean wind speed
V⫽ c⌫
冉
k⫹ 1 k冊
Standard deviation of wind speeds⫽ c
冪
冋
⌫冉
k⫹ 2k
冊
⫺⌫2
冉
k⫹ 1k
冊册
Most probable wind speedVMP⫽ c
冉
k⫺1 k
冊
1 / k
Wind speed carrying maximum energy
VMaxE⫽ c
冉
k⫹ 2 k
冊
1 / k
Mean wind power density P
A⫽ 1 2rc
3⌫
冉
k⫹ 3k
冊
Mean wind energy density E
A⫽ 1 2rc
3⌫
冉
k⫹ 3k
冊
T Wind turbine characteristicsWind energy generated by an ideal wind turbine
ETW⫽ r 2TA
冕
VR VI V3k c冉
V c冊
k⫺1 e⫺(V/c)k dV⫹ r 2TAV 3 R冕
VO VR k c冉
V c冊
k⫺1 e⫺(V/ c)k dVActual wind energy output from a wind turbine
ETA⫽ TPR
冕
VR VI (a1V3⫹ a2V2⫹ a3V⫹ a4) k c冉
V c冊
k⫺1 e⫺(V/c)kdV⫹ TPR冕
VO VR k c冉
V c冊
k⫺1 e⫺(V/c)kdVWind turbine efficiency
h⫽ETA
ETW
Rated wind energy ETR⫽ TPR
Capacity factor CF⫽ ETA ETR ⫽
冕
VR VI (a1V3⫹ a2V2⫹ a3V⫹ a4) k c冉
V c冊
k⫺1 e⫺(V/c)kdV⫹冕
VO VR k c冉
V c冊
k⫺1 e⫺(V/c)kdV Availability factor AF⫽ P(VIⱕV ⬍ VO)⫽冕
VO VI k c冉
V c冊
k⫺1 e⫺(V/ c)kdVFig. 2. Geographical locations of the meteorological stations used in the present analysis. V(z) Vd ⫽
冉
Z d冊
a (18) where V(z) is wind speed estimated at desired height z, Vdis wind speed at boundarylayer heightd, and a is the power law index. The values of a and d for each station
can be also obtained in Table 2, which were estimated by Taiwan Central Weather Bureau based on local topographic conditions surrounding the stations.
From the next section, a two-stage evaluation procedure for estimating wind resource across Taiwan is carried out. The first stage is to analyze the yearly wind speed distribution as well as wind power density for the entire Taiwan. The monthly wind characteristics and wind turbine characteristics are further investigated at four high-wind meteorological stations to provide more detailed information of wind resources.
3.1. Yearly wind characteristics of the entire Taiwan
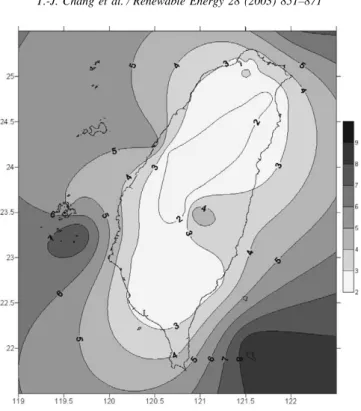
Based on a long-term measured data source (1961–1999) of hourly mean wind speed at 25 meteorological stations across Taiwan, the yearly wind characteristics across Taiwan, including the wind speed distribution and wind power density distri-bution at 10 m above the ground level, are obtained as shown in Figs. 3 and 4.
Table 2
Details of the meteorological stations used in the present analysis
No. Station Years of wind Elevation Anemometer Geographical a d
data available from MSL height (m) coordinates
1 Pengchiayu 1961–1999 101.7 12.5 122°04⬘E, 0.110 233 25°37⬘N 2 Anpu 1961–1999 837.6 7.31 121°31⬘E, 0.110 233 25°11⬘N 3 Chutzehu 1970–1999 607.1 11.03 121°32⬘E, 0.250 400 25°09⬘N 4 Tanshui 1961–1999 19.0 12.20 121°26⬘E, 0.150 300 25°09⬘N 5 Keelung 1961–1999 26.7 34.60 121°43⬘E, 0.250 400 25°08⬘N 6 Taipei 1961–1999 5.3 34.90 121°30⬘E, 0.250 400 25°02⬘N 7 Hsinchu 1961–1999 26.9 15.60 120°58⬘E, 0.194 350 24°48⬘N 8 Ilan 1961–1999 7.2 26.00 121°44⬘E, 0.150 300 24°45⬘N 9 Taichung 1961–1999 84.0 17.20 120°40⬘E, 0.250 400 24°08⬘N 10 Wuchi 1976–1999 7.2 33.20 120°30⬘E, 0.130 267 24°15⬘N 11 Hualien 1961–1999 16.1 12.00 121°36⬘E, 0.173 321 23°58⬘N
12 Sun-moon lake 1961–1999 1014.8 8.00 120°53⬘E, 0.150 300 23°52⬘N 13 Penghu 1961–1999 10.7 14.60 119°33⬘E, 0.150 300 23°34⬘N 14 A-li-shan 1961–1999 2413.4 15.10 120°48⬘E, 0.110 233 23°30⬘N 15 Chiayi 1969–1999 26.9 14.50 120°25⬘E, 0.167 313 23°29⬘N 16 Yushan 1961–1999 3844.8 9.20 120°57⬘E, 0.150 300 23°29⬘N 17 Tungchitao 1970–1999 43.0 9.10 119°39⬘E, 0.125 260 23°15⬘N 18 Chengkung 1961–1999 33.5 12.80 121°21⬘E, 0.144 245 23°05⬘N 19 Tainan 1961–1999 8.1 37.60 120°11⬘E, 0.218 378 22°59⬘N 20 Taitung 1961–1999 9.0 11.40 121°08⬘E, 0.150 300 22°45⬘N 21 Kaohsiang 1961–1999 2.3 14.00 120°18⬘E, 0.105 300 22°34⬘N 22 Tawu 1961–1999 8.1 12.70 120°53⬘E, 0.244 407 22°21⬘N 23 Lanyu 1961–1999 324.0 12.50 121°33⬘E, 0.110 233 22°02⬘N 24 Hengchun 1961–1999 21.9 14.30 120°44⬘E, 0.194 350 22°00⬘N 25 Suao 1981–1999 24.9 34.00 121°51⬘E, 0.150 300 24°36⬘N
Fig. 3. Yearly wind speed distribution of Taiwan (10 m over the ground level, m/s).
These two figures show all the favorable features of the spatial distribution of wind energy potential in Taiwan. According to the results, Taiwan has a significant wind resource in the areas along the western coastline, southern peninsula, and several small surrounding islands. These areas generally have good mean wind speeds and wind energy potential, which are greater than 4 m/s and 200 W/m2. On the contrary,
the inland parts and the eastern coast bands have less wind energy potential of about two-times lower.
3.2. Monthly wind characteristics
As introduced earlier, the patterns of the yearly and monthly mean wind speed across Taiwan have significant spatial and temporal variations due to the combined effect of various mechanisms. The yearly wind characteristics of Taiwan as shown in Figs. 3 and 4 can only give annually spatial mean information, which is merely a partial picture of wind energy potential. To overcome this drawback, four high-wind meteorological stations (the ∗ signs in Fig. 2) have been selected to further study the monthly wind characteristics and monthly wind turbine characteristics. Wuchi (No. 10) is situated in the narrow strip of the western coastline. Hengchun (No. 24) is located at the end of the southern peninsula. Tungchitao (No. 17) and Lanyu (No. 23) are the small surrounding islands in Taiwan Strait and Pacific Ocean,
Fig. 4. Yearly wind power density distribution of Taiwan (10 m over the ground level, W/m2). respectively. The Vestas V47-660 KW turbine (Fig. 1) with a hub height of 45 m is selected as the study turbine.
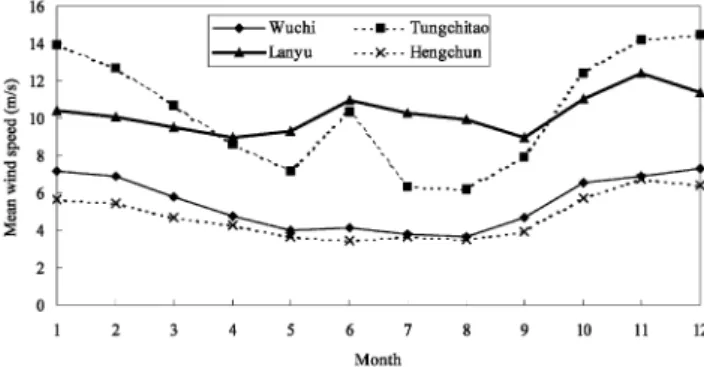
Using the expressions described in Table 2, the monthly wind characteristics of the four high-wind stations are summarized in Figs. 5 and 6 and Tables 3–6. For easy comparison, 30 days are taken for each month. It is clear from these results that these four high-wind locations, situated in different regions of Taiwan, are generally characterized by high mean wind speeds with seasonal regularity. During the period
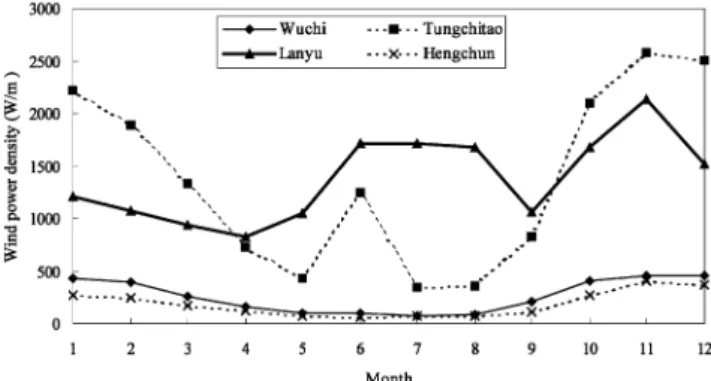
Fig. 6. Monthly mean wind power density for the four high-wind stations studied.
between October and March, owing mainly to the trade winds these regions are associated with strong winds, showing high wind energy potential. In contrast, from April to September (the Asia monsoon season) these regions exhibit relative low wind regimes. Among the four stations studied, Tungchitao and Lanyu possess out-standing wind energy potential compared to the other two stations. Lanyu tends to experience strong and steady winds. The highest mean wind speed 12.41 m/s with the mean wind power density up to 2136 W/m2 is in November, while the lowest
is 8.98 m/s together with 821 W/m2 in April, demonstrating less wind speed
fluctu-ation and more reliable wind energy potential.
3.3. Monthly wind turbine characteristics
In addition to the monthly wind characteristics, the monthly wind turbine charac-teristics in Table 2 are also analyzed. Three fundamental types of monthly wind turbine characteristics, the availability factor, the capacity factor, and the wind tur-bine efficiency of the wind turtur-bine used, are emphasized as shown in Figs. 7–9 and Tables 3–6. Fig. 7 shows that these four high-wind locations have the similar tend-ency of seasonal variation on the availability factor. The availability factor is in the range from 0.658 (August) to 0.986 (December) for Tungchitao, showing good oper-ation percentage. For Hengchun, the highest is 0.717 in November, while the lowest 0.346 occurs in June, indicating that the cut-in speed of the wind turbine used is too high in this region.
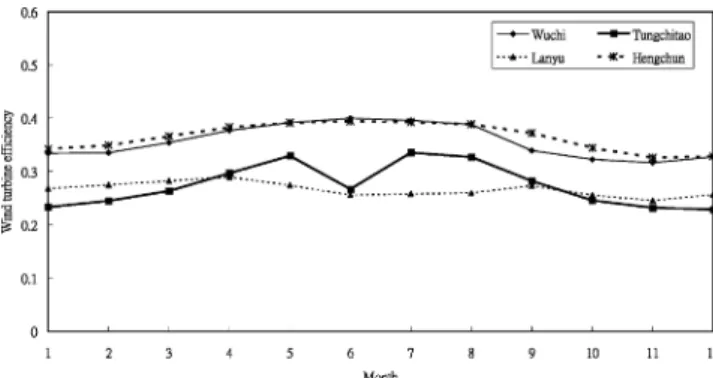
It can be seen from Fig. 8 that Tungchitao and Lanyu, possessing outstanding wind speed and wind power density, as shown in Figs. 5 and 6, still have high capacity factors. The highest and lowest capacity factor is 0.818 in December and 0.266 in August for Tungchitao, and 0.642 in November and 0.450 in September for Lanyu. Fig. 8 also demonstrates that Lanyu has less variation of the capacity factor for the entire year, which is similar to wind power density. The monthly wind turbine efficiency for the four high-wind stations studied has been plotted in Fig. 9. In this figure, an opposite trend can be observed. The regions with high wind speeds like Tungchitao and Lanyu have less wind turbine efficiency than the low wind
Table 3 Monthly wind characteristics and w ind turbine characteristics at Wuchi (No.10) Month Shape Scale Mean wind Most W ind speed Mean wind Wind Actual Availability Capacity Wind parameter parameter speed probable carrying power energy w ind factor factor turbine wind speed maximum density generated energy ef fi ciency energy b y an ideal output wind from a turbine w ind turbine kc (m/s) V (m/s) VMP (m/s) VMaxE (m/s) P/A (W/m 2) ETW (KWh) ETA (KWh) AF CF η January 1.99 8.12 7.19 5.71 11.52 429.42 4.89E + 05 1.64E + 05 0.783 0.344 0 .334 February 1.89 7.78 6.91 5.24 11.38 399.50 4.53E + 05 1.52E + 05 0.753 0.320 0 .336 March 1.71 6.48 5.78 3.88 10.18 262.92 3.04E + 05 1.08E + 05 0.645 0.227 0 .354 April 1.61 5.27 4.73 2.89 8.70 155.44 1.83E + 05 6.89E + 04 0.527 0.145 0 .377 May 1 .58 4.45 4.00 2.36 7.47 96.55 1.12E + 05 4.40E + 04 0.430 0.093 0 .392 June 1.74 4.63 4.13 2.83 7.20 94.22 1.10E + 05 4.38E + 04 0.461 0.092 0 .400 July 1.61 4.21 3.77 2.30 6.95 79.20 9.07E + 04 3.59E + 04 0.398 0.076 0 .396 August 1 .47 4.06 3.68 1.87 7.29 83.58 9.59E + 04 3.73E + 04 0.376 0.078 0 .388 September 1 .31 5.07 4.68 1.68 10.30 208.04 2.23E + 05 7.57E + 04 0.480 0.159 0 .340 October 1 .63 7.28 6.52 4.06 11.90 402.04 4.26E + 05 1.38E + 05 0.686 0.290 0 .323 November 1 .67 7.70 6.88 4.46 12.34 457.89 4.77E + 05 1.51E + 05 0.715 0.318 0 .317 December 1 .96 8.26 7.33 5.73 11.85 461.24 5.16E + 05 1.69E + 05 0.785 0.356 0 .328
Table 4 Monthly wind characteristics and w ind turbine characteristics at Tungchitao (No. 17) Month Shape Scale Mean wind Most W ind speed Mean wind Wind Actual Availability Capacity Wind parameter parameter speed probable carrying power energy w ind factor factor turbine wind speed maximum density generated energy ef fi ciency energy b y an ideal output ind turbine from a wind turbine kc (m/s) V (m/s) VMP (m/s) VMaxE (m/s) P/A (W/m 2) ETW (KWh) ETA (KWh) AF CF η January 3.12 15.55 1 3.91 13.74 18.22 2218.84 1.66E + 06 3.87E + 05 0.986 0.814 0 .233 February 2.55 14.26 1 2.66 11.73 17.90 1894.74 1.40E + 06 3.43E + 05 0.962 0.722 0 .245 March 2.10 12.05 1 0.68 8.85 16.59 1331.99 1.06E + 06 2.81E + 05 0.906 0.591 0 .264 April 2.00 9.70 8.59 6.87 13.70 725.53 7.31E + 05 2.17E + 05 0.844 0.457 0 .297 May 1 .91 8.05 7.14 5.47 11.70 437.29 4.90E + 05 1.62E + 05 0.769 0.340 0 .330 June 2.04 11.68 1 0.35 8.39 16.33 1245.09 1.01E + 06 2.70E + 05 0.894 0.568 0 .267 July 1.71 7.10 6.34 4.24 11.19 347.95 3.88E + 05 1.30E + 05 0.687 0.274 0 .336 August 1 .59 6.92 6.21 3.71 11.56 359.81 3.86E + 05 1.26E + 05 0.658 0.266 0 .328 September 1 .47 8.74 7.91 4.04 15.66 830.26 6.35E + 05 1.79E + 05 0.729 0.378 0 .283 October 2 .08 13.98 1 2.39 10.21 19.33 2095.77 1.25E + 06 3.07E + 05 0.929 0.647 0 .246 November 2 .68 15.96 1 4.19 13.41 19.64 2575.81 1.57E + 06 3.65E + 05 0.976 0.768 0 .232 December 3 .07 16.16 1 4.45 14.22 19.02 2506.84 1.70E + 06 3.89E + 05 0.986 0.818 0 .229
Table 5 Monthly wind characteristics and w ind turbine characteristics at Lanyu (No. 23) Month Shape Scale Mean wind Most W ind speed Mean wind Wind Actual Availability Capacity Wind parameter parameter speed probable carrying power energy w ind factor factor turbine wind speed maximum density generated energy ef fi ciency energy b y an ideal output wind from a turbine w ind turbine kc (m/s) V (m/s) VMP (m/s) VMaxE (m/s) P/A (W/m 2) ETW (KWh) ETA (KWh) AF CF η January 2.15 11.78 1 0.43 8.81 15.98 1213.01 1.04E + 06 2.78E + 05 0.907 0.585 0 .268 February 2.21 11.41 1 0.10 8.68 15.28 1078.14 9.87E + 05 2.71E + 05 0.906 0.571 0 .275 March 2.11 10.73 9 .50 7.90 14.73 935.64 8.85E + 05 2.50E + 05 0.882 0.526 0 .283 April 2.02 10.14 8 .98 7.23 14.24 821.40 7.97E + 05 2.31E + 05 0.859 0.486 0 .290 May 1 .77 10.46 9 .31 6.55 16.02 1054.05 8.40E + 05 2.30E + 05 0.834 0.485 0 .274 June 1.78 12.32 1 0.96 7.75 18.81 1713.90 1.03E + 06 2.64E + 05 0.874 0.556 0 .256 July 1.54 11.46 1 0.31 5.81 19.67 1721.43 9.03E + 05 2.33E + 05 0.821 0.490 0 .258 August 1 .46 10.96 9 .94 4.94 19.85 1673.39 8.45E + 05 2.19E + 05 0.794 0.462 0 .260 September 1 .62 10.03 8 .98 5.53 16.49 1063.20 7.82E + 05 2.14E + 05 0.798 0.450 0 .274 October 1 .85 12.44 1 1.05 8.17 18.49 1679.17 1.06E + 06 2.71E + 05 0.885 0.571 0 .256 November 2 .05 14.01 1 2.41 10.11 19.52 2135.95 1.24E + 06 3.05E + 05 0.926 0.642 0 .246 December 2 .24 12.85 1 1.38 9.86 17.09 1521.01 1.18E + 06 3.03E + 05 0.929 0.638 0 .257
Table 6 Monthly wind characteristics and w ind turbine characteristics at Hengchun (No. 24) Month Shape Scale Mean wind Most W ind speed Mean wind Wind Actual Availability Capacity Wind parameter parameter speed probable carrying power energy w ind factor factor turbine wind speed maximum density generated energy ef fi ciency energy b y an ideal output wind from a turbine w ind turbine kc (m/s) V (m/s) VMP (m/s) VMaxE (m/s) P/A (W/m 2) ETW (KWh) ETA (KWh) AF CF η January 1.57 6.27 5.63 3.28 10.59 273.40 3.06E + 05 1.05E + 05 0.610 0.220 0 .343 February 1.58 6.08 5.46 3.21 10.22 246.85 2.80E + 05 9.79E + 04 0.596 0.206 0 .349 March 1.52 5.22 4.71 2.56 9.09 167.42 1.94E + 05 7.10E + 04 0.513 0.150 0 .366 April 1.55 4.73 4.26 2.42 8.08 119.92 1.40E + 05 5.38E + 04 0.463 0.113 0 .384 May 1 .51 4.05 3.65 1.98 7.07 78.62 8.99E + 04 3.52E + 04 0.375 0.074 0 .392 June 1.63 3.86 3.45 2.16 6.30 59.68 6.61E + 04 2.61E + 04 0.346 0.055 0 .395 July 1.53 4.06 3.65 2.03 7.00 77.17 8.82E + 04 3.46E + 04 0.376 0.073 0 .393 August 1 .45 3.87 3.51 1.71 7.06 74.63 8.49E + 04 3.30E + 04 0.350 0.070 0 .389 September 1 .37 4.28 3.91 1.66 8.24 112.40 1.29E + 05 4.80E + 04 0.402 0.101 0 .372 October 1 .61 6.39 5.73 3.50 10.54 276.80 3.12E + 05 1.08E + 05 0.625 0.226 0 .345 November 1 .73 7.55 6.73 4.59 11.77 409.84 4.46E + 05 1.45E + 05 0.717 0.306 0 .326 December 1 .67 7.20 6.43 4.16 11.54 374.47 4.08E + 05 1.34E + 05 0.687 0.282 0 .329
Fig. 7. Monthly availability factor for the four high-wind stations studied.
Fig. 8. Monthly capacity factor for the four high-wind stations studied.
regions like Wuchi and Hengchun. This is because the V47-660 KW turbine is operating a constant rated power at wind speeds between the rated and cut-off wind speed. Meanwhile, the energy available in the wind is still proportional to the cubic of wind speed. The wind turbine efficiency is thus decreasing as the wind speed probability distributed between the rated speed and cut-off speed is increasing. As a result, using the V47-660 KW turbine in the high wind regions like Tungchitao and Lanyu is equivalent to using a large rotor with a very small generator. The wind turbine used would run at full capacity with a high capacity factor, but it could produce very little electricity, resulting in low wind turbine efficiency. This infor-mation implies that a wind turbine with more output rated power is more adequate for the regions like Tungchitao and Lanyu, by which the capacity factor is reduced but the wind turbine efficiency is raised.
4. Conclusions
A two-stage evaluation procedure has been carried out to investigate wind charac-teristics and wind turbine characcharac-teristics in Taiwan by means of a 39 year data source (1961–1999) of hourly mean wind speed and a newly developed mathematical formu-lation. The yearly wind speed distribution and wind power density across Taiwan is firstly evaluated to provide basic information of wind resource, which indicates that there exists outstanding wind resource in the areas along the western coastline, south-ern peninsula, and several small surrounding islands. The monthly wind speed distri-butions, the monthly wind power densities, the wind energy generated by an ideal turbine, and the actual wind energy generated by a wind turbine, are further estimated as shown in Tables 3–6. Three fundamental types of monthly wind turbine character-istics (the availability factor, the capacity factor, and the wind turbine efficiency of the wind turbine used) for different high-wind locations are calculated and inte-gratedly assessed to map out wind energy resource in Taiwan. For Lanyu station (No. 23), the availability factor for the entire year varies from 0.794 to 0.929, the wind turbine efficiency for the entire year is located between 0.246 and 0.290, and the capacity factor is in the range between 0.450 and 0.642. The results show the general availability of wind characteristics and wind turbine characteristics across Taiwan.
Acknowledgements
The authors would like to acknowledge the financial support for this work pro-vided by Council of Research and Development, National Taiwan University.
References
[1] ECROC (Energy Commission of the Republic of China), White paper of energy policy of the Repub-lic of China. Taipei, Taiwan, 2000.
[2] Ackermann T, So¨der L. An overview of wind energy-status 2002. Renewable and Sustainable Energy Reviews 2002;6:67–128.
[3] Patel MR. Wind and solar power systems. Florida, America: CRC Press, 1999.
[4] Jamil M, Parsa S, Majidi M. Wind power statistics and an evaluation of wind energy density. Renew-able Energy 1995;6(5):623–8.
[5] Rosen KR, Van Buskirk R, Garbesi K. Wind energy potential of coastal Eritrea: an analysis of sparse wind data. Solar Energy 1999;66(3):201–13.
[6] Li G. Feasibility of large scale offshore wind power for Hong Kong—a preliminary study. Renewable Energy 2000;21:387–402.
[7] Lu L, Yang H, Burnett J. Investigation on wind power potential on Hong Kong—an analysis of wind power and wind turbine characteristics. Renewable Energy 2002;27:1–12.
[8] Mathew S, Pandey KP, Kumar A. Analysis of wind regimes for energy estimation. Renewable Energy 2002;25:81–99.
[9] Jangamshetti SH, Rau VG. Site matching of wind turbine generators: a case study. IEEE Transactions on Energy Conversion 1999;14(4):1537–43.
[10] Balouktsis A, Chassapis D, Karapantsios TD. A nomogram method for estimating the energy pro-duced by wind turbine generators. Solar Energy 2002;72(3):251–9.
[11] Stevens MJM, Smulders PT. The estimation of parameters of the Weibull wind speed distribution for wind energy utilization purposes. Wind Engineering 1979;3(2):132–45.