and Reinforced Epoxy Resins Part
I.
Neat Epoxies
JOVAN MIJOVIC* and KING-FU LIN, Department of Chemical Engineering, Polytechnic Institute of New York, 333 Jay Street, Brooklyn,New York 11201
synopsis
An investigation was conducted of the morphological changes in neat epoxy resins after cure, that is, during cooling and subsequent “annealing” at a temperature below the glass transition. A series of bifunctional and tetrafunctional epoxy formulations were prepared and studied. A simultaneous drive toward thermodynamic equilibrium (homogeneity) and mor- phological inhomogeneity was found to take place in the glassy network. A conceptual model was advanced to explain the time-dependent development of inhomogeneous morphology in the glassy state. After a certain sub-T, annealing time, “morphological equilibrium” is reached while physical aging of the glassy network (decrease in enthalpy and/or free volume) continues to occur. The proposed model, based upon the variation of contractive forces throughout the epoxy network, was corroborated by experimental evidence obtained from calorimetric and viscoelastic measurements and electron microscopy.
INTRODUCTION
Properties of processed polymeric materials depend on their morphology, which is why the latter has generated considerable interest among polymer scientists and engineers over the years. Within the last three decades noteworthy knowledge has been gained about the morphology of semicrys- talline polymers. The same, however, cannot be said for thermosets. The concept of homogeneously cross-linked network has long been used to de- scribe the morphology of thermosets. It is only recently that the idea of inhomogeneous thermoset morphology has gained wider acceptance. Al- though the origin of that idea dates back to the mid 1 9 3 0 ~ , ~ 3 ~ the advocacy of inhomogeneous thermoset morphology has intensified within the last 15
years primarily as a result of convincing evidence obtained from studies on epoxies, phenolics, and polyesters. A brief chronological review of the development of the concept of inhomogeneous thermoset morphology has been given e l ~ e w h e r e . ~ Suffice it to say that, at present, the model of co- existing regions of higher and lower cross-link density is generally recog- nized to describe adequately the morphology of highly cross-linked thermosets.
Although the presence of inhomogeneities in cured thermosets has been experimentally documented, the very process (or mechanism) of formation of inhomogeneous entities has remained unresolved. A fundamental un-
* To whom correspondence should be addressed.
Journal of Applied Polymer Science, Vol. 32, 3211-3227 (1986)
3212
M I J O V I ~
AND
LIN
answered question is
to
what extent the morphology forms during cure andto
what extent during the subsequent postcuring sequence which included cooling and physical aging in the glassy state? Upon cooling, thermoset networks exist in a nonequilibrium state and the tendency of polymer chainsto
reach equilibrium will be reflected in a decrease in free volume and/or enthalpy. But how the network morphology respondsto
physical aging isnot known.
Several years ago we initiated a comprehensive research program in the general area of morphology of neat and reinforced thermosets.
The
primary objective of this (first) part of our report isto
elucidate the role that sub-T,
annealing plays in determining the morphology of neat epoxies.EXPERIMENTAL
The chemical structures of epoxy resins and curing agents used in this study are shown in Table
I. A
bifunctional and a tetrafunctional epoxy resin were studied. The compositions and cure schedules of various formulations are listed in Table11.
TABLE I
Chemical Structures of Epoxy Resins and Curing Agents DGEBA-DETA System:
(a) Typical diglycidyl ether of bisphenol A (DGEBA) resin (Shell's Epon 825)
(b) Diethylene triamine (DETA) curing agent (Aldrich Chemicals) H,N
-
CH, - CH, - NH - CH, - CH, - NH,TGDDM-DDS System:
(a) The principal resin component-tetraglycidyl 4,4 diaminodiphenyl methane (Ciba Geigy's
MY 720) 0 0 / \ / \ H,C - CH - CH, CH2 - CH
-
CH, / CH, - CH - CH, \ N@c.,-(@
\ I H,C - CH - CH, \ / 0 I / 0(b) 4,4 Diaminodiphenyl sulfone (Ciba Geigy's HT 976)
0
TABLE I1
Compositions and Cure Schedules of Various Epoxy Formulations Studied Formulation Curing agent
# Resin phr Cure schedule
1 DGEBA 7-DETA Components mixed at 23°C for 5 min, poured into molds and cured; 24 h/23"C
+
20 h/128"C 2 DGEBA 11.8-DETA Same as formulation 1 3 DGEBA 15-DETA Same as formulation 14 TGDDM 44-DDS Components mixed at 140°C degassed, poured into molds and cured; 3 h/90"C
+
10 h/140"C+
3.5 h/200"CAfter completion of cure, the specimens were put in a desiccator main- tained at 60°C for the bifunctional resin and at 90°C for the tetrafunctional resin. At chosen time intervals, the specimens were removed from the des- iccator and analyzed by dynamic mechanical analysis, differential scanning calorimetry, (DSC) and transmission electron microscopy (TEM). Dynamic mechanical measurements were performed in the DuPont 981 model DMA connected to the 1090 Thermal Analyzer. Tests were run at a heating rate of B"C/min and
at
a n oscillation amplitude of 0.2 mm peak-to-peak. Calor- imetric measurements were made with a DuPont 910 DSC, attached to a1090 Thermal Analyzer. The change in enthalpy (AH) for a given aging time ( t , ) was calculated in accordance to the procedure recently suggested
by Lagasse. This method is more accurate than the standard dynamic DSC runs which can lead to significant errors as eloquently discussed by Lagasse. The method essentially consists of dynamic runs between two isothermal stages; initial and final. The aged sample is scanned first, followed by a n immediate rerun of the same sample. AH is calculated from the net area enclosed by the two DSC traces. One-stage and two-stage carbon-platinum (GPO replicas of fracture surfaces of annealed samples were made in an evaporator at a pressure of less than 5
x
10 - 5 torr. The replica preparation procedure was described in the literature. A JEM-120 transmission elec- tron microscope was used to investigate the fracture surface morphology.RESULTS
AND
DISCUSSION
We shall begin the discussion by focussing our attention to the molecular events which occur in a n epoxy resin from the end-point of the curing sequence (i.e., during cooling and the subsequent "sub-T, annealing"). Nat- urally,
at
the final stage of cure, epoxy resins contain a certain amount of free volume. During the subsequent cooling, the material contracts and the free volume decreases. In the rubbery state, above the glass transition, Brownian motion is rapid and the molecular adjustments are commensurate with the imposed cooling rates.As
the resin contracts with decreasing temperature, the chains will readjust their positions by jumping. These adjustments are considered to be instantaneous in the rubbery state, and hence the material assumes its new equilibrium volume as soon as the temperature has been changed. A schematic plot of typical changes in the3214 MIJOVIC AND LIN
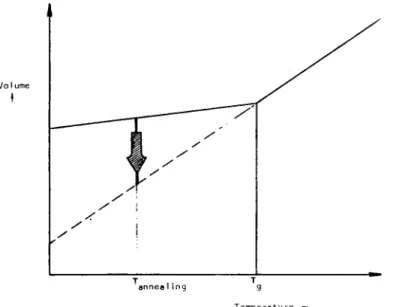
experimentally obtained values of specific volume as a function of temper- ature is shown in Figure 1. As the temperature is decreased and it a p proaches
Tg,
the reduction of molecular mobility causes the slowing down of the free volume collapse. Based upon the concept that the molecular mobility at a given temperature depends primarily on the remaining free volume, one can arrive at the classical WLF equation.6However, when a n epoxy resin is cooled into a glassy state, the molecular mobility is drastically reduced and the molecular relaxations are slowed down significantly as the viscosity increases. Clearly, then, the epoxy net- work in glassy state exists in a thermodynamic nonequilibrium represented by deviation (solid line) from equilibrium (dotted line) in Figure 1. At a given temperature, a certain period of time will be required for the material to contract to its true equilibrium glassy state shown by the dotted line in Figure 1. The nonequilibrium conformation is characterized by a n excess free volume (or excess enthalpy). With time, a drive toward equilibrium, often referred to as “physical aging,” initiates within the network. This phenomenon has been studied for years in glassy thermoplastic^,^-'^ but it was not until recently that it has come under investigation in glassy ther- mosets and their composites. At present, however, there is no comprehensive study in the literature dealing with the fundamental aspects of physical aging in thermosets. Several available reports 1 5 - ~ are purely qualitative
and offer little information about the molecular aspects of physical aging.
The gradual decrease of free volume during sub-T, annealing has an effect on the glass transition and the
P
transition temperature of epoxy resins and that effect was first investigated by dynamic mechanical analysis. In order to establish a starting point or baseline for our analysis, in Figure 2 we show a dynamic mechanical spectrum of the “ascured” (non-aged) formulation 2. Two large peaks are seen in the loss modulus curve shown in this figure. The a peak represents the glass transition, which is hereafterVo I ume
1
T a n n e a ~ i n g I
T e m p e r a t u r e
-
-1..
. ' a m (1..
defined by the location of the loss modulus (a peak) in the dynamic me- chanical spectrum (T, = 141°C in Fig. 2). A big and broad /3 transition, with a peak value at -36"C, is also observed and is related to the relaxation of the glyceryl portion in the cross-linked structure. It has been suggested that
P
relaxation is influenced by the changes in environment around the glyceryl portions in the network and is dominated by the lower cross-link density matrix. 21Changes in the glass transition temperature of various formulations as
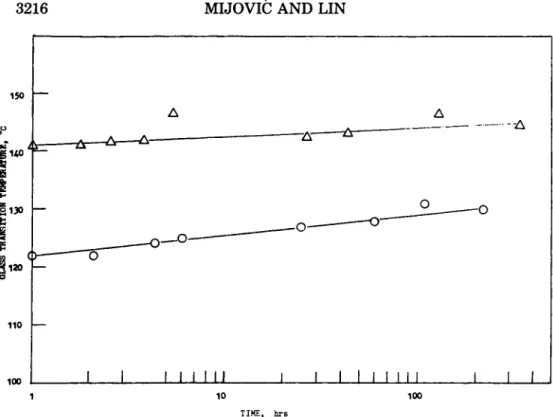
a function of annealing time
at
60"C, are shown in Figure 3. The observed dependence can be described by the following equation:where T, and
T,
are the glass transition temperatures of epoxy resin prior to and after aging at 60"C, respectively, andk,
is the slope of the curve. Equation (1) indicates that the glass transition temperature of epoxy resin increases linearly with the logarithm of the sub-T, annealing time. Figure 3 also shows that the ascured epoxy resin containing 7 phr DETA has a glass transition temperature approximately 20°C lower than the formula- tion containing 11.8 DETA (stoichiometric ratio). At the same time, how- ever, the former has a higher relative increase in Tg as a function of annealing time.The change in
P
transition temperature of various bifunctional formu- lations during annealing at 60°C is shown in Figure 4 and can be described by the following equation:1
AT, = T, - T,, = -In t for t 2 1
k
TBwhere T,, and T, are
P
transition temperatures of the nonaged and aged resin, respectively, andk,
is the slope of the curve shown in Figure 4.3216 MIJOVIC AND LIN
1 10 100
Fig. 3. Glass transition temperature of epoxy resin, as a function of sub-T, annealing time
TIHE, hrs
at 6 O Q Ce, formulation 2, (0) formulation 1.
-60 I I I I I 1 1 1 1 I I I I I I I l l I I
1 10 100
TIHE. hrs
Fig. 4. B transition temperature of epoxy resin as a function of subT, annealing time at
Equation (2) indicates that the
fi
transition temperature of epoxy resin increases linearly with the logarithm of annealing time. Figure 4 alsoshows
that the ascured formulation 2 has the highest
fi
transition temperature, whereas the epoxy resin with 15 phr of curing agent (formulation3)
has highestK,
value (i.e., the highest tendency for increasein
TB
during annealing).We next turn our attention
to
the intricacies of the loss modulua response in various formulations and the changes during annealing in relationto
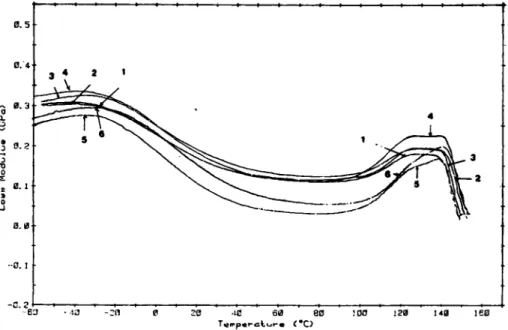
the resin morphology. Most interesting results were observed. When the curing agent concentration was increasedto 15
phr, whichis above the
stoichiometric ratio, the Tg peak in loss modulus spectrum of the ascured specimen became broad as seen in curve 1 of Figure 5.As
the annealing continued, this peak first became broader (curves 2 and 3) and then split into two peaks designatedat
T i and T:, as shown in curve 4. With still further annealing, the lower of the two peaks,T; shifted
toward (curve 5 ) and finally merged with the other one, resulting in one broad peak,as
shown in curve 6 of Figure 5. The entire time span for the observed changes was of the order of several weeks.In general, there are two events that could occur in the
resin
network during subT, annealing; one is physical aging, the other is chemical aging (e.g., further crosslinking). In orderto
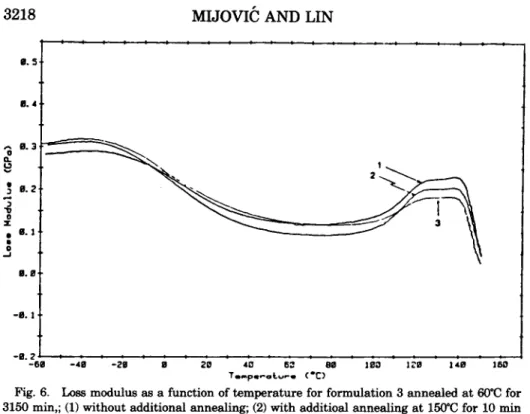
prove that the split of the glass transition peak shown in Figure 5 was not caused by the chemical aging during annealing, the reversibility of dynamic mechanical spectra of an- nealed samples was investigated.For
that purpose, a specimen, annealedat
60°C for 3,150 min, was tested in the dynamic mechanical analyzer.Its
original loss modulus spectrum is shown in curve 1 of Figure 6. The splitting of the glass transition peak is seen in this figure. Immediately after the0 . 5 0. 4 A 0 . 3 L L 8 $ R.2 3 0 5 I 0 J A 0. I
Fig. 5. Loas modulus as a function of temperature for annealed formulation 3 with sub- T, annealing time at 60°C as a parameter; (1) 15 min, (2) 120 min, (3) 230 min, (4) 650 min,
3218
M I J O V I ~
AND LIN
- 0 . 2 ' : - - - : - - - 1 : .
Fig. 6. Loss modulus as a function of temperature for formulation 3 annealed at 60°C for 3150 rnin,; (1) without additional annealing; (2) with additioal annealing at 150°C for 10 min
and quenching to -60°C; (3) same as (2) with yet another additional annealing at 150°C for 10
min and quenching to -60°C.
-60 -40 -28 8 20 4 0 63 00 100 120 I40 I60
T..-pr-oturr c-c)
run, the specimen was brought to 150°C (which is above the
T,
of the specimen) inside the testing chamber and maintained there for 10 min, in order to remove the effect of previous aging. The specimen was then quenched to -60°C and rerun in the dynamic mechanical analyzer. The resulting trace is shown in curve 2 of Figure 6. It can be seen that the splitting tendency of the glass transition peak in the loss modulus spectrum was significantly reduced and the/3
transition peak shifted to lower tem- perature after the specimen had been exposed to 150°C for 10 min. Then, the same specimen was once again brought to 150"C, kept there for 10 min, quenched to -60°C and tested. The result is shown in curve 3 of Figure 6.The split of the glass transition peak in curve 3 is now barely detectable and the
/3
transition peak remains at low temperature. The differences between curves 1, 2, and 3 are subtle but reproducible.A
comparison be-tween Figures 5 and 6 shows that both the split of the glass transition peak and the change in /3 transition temperature, which occur during the sub-
T,
annealing, can be recovered (i.e., are reversible) by heating and main- taining the sample above the glass transition temperature for a period of time. For instance, curve 1 of Figure 5 and curve 3 of Figure 6 are identical. Hence, the split of the glass transition peak does not result from a n irre- versible process (like crosslinking), but from a reversible one (i.e., physical aging). We emphasize here that, although dynamic mechanical spectra of formulation 3 aged for more than several weeks cease to change, physical aging (decrease in free volume and/or enthalpy) continues to occur. This was confirmed by the results of calorimetric measurements of samples an- nealed at 60°C for various times, shown in Figure 7. Our results show that both the decrease in enthalpy(AH)
and the temperature-at-peak of theI
A
A
I
A
A
1 . 51
A H
c.119 1 . 5 0 5A
A
A
0 0A
0 O O T”I “C 125 I I ( 7 1 II
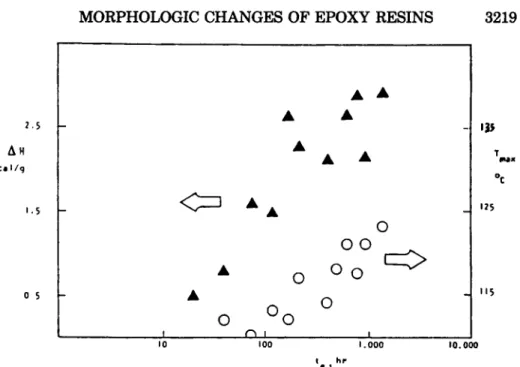
10 I00 I . 000 10.000 ‘e I hrFig. 7. Changes in enthalpy (W and peak temperature of the endotherm (T,) as a function of logarithm of aging time ( t , ) for formulation 2 aged at 60°C.
endotherm
(T,)
increase as a function of logt , ,
albeit not in a clearly linear fashion. But should they?No
theory has been advanced to predict such behavior in thermosets. Moreover, the limited available results contain onlya few data points and are not convincing. For instance, the “apparently linear” correlationm between
AH
and logt,
could be more appropriately described by a n exponential function. But the essential point here is a fundamental question which has not been addressed in the literature thus far. Is it possible to monitor the true physical aging in all epoxy networks?Let us briefly elaborate on this suggestion. In order to eliminate any possible effects of chemical aging (e.g., additional reactions), one must assure the completion of chemical reactions during cure and produce the “fully cured” network. But the fact is that the epoxy networks are inhomogeneous and even curing
at
T
>
T,
00 will not necessarily cause each and every functionalgroup to react. Diffusion control in the latter stages of cure and the inherent steric hindrance throughout the network preclude 100% conversions. We emphasize that, whereas in aminecured bifunctional resins a n essentially fully cured state is attainable, this is certainly not the case in tetrafunc- tional epoxy formulations where, regardless of the applied cure schedule, additional reactions are possible during subsequent aging. The thermorev- ersibility of these systems, claimed by for example the unchanged DSC thermograms of requenched samples does not a priori exclude the possibility of chemical reactions during aging as we have recently shown.22 Two un- reacted groups can be brought close together by the timedependent decrease in free volume and reaction may ensue. Of course, prolonged cure at
T
>
T,
00 will diminish but never extinguish the number of unreactedgroups, and, more importantly, will also cause degradation. One should be particularly careful in addressing this question. We now continue with the discussion of our results.
3220
MIJOVI~ AND
LINThe observed split of the glass transition peak (Fig. 5 ) is believed to be
due to the enhancement of the difference between the higher and lower cross-link density regions in the resin network, which occurs during the subT, annealing. Thus, T,‘ represents the glass transition temperature of the lower cross-link density matrix, while Tg” represents that of the more highly cross-linked regions. The broadening of the glass transition peak occurs over a range of approximately 20°C. Moreover, looking at Figure 3 one sees that the difference in Tg’s of formulations 1 and 2 is also on the order of 20°C. Apparently, the mean cross-link densities of formulations 1 and 2 correspond (at least qualitatively) to the low and high cross-link density regions of formulation 3 (curve 4 in Fig. 5). We shall now offer an explanation of the observed changes in dynamic mechanical properties in terms of the network morphology.
We believe that the starting point for the development of the epoxy morphology during aging is an already present inhomogeneously cross- linked network formed during the curing stage. In general, there are several factors that can contribute to the formation of an inhomogeneous resin network during cure. They are:
1. Steric factors related to the configuration and conformation of chains in the resin network during curing. Due to those steric factors, chemical reactions between the functional groups become impossible at certain lo- cations throughout the resin network.
2. The intensity of mixing during the preparation of the epoxy-curing agent formulation. The inhomogeneity of the resin network can be a func- tion of the intensity of mixing. For instance, it was reportedz3 that the inhomogeneity of DGEBA-DETA epoxy resins can be reduced by improved mixing obtained with the aid of a n electric field applied between the cyl- inders of the mechanical mixer. Naturally, mixing on the molecular level, particularly in any large scale use of epoxy resins, is difficult to achieve.
3. The tendency of coagulation of the curing agents in the mixed resin- curing agent formulations. This factor becomes important when the at-
traction between dissimilar molecules is smaller than that between the same type of molecules and also when the pot life of mixed formulation is long.
4. The curing agent concentration. For instance, in our earlier TEM studies3 we have observed the variation in size of inhomogeneities as a function of curing agent concentration. This variation in size is a n unam- biguous proof for the existence of inhomogeneities. All investigated TEM- replicas were made in identical fashion and consequently the variation in the size of inhomogeneities can be accounted for only i f they are indeed the intrinsic structural features of cured epoxies.
All of the above described factors indicate that the existence of inhom- ogeneities in the resins network is inevitable. What is not known, however, is the exact mechanism of formation of inhomogeneities and particularly their character during the molecular relaxations in the glassy state. The initial formation of inhomogeneities during cure (although not explicitly studied in this work) probably starts from many spots throughout the residcuring agent mixture. On the other hand, changes in the network
morphology during cooling and sub-T, annealing have been monitored in this study and we shall proceed now to describe a series of interesting observations.
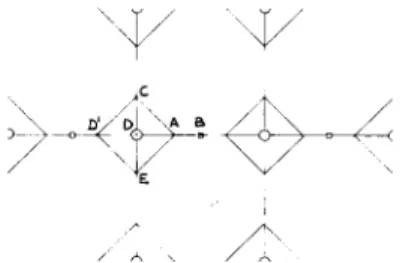
The previously described state of thermodynamic nonequilibrium of glassy networks is the driving force for decrease in enthalpy and mor- phological rearrangements during sub-T, annealing. Also, during cooling, internal stresses are formed in the network,24 the magnitude of which is greater below the glass transition then in the rubbery state. Therefore, contractive forces will be present in the glassy resin network until the material reaches its equilibrium state. The time scale for this process, of course, greatly depends on how far removed is the sample from the glass transition temperature. In order to describe the distribution of existing contractive forces in a n inhomogeneous thermoset network, caused by an instantaneous change of temperature (quench to glassy state), we shall use a two-dimensional schematic of the resin morphology shown in Figure 8. The squares in this figure (e.g., CDEA) represent loci of higher cross-link density. They are connected by molecular segments that pass through the regions of lower cross-link density (e.g., point B).
Let us assume that the whole structure is quenched to below the glass transition temperature and that its instantaneous ( t =0) shrinkage is neg- ligible. The circles in Figure 8 denote the symmetric points in the structure and are assumed to be fixed. If the chain segments have lengths as specified in Figure 8, then the instantaneous contractive force (due to temperature change) in
AD
direction in comparison with that inAB
direction will be(3) F , f ~ c o s 4 5 0 + f ~ + f ~ c o s 4 5 0 l + l + l = 3 - - - - - F ,
f i i
1where F and F are the total contractive forces in
AB
andAD
directions, respectively; and f E, fz,
fG,
and fAE
are the contractive forces contrib- uted by the chain segments specified asAB,
m,
AD,
andAE,
respectively. It follows from the schematic of Figure 8 that the higher cross-link density regions must possess higher tendency to shrink toward their centers (sym- metric points), and will not be significantly influenced by the contractive forces of the lower cross-link density matrix. Hence, the highly cross-linked regions will contract toward their own equilibrium state. On the other hand, the shrinkage of the entire structure encompasses the movement of the/ A
,.
\/
:
Fig. 8. A simplSied morphological scheme of our concept of an inhomogeneous thermoset network.
3222 M I J O V I ~ AND LIN
symmetric points toward the equilibrium configuration of the entire struc- ture. Apparently, that process (the movement of the entire structure) is more difficult and tardy (time dependent). According to our concept, the highly cross-linked regions in the network should shrink (into roughly spherical entities) faster than the overall sample shrinkage to its equilib- rium volume. As a result of this phenomenon, the difference in cross-link density between the spherical inhomogeneities and the matrix will be ac- centuated during the first stage of sub-T, annealing. We then proceeded to test this hypothesis by utilizing various experimental techniques.
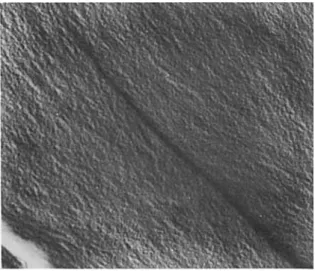
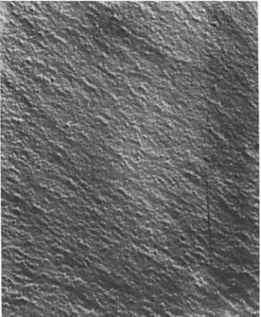
Let us look first into the changes in morphology of the epoxy network during sub-T, annealing as observed by transmission electron microscopy. Figure 9 shows a two-stage GPt replica of a fracture surface of formulation 2. An inhomogeneous morphology is apparent. The structure seen in the two-stage replica. Figures 10 and 11 show GPt replicas of formulation 2
annealed
at
60°C for 24 h and 336 h, respectively. It is clearly seen by comparing the morphologies in Figures 9,10 and 11 that the nodular struc- ture continues to develop (i.e., becomes more pronounced during annealing. It is worth noting here that Fava= has also stated that the rearrangements in the cross-linked network take place during prolonged cure (especially after the measurable heat of reaction has ceased), resulting in a higher degree of order in the glassy state.According to our model, the rearrangement of morphology of the epoxy network (Figs. 9-11) during sub-T, annealing, is believed to result from the higher contractive forces within the highly cross-linked regions which thus exhibit a higher tendency to shrink toward their force centers than the entire structure. We now proceed to address two important questions:
(i) how much the highly cross-linked regions shrink, and (ii) how that affects the morphological rearrangements during annealing? In attempting to an-
swer those questions, let us first assume that the shrinkage of highly cross- linked regions toward their own force centers is instantaneous (time inde-
Fig. 9. Transmission electron micrograph of a two-stage GR replica of fracture surface of an es-cured formulation 2. Magnification 73,000.
Fig. 10. Transmission electron micrograph of a two-stage GF’t replica of fracture surface
of formulation 2 annealed at 60°C for 24 h. Magnification 73,000.
pendent) and can proceed to equilibrium (below T,) along the dotted line of Figure 1. We now define the percentage of shrinkage (S) of highly cross- linked regions in going from the glass transition temperature, T,, to the sub-T, annealing temperature, Tmn. This percentage of shrinkage can be
calculated by the following equation:
S(%) =
(V,,
-Vmn)/VTB
= (1 - e - = q (Tg - T-))x
100 (4)where aeq is the thermal expansion coefficient of the epoxy resin in the equilibrium state (which is assumed to be equal to the extrapolated value
Fig. 11. Transmission electron micrograph of a two-stage CR replica of fracture surface of formulation 2 annealed at 60°C for 336 h. Magnification 73,000.
3224 M I J O V I ~ AND LIN
of the thermal expansion coefficient of epoxy resin in the rubbery state),
and V,, and V , are the volumes of highly cross-linked region at the
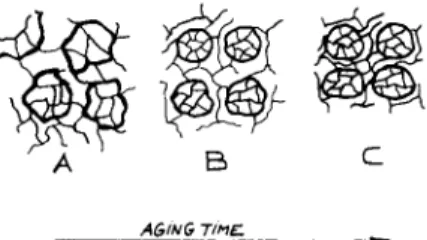
annealing temperature and T,, respectively. Based on Eq. (41, the percentage of shrinkage in the highly cross-linked regions and that in the entire struc- ture of DGEBA-DETA formulation (in the initial stage of aging at 60°C) and TGDDM-DDS formulation (in the initial stage of aging at 90"C), were calculated and are listed in Table 111. According to the results shown in Table 111, the faster shrinkage of highly cross-linked regions in comparison with the entire network could, in turn, force the chains in the lower cross- link density matrix to initially extend (rather than shrink). This leads to the morphological rearrangements, the mechanism of which is envisioned as follows. Let us say that the morphology of the as-cured resin in the rubbery state consists of chain segments randomly interpenetrated between the regions of high and low cross-link density. That morphology is sche- matically shown in Figure 12(A). When the resin is cooled to below its glass transition temperature, molecules in the lower cross-link density matrix will creep because of the faster shrinkage in the highly cross-linked regions. During creep, a partial alignment of chains in the lower cross-link density matrix becomes possible in the direction of highest strain between two adjacent highly cross-linked regions. At that point, the network morphology
is envisioned as schematically shown in Figure 12(B). During subsequent annealing, the entire structure shrinks gradually in order to relieve the contractive forces. With time, however, shrinkage proceeds predominantly in the lower cross-link density matrix, thereby reducing the density differ- ence between the regions of lower and higher cross-link density. At that stage, the morphology appears as schematically shown in Figure 12(C).
This morphological model has been corroborated, for both bi- and tetra- functional epoxy resins, by dynamic mechanical and microscopic evidence. Figure 13 summarizes the unequivocal experimental evidence for changes in morphology of different epoxy formulations during the sub-T, annealing. For instance, the above described mechanism explains why the glass tran- sition peak (Figures 5 and 13) splits initially into two peaks during annealing and why, with further annealing, the lower peak shifts toward and finally merges with the higher peak. It also explains how the nodular structure shown in Figures 9-11 develops and why it becomes more distinct during annealing. It is also worth noting here that the dynamic mechanical ana- lyzer has its limitations in distinguishing between the responses of high
TABLE I11
The Percentage of Shrinkage in the Highly Cross-linked Regions and in the Entire Epoxy Network During Initial Sub-T, Annealing
Percentage of shrinkage Highly
Formulation Tan" T, crosslinked Entire
# "C "C aEq x 104/"C ag x 104/"C regions structure
2 60 140 6.60 2.60 5.14% 2.06%
AGING TlmE.
Fig. 12. A conceptual scheme of the morphology of epoxy resin at various stages of sub-
T8 annealing; (A) as-cured, still in rubbery state, (B) after short sub-T, annealing, glassy state,
(C) after long sub-T, annealing, glassy state.
and low cross-link density regions. Whether the glass transition peak in the loss modulus spectrum splits into two or not during annealing, also depends on the degree of inhomogeneity in the resin network which, in turn, depends on the curing agent concentration. For instance, in the
DGE
BA-DETA systems, the split of the glass transition can be detected by dy- namic mechanical measurements only when the curing agent concentration exceeds the stoichiometric ratio. Changes in
/3
transition temperature of various bifunctional formulations during sub-T, annealing at 6VC, shown in Figure 4, also indicate that formulation 3 (15 phr) has the highestK,
value (i.e., the highest tendency for increase in T, during annealing). This observation can be explained by the fact that the most pronounced inhom- ogeniety in the network was found at 15 phr. We have previously advanced a concept of how the /3 relaxation is dominated by the lower cross-linked density matrix and how the shrinkage of the entire network during an- nealing is predominantly caused by the decrease in volume of the lower cross-link density matrix.21 In that regard, the highestK,
of formulation3 indicates the highest rate of decrease in free volume in the lower cross- link density matrix.
CONCLUSIONS
An investigation was carried out into time-dependent changes in the morphology of epoxy networks below the glass transition. Several epoxy formulations, bifunctional and tetrafunctional were prepared and studied. A typical production sequence was simulated, whereby once the heating stage of the cure cycle has been completed, the resin is cooled to some temperature below the glass transition. Most interestingly, at that tem- perature two processes begin to take place simultaneously. One is physical aging characterized by the decrease in free volume and/or enthalpy. The other process involves morphological changes in the network and was fol- lowed experimentally during the early stages of aging. Apparently a con- comitant drive towards thermodynamic homogeneity and morphological inhomogeneity takes place. At the conditions of our study, morphological changes were completed in the time span of the order of several weeks, while the decrease in free volume and/or enthalpy continued to occur. The
latter phenomenon was corroborated by calorimetric measurements of en- thalpy relaxation. The observed “development” of morphology continues below the glass transition for a certain period of time until the stage is
3226
M I J O V I ~ AND LINFig. 13. A comparison of changes in epoxy morphology as a function of sub-T, annealing. Shown from the top are DMA and TEM results and the schematic of our model for the DGEBA/ DETA system (formulation 2) and the same for the TGDDM/DDS system (formulation 4).
reached which we define as “morphological equilibrium
.”
This phenomenonhas
been corroborated by experimental evidence obtained from dynamic mechanical measurements and transmission electron microscopy.A
model was advanced which describes the gradual development of distinct inhom- ogeneities during sub-T, annealing, as a result of contractive forces within the glassy network.This material is based upon work supported by the National Science Foundation under Grant No. MEA-8120211.
References
1. J. H. DeBoer, Buns. Famday Soc., 32,lO (1936). 2. R. Houwink, Buns. Famday Soc., 32, 132 (1936). 3. J. Mijovib, and J. A. Koutsky, Polymer, 20, 1095 (1979).
4. R. R. Lagasse, J. Polym. Sci., Polym. Phys. Ed., 20, 279 (1982). 5. J. Mijovib, and J. A. Koutsky, J. Appl. Polym. Sci, 23, 1037 (1979).
6. J. D. Ferry, Vismlastic properties of Polymers, 3rd Ed., Wiley, New York, 1980. 7. A. J. Kovacs, J. Polym. Sci, 30,131 (1958).
8. S. E. B. Petrie, J. Polym. Sci., A-2, 10 1255 (1972).
9. L. C. E. Struik, Physical Aging in Amorphous Polymers and Other Mat~riuls, Elsevier,
10. A. J. Kovacs, J. J. Aklonis, J. M. Hutchinson, and A. R. Ramos, J. Polym. Sci., Polym.
11. 0. S. J. Narayanaswamy, J. Am. &mm. Soc., 61,691 (1971). 12. C. T. Moynihan et al., Ann. N. Y. Acad. Sci., 279, 15 (1976). 13. I. M. Hodge, and A. R. Berens, Macromolecules, 15, 762 (1982).
14. A. R. Ramos, J. M. Hutchinson, and A. J. Kovacs, J. Polym. Sci., Polym. Phys. Ed., 22, 15. U. T. Kreibich and R. Schmid, J. Polym. Sci., Polym. Symp., 53, 177 (1975).
16. 2. Ophir, J. A. Emerson, and G. L. Wilkes, J. Appl. Phys., 49, 5032 (1978). 17. J. Kaiser, Makromol. Chem., 160, 573 (1979).
18. J. MijoviE, J. Appl. Polym. Sci., 27, l l 4 9 (1982). 19. J. Mijovib, J. Appl. Polym. Sci., 27, 2919 (1982).
20. E. S. W. Kong, in Epoxy Resin Chemistry 11, Bauer, R. S., ed., Advances in Chemistry Series #221, American Chemical Society, Washington, D.C., 1983.
21. J. Mijovib, and K. F. Lin, J. Appl. Polym. Sci., 30, 2527 (1985). 22. J. Mijovib, and R. C. Liang, Polym. Eng. Sci., 24, 57 (1984). 23. J. P. Bell, J. Appl. Polym. Sci., 27, 3503 (1982).
24. M. Shimbo, M. &hi, and J. Shigeta, J. Appl. Polym. Sci., 26, 2265 (1981). 25. R. A. Fava, Polymer, 9, 137 (1968). Amsterdam, 1978. Phys. Ed., 17, 1097 (1979). 1655 (1984). Received May 14, 1985 Accepted July 22, 1985