• 沒有找到結果。

CHAPTER FOUR RESULTS AND DISCUSSION

N/A
N/A
Protected

Academic year: 2021

Share "CHAPTER FOUR RESULTS AND DISCUSSION "

Copied!
23
0
0

加載中.... (立即查看全文)

全文

(1)

CHAPTER FOUR RESULTS AND DISCUSSION

This chapter is comprised of two major parts. The first part will present readers with the results of the study and the second part will be the discussion of the results.

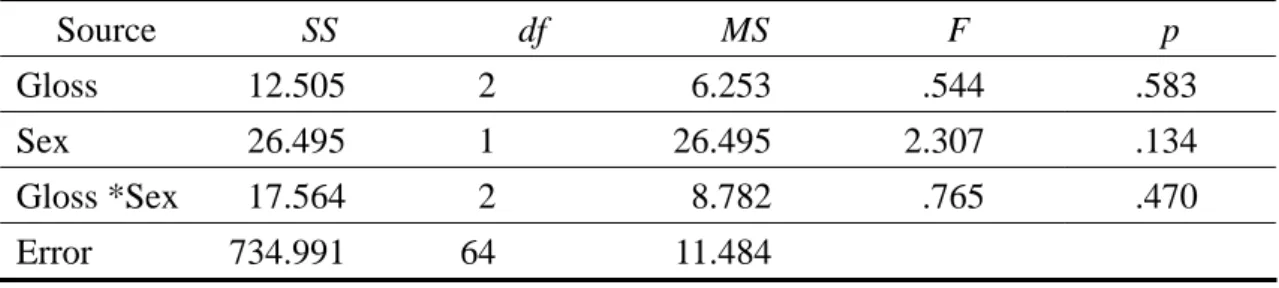
Section 4.1.1 presents students’ overall test scores. Analyses of Variance were used to detect the interaction effects between Sex and Gloss Types and the main effects of Gloss Types. The purpose is to see whether students having access to visual glosses (graphics and animation) had a better performance than those without. In section 4.1.2, students’ vocabulary gain and retention will be presented. Section 4.1.3 examines the effect of test types: production tests and recognition tests.

In the second part of the chapter, readers will be first presented with the discussion of the effects of sex and test types. Then, section 4.2.2 and section 4.2.3 will provide explanations to the results in relation to the two research questions of this study. Finally, students’ feedback on the questionnaires will be presented in section 4.2.4.

4.1 Results

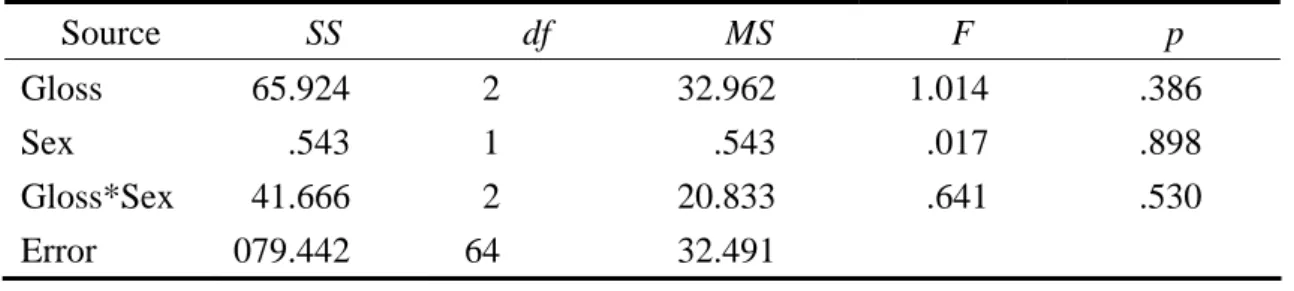
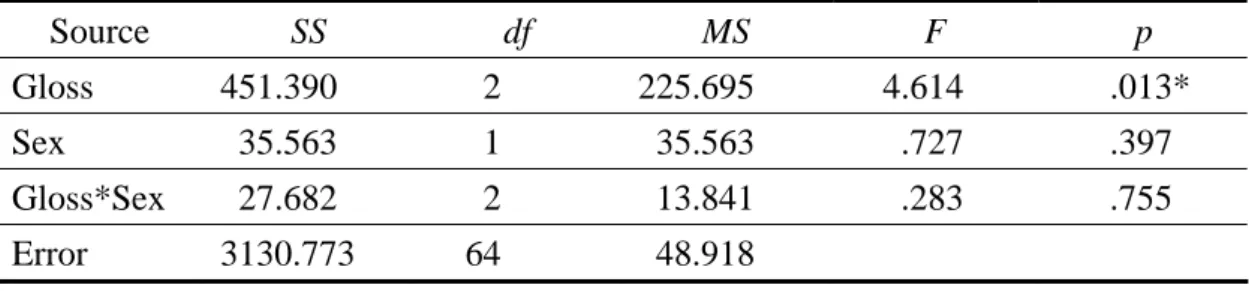
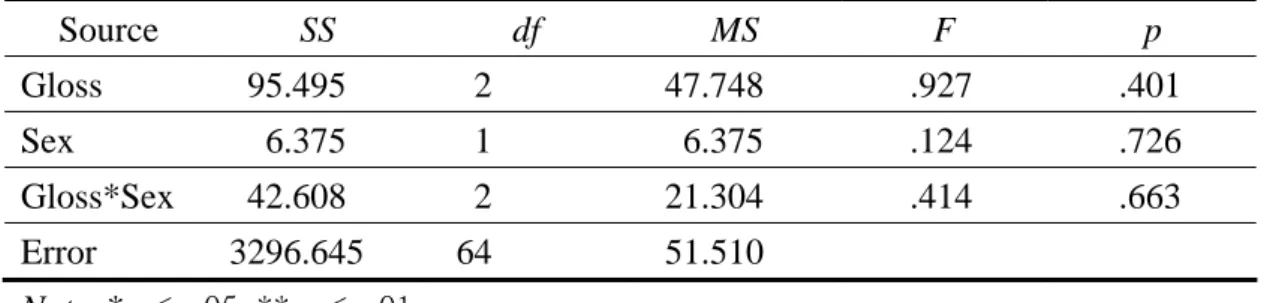
In order to see the overall patterns of gloss type effects, students’ vocabulary test scores before, immediate after and two weeks after the treatment were first analyzed by descriptive statistics and two-way ANOVA using a 3×2 factorial design.

Next, vocabulary gain and vocabulary retention were computed and also analyzed by two-way ANOVA. Finally, production test scores and recognition test scores were examined respectively.

4.1.1 The Results of Pretest, Immediate Posttest, and Delayed Posttest

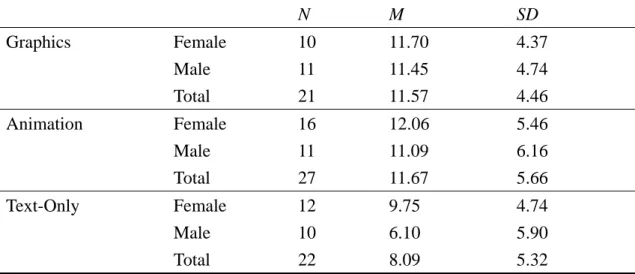
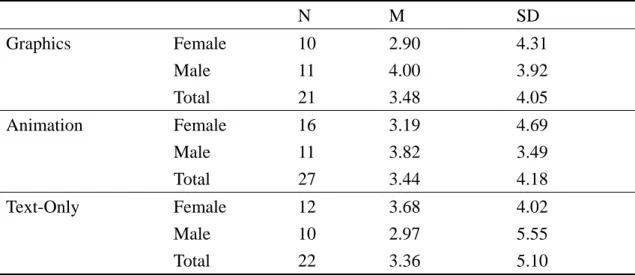
The mean scores and standard deviation of the three groups on pretest,

immediate posttest, and on the delayed posttest are shown in Table 4-1. The three

kinds of tests all included 20 points on production tests and 20 points on recognition

(2)

tests, totaling 40 points.

For immediate posttest results, the mean score of Graphics Group is the highest while the mean score of Text-only Group is the lowest. As to the sex differences, the female students in Animation Group did better than those in Graphics Group.

For delayed posttest results, the Graphics Group got the highest mean score and the Text-only Group got the lowest. Female students in Animation Group still did better than those in Graphics Group, of which pattern is the same as in immediate posttest results.

The female students in Animation Group also got higher scores than those in

Graphics Group on recognition test of immediate posttest and on production test of

delayed posttest.

(3)

Table 4- 1 Descriptive Statistics of Pretest, Immediate Posttest, and Delayed Posttest Results of Graphics, Animation, and Text-Only Groups

Note.

1. G+T= graphics + text gloss; A+T= animation + text gloss; T= text-only gloss.

2. F= female; M= male; T= total.

Pretest Immediate Posttest Delayed Posttest

Production Recognition Total Production Recognition Total Production Recognition Total

N M SD M SD M SD M SD M SD M SD M SD M SD M SD G+T F

M T

10 11 21

1.80 1.91 1.86

1.81 2.34 2.06

11.60 12.00 11.81

3.50 3.80 3.57

13.40 13.91 13.67

4.88 5.65 5.17

8.70 9.18 8.95

3.30 4.42 3.84

16.40 16.18 16.29

2.95 3.55 3.20

25.10 25.36 25.24

5.04 7.30 6.17

3.80 4.45 4.14

2.66 3.39 3.01

12.50 13.45 13.00

3.72 5.72 4.78

16.30 17.91 17.14

6.04 8.08 7.05 A+T F

M T

16 11 27

1.88 1.82 1.85

1.82 2.18 1.94

11.31 9.55 10.59

4.70 4.25 4.53

13.19 11.36 12.44

6.24 6.33 6.22

8.50 7.91 8.26

4.62 5.82 5.04

16.75 14.55 15.85

3.86 4.82 4.33

25.25 22.45 24.11

8.05 9.67 8.68

4.06 3.82 3.96

2.96 2.52 2.74

12.31 11.36 11.93

5.74 5.16 5.43

16.38 15.18 15.89

8.35 7.59 7.92 T F

M T

12 10 22

1.00 2.00 1.45

1.28 2.45 1.92

4.26 3.83 9.25

10.10 9.64

3.75 3.76 3.69

10.25 12.10 11.09

4.81 5.84 5.26

5.17 5.20 5.18

2.37 3.62 2.92

14.83 13.00 14.00

4.00 3.71 3.89

20.00 18.20 19.18

4.73 4.89 4.78

3.42 3.30 3.36

2.28 2.06 2.13

11.83 9.70 10.86 4.12

15.25 13.00 14.23

6.31 5.33 5.86

(4)

Students in the graphics, animation, and text-only groups all got significantly

higher scores on immediate posttest than on pretest, showing that glosses had

facilitating effects on incidental vocabulary learning. The scores on the delayed

posttest in the three groups all dropped a lot two weeks after the treatment, compared

to immediate posttest, though they were still higher than the scores on pretest.

The scores on the pretest were analyzed by two-way ANOVA using Gloss

(Graphics, Animation, & Text-only) and Sex (Female & Male) as independent

variables, as shown in Table 4-2. The result indicates that there was no group

difference and the Gloss by Sex interaction was not significant, which ensures the

equivalence of the three groups.

Table 4- 2 ANOVA Summary for Pretest Scores by Gloss Types and Sex

Source SS df MS F p

Gloss 65.924 2 32.962 1.014 .386

Sex .543 1 .543 .017 .898

Gloss*Sex 41.666 2 20.833 .641 .530

Error 079.442 64 32.491

Note. * p < .05; ** p < .01.

Students’ immediate posttest scores were then analyzed by ANOVA. No

interaction effect was found between Gloss and Sex. Main effects of group difference

was found (F= 4.61, p<.05 ). The ANOVA summary is shown in Table 4-3.

(5)

Table 4- 3 ANOVA Summary for Immediate Posttest Scores by Gloss Types and Sex

Source SS df MS F p

Gloss 451.390 2 225.695 4.614 .013*

Sex 35.563 1 35.563 .727 .397

Gloss*Sex 27.682 2 13.841 .283 .755

Error 3130.773 64 48.918

Note. * p < .05; ** p < .01.

The results indicate that Sex didn’t influence students’ performance on

vocabulary tests. As for the group differences, the post hoc Scheffe test(see Appendix

E, Table 1) further shows that Graphics Group significantly outperformed Text-only

Group. The difference between Animation Group and Text-only Group was found

insignificant.

The delayed posttest results were also analyzed by two-way ANOVA, as shown

in Table 4-4. No interaction effect was found between Gloss and Sex. Besides, no

main effects were found as for the two independent variables, namely, Gloss and Sex.

Compared to the immediate posttest results, the group differences disappeared after

the two-week span. In other words, two weeks after the treatment, textual glosses

accompanied by visual information (graphics and animation) didn’t have better effects

on incidental vocabulary learning than text-only glosses.

(6)

Table 4- 4 ANOVA Summary for Delayed Posttest Scores by Gloss Types and Sex

Source SS df MS F p

Gloss 95.495 2 47.748 .927 .401

Sex 6.375 1 6.375 .124 .726

Gloss*Sex 42.608 2 21.304 .414 .663

Error 3296.645 64 51.510

Note. * p < .05; ** p < .01.

The statistics presented up to now shows that immediately after reading the two

passages, students using graphics+ text glosses (but not animation+ text glosses) did

much better on vocabulary immediate posttests than students using text-only glosses.

However, on the delayed posttests, the group differences disappeared. That is, after

two weeks, the different effects of animation+ text glosses, graphics+ text glosses,

and text-only glosses weren’t detected by statistics.

4.1.2 Vocabulary Gain and Retention

In this section, students’ vocabulary gain and retention were examined in order to

derive the meaning of the vocabulary test scores in more detail. The immediate

posttest scores subtracted by pretest scores was defined as the vocabulary gain. The

immediate posttest was administered right after participants read the reading passages.

The delayed posttest scores subtracted by pretest scores was defined as the vocabulary

retention. The delayed posttest was administered two weeks after the treatment.

First of all, the means and deviations of vocabulary gain were presented in Table

4-5. As shown in the table, Animation Group got the highest scores while the

(7)

Text-only Group got the lowest. However, the male students in Graphics Group had

higher scores than those in Animation Group.

Table 4- 5 Descriptive Statistics of Vocabulary Gain of Graphics, Animation, and Text-Only Groups

N M SD

Graphics Female

Male Total

10 11 21

11.70 11.45 11.57

4.37 4.74 4.46

Animation Female

Male Total

16 11 27

12.06 11.09 11.67

5.46 6.16 5.66

Text-Only Female

Male Total

12 10 22

9.75 6.10 8.09

4.74 5.90 5.32

A two-way ANOVA was used to detect the interaction effect between Group and

Sex and the main effects of Group and Sex, respectively. The analysis is shown in

Table 4-6.

Table 4- 6 ANOVA Summary for Vocabulary Gain by Gloss Types and Sex

Source SS df MS F p

Gloss 198.766 2 99.383 3.773 .028*

Sex 44.894 1 44.894 1.704 .196

Gloss*Sex 35.108 2 17.554 .666 .517

Error 1685.24 64 26.341

Note. * p < .05; ** p < .01.

No interaction effect was found between Gloss and Sex and group difference was

found. However, the post hoc Scheffe test(Appendix E, Table 4) shows the group

difference was insignificant. The results indicate that as for overall vocabulary gain,

animation +text glosses and graphics+ text glosses didn’t have better effects on

(8)

incidental vocabulary learning than text-only glosses.

Secondly, vocabulary retention of the three groups was computed and the means

and standard deviations were presented in Table 4-7. As shown in the table,

vocabulary retention is much lower than vocabulary gain, which means that though

students gained significant amount of target words on immediate posttest, they forgot

many of the words after two weeks.

Table 4- 7 Descriptive Statistics of Vocabulary Retention of Graphics, Animation, and Text-Only Groups

N M SD

Graphics Female

Male Total

10 11 21

2.90 4.00 3.48

4.31 3.92 4.05

Animation Female

Male Total

16 11 27

3.19 3.82 3.44

4.69 3.49 4.18

Text-Only Female

Male Total

12 10 22

3.68 2.97 3.36

4.02 5.55 5.10 The vocabulary retention was also analyzed by two-way ANOVA, and no

interaction effect was found between Group and Sex. Besides, there were also no

main effects on the two independent variables.

(9)

Table 4- 8 ANOVA Summary for Vocabulary Retention by Gloss Types and Sex

Source SS df MS F p

Gloss 4.208 2 2.104 .110 .896

Sex 10.639 1 10.639 .555 .459

Gloss*Sex 91.557 2 45.779 2.386 .100

Error 1227.874 64 19.186

Note. *p< .05; ** p< .01.

4.1.3 Production Test and Recognition Test

In section 4.1 and 4.2, we found that there were group differences on immediate

posttest and on vocabulary gain when analyzed by two-way ANOVA. Since the

vocabulary tests were comprised of production and recognition tests, it seems

worthwhile to investigate whether the two test types showed the same pattern of gloss

type differences. Two-way ANOVA was used to analyze the data of immediate

posttest and vocabulary gain, on production test and on recognition test respectively,

as shown in Table 4-9, 4-10, 4-11, and 4-12.

Table 4- 9 ANOVA Summary by Gloss Types and Sex on Immediate Posttest:

Production Test

Source SS df MS F p

Gloss 173.484 2 86.742 4.905 .010*

Sex .011 1 .011 .001 .980

Gloss *Sex 3.422 2 1.711 .097 .908

Error 1131.92 64 17.686

Note. * p < .05; ** p < .01.

(10)

Table 4- 10 ANOVA Summary by Gloss Types and Sex on Immediate Posttest:

Recognition Test

Source SS df MS F p

Gloss 65.476 2 32.738 2.184 .121

Sex 34.330 1 34.330 2.290 .135

Gloss *Sex 12.443 2 6.221 .415 .662

Error 959.430 64 14.991

Note. *p< .05; ** p< .01.

Table 4- 11 ANOVA Summary by Gloss Types and Sex on Vocabulary Gain:

Production Test

Source SS df MS F p

Gloss 140.221 2 70.110 6.223 .003**

Sex 2.412 1 2.412 .214 .645

Gloss *Sex 4.996 2 2.498 .222 .802

Error 721.008 64 11.266

Note. * p < .05; ** p < .01.

Table 4- 12 ANOVA Summary by Gloss Types and Sex on Vocabulary Gain:

Recognition Test

Source SS df MS F p

Gloss 12.505 2 6.253 .544 .583

Sex 26.495 1 26.495 2.307 .134

Gloss *Sex 17.564 2 8.782 .765 .470

Error 734.991 64 11.484

Note. * p < .05; ** p < .01.

The results show that only on production tests were there group differences, no

matter it was immediate posttest result or vocabulary gain result. As to recognition

test, no group differences were detected. In other words, in this study, production tests

were more sensitive to gloss type effects than recognition tests.

For production immediate posttest and production vocabulary gain, the

animation group and the graphics group had significantly higher scores than text-only

(11)

group, while the recognition immediate posttest results revealed no group differences.

The post hoc tables are shown in Appendix E, Table 2, 3, 5, &6.

The pattern is similar to that of previous studies (e.g. Chun and Plass, 1996;

Yoshii, 2006), which also showed that production tests were more sensitive to

different gloss type effects than recognition tests.

4.2 Discussion

This section consists of four parts. The first section talks about the effect of test

types. Research questions one and two are discussed in the following two sections.

The last section is about participants’ feedback on the questionnaires.

4.2.1 Overall Finding:

Sex. This study adapted a two(female and make)by-three(graphics+ text,

animation+ text and text-only glosses) factorial design analyzed by two-way ANOVA.

The results show that sex and gloss types didn’t reveal interaction effect in all the tests.

As to vocabulary gain and retention, no interaction between the two independent

variables was found, either.

The Effect of Test Types. In this study, the results differed according to test types.

When we look at the production tests and recognition tests separately, we can see that

only on production test did the animation group and graphics group performe better

than text-only group (immediate posttests and vocabulary gain). As to the recognition

(12)

test, there were no group differences.

There might be several reasons that attributed to the results.

The nature of recognition tests will be discussed first. Stoddard (1929), cited in

Nation (2001), compared receptive and productive learning and found that the type of

test favors the type of learning. His study implies that for incidental vocabulary

learning, which is seen as a receptive learning activity, learners can get higher scores

on receptive tests. On the other hand, learners should get lower scores on productive

tests because no learning activity here means to be productive. Due to the fact that no

learning activity corresponds to the test type (production tests), the visual cues

(animation or pictures) served as important sources to assist vocabulary learning on

production tests. The effect of visual cues is thus highlighted more on production tests

than on recognition tests in this study.

Besides, students in this study could get clues from the four alternatives on

recognition tests, making recognition tests easier than production tests. Students in all

the three groups could get enough clues to get the meaning. As a result, the difference

of the recognition test among the three groups becomes smaller than that of the

production test, and thus weren’t detected by statistics. When doing recognition tests,

students didn’t need so much mental effort, or process of the brain to remember the

form of a word. They only have to choose one answer from four alternatives, and the

(13)

possibility of guessing the right answer is much higher than that of production tests.

Therefore, students didn’t need visual aids to be clues to answer the questions so

much on recognition tests as on production tests. The effects of visual cues were thus

decreased in recognition tests.

In the related literature, we can also find that production tests were more

sensitive to experiment variables than recognition tests. For example, study 3 in Chun

and Plass (1996) didn’t reveal difference among text+ video, text+ picture, and

text-only glosses. Their research comprised of three studies. In study 1 and study 2,

where production tests were used, the effects of different gloss types were detected by

statistics. However, in study 3, the only study which utilized recognition tests, the

different effects of picture+ text annotations, video+ text annotations, and text

annotations weren’t seen. Chun and Plass attributed the reason to the fact that small

number of participants(N= 21) was not sufficient to reveal statistical power.

Students in this study had high percentage of correct answers on tests: 76.90 %

correct answers on recognition tests and 37.5 % correct answers on production tests.

The similar pattern is also shown in Chun and Plass’ study. The percentage of correct

answers in Study 3 (recognition test) is much higher than Study 1 and Study

2(production tests). The average students answered 25.9% words correctly in Study 1,

24.1% in Study 2, and 77.0 in Study 3.

(14)

Another example was found in Yoshii (2006). In his study, the definition-supply

test results showed a significant difference between picture and no-picture groups.

However, statistics failed to reveal any significant difference between picture and

no-picture groups on recognition test. Yoshii (2006) explained that,

…in the definition-supply test, learners had to rely on their memory without any hints to recall the meanings, and the addition of pictures may have helped recall the meaning by assisting the memory trace. On the other hand, in the recognition test, learners were able to see the multiple choices and use them as hints for recalling the meanings. Therefore, the presence or absence of pictorial cues did not have as much effect as they did on the definition-supply tests and, thus, minimized the effect of the addition of pictures. (p. 95)

4.2.2 Research Question One

This section deals with the first research question: is the effectiveness of

graphics+ text glosses and animation+ text glosses different from that of text-only

glosses on vocabulary learning?

The overall results of this study give positive answer to research question one.

The results of the production test of immediate posttest and vocabulary gain both

show that the visual groups (animation group and graphics group) outperformed

text-only group. The superiority of visual groups over text-only (verbal) group shows

that the two kinds of visual aids used in this study (animation and graphics) both

helped incidental vocabulary learning more than text-only glosses. The results gave

positive support for adding visual cues to textual glosses when the purpose is

incidental vocabulary learning. It is one example that confirms Paivio’s (1986)

(15)

Dual-Coding Theory, which predicts that additional visual cues can help learners

make associations between pictures and words and, therefore, can make learning more

effective and efficient. The two independent and yet interconnected subsystems

(verbal and visual) in human memory working together could help each other when

verbal and visual information were available at the same time.

Besides, just as Mayer (1997) pointed out in his generative theory, to

comprehend a multimedia text, learners must select, organize and then integrate

information by constructing referential connections. The results of the study showed

that visual information accompanied by textual information may support learners’

comprehension process by helping them select, organize and then integrate

information. Simultaneous presentation of verbal and visual information helped link

two (L2-L1) verbal systems and helped the storage of information.

As for vocabulary gain, in average, students gained 6.41, 7.10, and 3.73 words,

in animation, graphics, and text-only group respectively on production tests; 5.26,

4.48, and 4.36 on recognition tests. ANOVA was used and it was shown that there was

group difference on production test. Both animation group and graphics group

performed significantly better than text-only group. That is, from learners’ vocabulary

gain, we can confirm the superiority of adding visual cues to textual glosses.

The result is consistent with previous studies (Chun & Plass, 1996; Plass et al.

(16)

1998; Al-Seghayer, 2001). With the help of visual glosses, learners can acquire more

vocabulary items than those only have access to verbal glosses. As suggested by

Al-Seghayer(2001), dual presentation can reinforce each other, and thus can make

animation+ text and picture+ text glosses more effective. Besides, the results also

support Paivio’s Dual Coding Theory. While people’s verbal system processes more

abstract information, visual system processes more concrete information. In this way,

additional pictorial cues help learners make associations between pictures and words,

and thus make incidental vocabulary learning more effective.

This study also adds one more literature supporting Terrell’s (1986)

form-meaning connection, which assumes that the binding of form (unknown L2

vocabulary) to meaning (visual representation) is the most effective way for learners

to acquire concrete ideas and references. The target words in this study are all

concrete action verbs, and learners’ vocabulary learning is greatly helped by the

adding of visual representation to unknown vocabulary items, as shown in the

production test results of immediate posttest and vocabulary gain.

4.2.3 Research Question Two

This section deals with the second research question: do picture cues and

animation cues differ in their effectiveness on incidental vocabulary learning?

After examining the vocabulary immediate posttest, we found a superiority of

(17)

graphics+ text glosses over text+ only glosses. That is, the animation group didn’t

perform as well as graphics group, though the differences didn’t reach significance.

The superiority of graphics+ text glosses over text-only glosses on overall

vocabulary immediate posttest could be explained from the following aspects.

First, according to Mayer’s (2002) cognitive theory of multimedia learning,

meaningful learning occurs when learners engage in active processing. Learners can

learn better when they select relevant words and pictures, organize them into coherent

pictorial and verbal models, and integrate them with each other. I speculate that

graphics better helps learners organize word form and meaning into one proper mental

model and better helps learners engage in active processing because of its static

property. The transient property of animation may distract learning attention to

combine the meaning with the word form and thus impede learning. The dynamic

property of animation may encourage learners to think about the visual form itself and

learners may, as a result, miss the opportunity to work on the verbal representation of

the word. The static property, on the other hand, may help reduce learning burden and

reinforces meaningful learning because learners can spend more time on the word,

and on the form-meaning connection.

Second, the observation in the classroom shows that learners were more often

clicking the target words more than once to see the animation demonstrated again and

(18)

again while in the graphics group, students seldom did so since the pictures were

“still” all the time. This static feature of graphics might help learner concentrate on

the words, on the texts and on the process of comprehension. Therefore, graphics

better facilitate incidental vocabulary learning than animation.

The phenomenon observed in this study is consistent with what Chun and Plass

(1996) stated. They found that words annotated with pictures+ text were learned best,

and picture cues were more often served as learners’ retrieval cues for remembering

words. On the other hand, video presentations were found short and transient,

allowing learners neither to establish long term memory, nor to reflect and refresh

short term memory. Their results for video annotations differed from those for picture

annotations, but not always in a statistically significant way. In this study, the different

effects of gloss types were found in immediate posttest (overall), immediate posttest

(production), and vocabulary gain (production). Immediate posttest (overall) results

are a little different from the other two because we see that the two visual aids

(graphics and animation) are different. Only graphics cues, but not animation cues,

have a better effect on vocabulary learning than text-only cues. This confirms Chun

and Plass (1996) in that the difference between static pictures and the dynamic videos

seem to have an impact on recall of the annotated words.

The results of this study also confirm what Zhu and Grabowski (2006) suggested.

(19)

As a learning aid, static graphics are more cost-effective and cost-efficient than

animation. Since the participants in the static groups performed equally well to those

in the animation strategies groups, it may be better to use web-based static graphics as

much as possible and use animation only when it is integral to the learning objective.

This study is different from Al-Seghayer(2001). He found that text with dynamic

video is a more effective annotation mode than text with still pictures for incidental

vocabulary learning. He stated that the reason why his results are different from those

obtained by Chun and Plass (1996) may be attributed to a number of issues including

the mother tongue of the participants, the target language, the type of visual aids, and

the type of test through which the learning outcome was assessed.

Therefore, in addition to the reasons I speculate earlier in this section, the factors

that caused the results of this study may partly be found in the difference of the

methodology of the experiments. The following lists some methodological difference

of the three studies (Al-Seghayer, 2001; Chun and Plass, 1997; and Hsu, 2007).

The most obvious difference between this study and the other two studies lies on

the design. Chun and Plass(1996) and Al-Seghayer (2001) both utilized a

within-subject design. In Chun and Plass’ (1996) study, subjects could click on

annotations from what is available. They could click only textual annotations if they

thought textual cues were clear enough when comprehending the passage. Some

(20)

words had text plus picture cues, others had text plus video cues, and yet others had

only textual cues. In Al-Seghayer’s (2001) study, about one third of targets words had

text-only glosses, one third had text+ image glosses, and one third had text+ video

glosses. In my study, a between-subject design was used. Subjects were divided into

three groups. Animation group had access to animation+ text glosses, graphics group

had picture+ text glosses and text-only group had text-only glosses. That is, for

instance, all the target words were annotated with animation+ text glosses when

students in animation group were reading the passages.

As to the word types of target vocabulary, all the target words were concrete

verbs in this study, while in the other two studies, the target words contained nouns,

adjectives and nouns.

As to the way of assessment, the test items (with only textual information)were

all the same for students in all the three groups in this study. However, in the other

two studies, for different target words, the researchers provided subjects with test

questions in accordance with annotation types which appeared in the reading process.

That is, the test was parallel to the modality in which information was presented to the

users in the computer program. In the production tests, subjects were asked to

provided an L1(English) equivalent for the L2(German) word in Chun and

Plass’(1996) study. Subjects were asked to provide L2 (English) definitions of target

(21)

words in Al-Seghayer’s(2001) study and only 6 out of the 21 target words were tested

by production tests. However, in my study, subjects were asked to spell out the L2

(English) target words in the production tests, not to provide definitions.

The above methodological differences of the three studies may have caused

different results of the three studies.

From students’ immediate posttest results (overall), we can find the superiority of

graphics+text glosses over the other two gloss types. I speculate that differences

between graphics cues and animation cues do have a impact on incidental vocabulary

learning. The reasons why the two different cues didn’t reveal statistically different

results might be attributed d to the following reasons.

First, the length of the passages in this experiment was a little longer than that of

the passages usually read by the students. If the length of the passages could be

shortened to fit students’ reading habit, the results might be able to reveal the different

effects of animation and graphics cues better.

Second, learners were not used to read on the computer, according to the

questionnaires collected after the experiment period. For most of the reading activities

in the classroom, they read printed texts.

Third, students’ learning styles differed. Yeh and Wang(2003) suggested that

Taiwanese EFL learners show a strong preference for visual stimuli. If students’

(22)

learners’ styles could be investigated, the results may show which factor affects the

learning more.

Fourth, learner were able to surf the Net while they were reading, which might

distract learners’ attention because some of them wanted to finish the reading as soon

as they could in order to get more free time in the computer lab.

If the above factors could be singled out, or be better controlled, the results might

be able to reveal the differences between animation and pictures cues better.

4.2.4 Questionnaires

After the experiment period, six students in each group were asked to finish one

questionnaire. The questions were about their reading experience before the

experiment and during the experiment.

Students’ feedback reflects that using computers to read can make reading faster

and more convenient. Students say that reading via computer is good because they

don’t have to spend time looking up new words in the dictionary. About two thirds of

the students hope that pronunciation and usages of target words can be provided,

which indicates that learning new words is one thing they value a lot while they are

reading a story in English.

As to the glosses already provided, four out of six students in the animation

group hold highly positive attitude toward the glosses. The number is the same in the

(23)

graphics group. However, about half of the students in the text-only group hope that

visual aids could be provided because sometimes text-only glosses were still too

abstract for them.

Textual glosses accompanied by visual cues were highly accepted. Students in

the animation group say, “animation is interesting,” “animation makes the words

concrete and easy to understand;” besides, “it gets my attention.”

Students in the graphics+ text group say, “pictures are impressive,” and “pictures

help me to understand the meanings of the words.”

數據

Table 4- 1 Descriptive Statistics of Pretest, Immediate Posttest, and Delayed Posttest Results of Graphics, Animation, and Text-Only  Groups
Table 4- 2 ANOVA Summary for Pretest Scores by Gloss Types and Sex
Table 4- 3 ANOVA Summary for Immediate Posttest Scores by Gloss Types and  Sex  Source  SS df MS F  p  Gloss 451.390  2  225.695 4.614  .013*  Sex  35.563 1  35.563 .727 .397  Gloss*Sex  27.682 2  13.841 .283 .755  Error 3130.773  64  48.918  Note
Table 4- 4 ANOVA Summary for Delayed Posttest Scores by Gloss Types and Sex  Source  SS df MS F  p  Gloss 95.495  2  47.748 .927 .401  Sex 6.375  1 6.375  .124  .726  Gloss*Sex  42.608  2  21.304 .414 .663  Error 3296.645  64  51.510    Note
+5

參考文獻

相關文件

The significant and positive abnormal returns are found on all sample in BCG Matrix quadrants.The cumulative abnormal returns of problem and cow quadrants are higher than dog and

In these lessons, students will evaluate the impacts of genetic engineering on our daily life, and analyze the moral issues raised in its development, especially those related

1、 Focusing on the unit of “circle”, the variation of the learning achievement between the experimental group and the control group reached significant difference3. The variation

As to the effects of internet self-efficacy on information ethics, students who get high, middle, and low scores on basic computer operation also perform differently on

After 1995, the competitive environment changed a lot in Taiwan, the cost of employee and land got higher and higher, the medium and small enterprises in Taiwan faced to

The results of this study found that the experimental group had higher scores than the control group, demonstrated the curricula of the global warming, energy-saving and

hands sensory contact with the soil medium high repellency.3 、 In accordance with Based on Welfare benefits Pretest and posttest Checklist of

The results showed that, on the part of patent analysis, the United States in four categories of face recognition technology, they know one another on the patent number