國立臺灣大學工學院機械工程學研究所 碩士論文
Department of Mechanical Engineering College of Engineering
Natural Taiwan University Master Thesis
奈米碳管印製於紅銅圓柱表面之冷凝熱傳研究 Experimental Investigation of Condensation Heat
Transfer on a CNT Printed Copper Cylinder
劉家齊 Chia-Chi Liu
指導教授: 陳炳煇 博士 Advisor: Ping-Hei Chen, Ph.D.
論文口試委員審定書
致謝
兩年的碩士生活一轉眼就過去了,這段期間在台大和台北的生活著實讓我充 實不少。首先感謝我的家人,給予我能安心在台北好好念書的資源,一路上的栽 培讓我萬分感激。感謝老師兩年給予的建議,不論是研究上還是其他方面皆有所 收穫。感謝實驗室學長們的幫助,每一次的 meeting 讓我逐步了解自己在研究過 程中的每一項細節。感謝上一屆的學長姐們,以及同屆的夥伴們: 戴耀俞、王裕 翔、陳德璇,彼此互相激勵讓我度過多道困進。特別感謝馬里歐,除了平常的鼓 勵外,也會偶爾聊聊生活瑣事,為我的研究生活添增幾分色彩。感謝實驗室的學 弟們,在碩士最後一年多了些許趣味。
感謝台大擊劍隊的每一位夥伴,能成為隊上一份子一起參與訓練,並為校爭 光,我深感驕傲;特此感謝同劍種優秀的學弟們,我很慶幸在台大終於在擊劍領 域有所成就。感謝台大網球社,讓我重拾網球的樂趣,並明顯感覺自己的球技的 提升,每一次的練球都是我做為碩士生的一項目標。感謝在台北生活期間認識的 每一個人,讓我在台北多了份聯繫的情誼。最後感謝過去的自己,每一次選擇或 許不一定都有好的結果,但正因為過去才有現今的我。
中文摘要
本研究探討在密閉腔體下的冷凝熱傳現象。以外直徑 25mm 的紅銅館為熱傳 導物質,利用較為簡單的印製方式在紅銅柱表面印上奈米碳管墨,以不同印製面 積比當作變因,也就是比較純紅銅、全冷凝表面印製、30%、50%、70%,進行 實驗觀測該印製的奈米碳管對於冷凝現象的影像。
經量測顯示奈米碳管印製面積的接觸角為 76∘,而未改質表面之接觸角為 107∘,然而實驗結果觀測到,在低過冷度段,也就是 0~7.5∘,印製面積 30%
和 50%均有呈現熱傳增強的現象,經影像觀測發現在此過冷度區間不分親水性面 積有助於冷凝液的移動和成核。而過冷度大於 7.5∘,也就是近濕潤轉變後,印 製面積 30%、50%、70%的熱傳效果有降低的趨勢。由此研究可得知,此方法印 製的奈米碳管表面會呈現親水性,但部分印製的冷凝表面再低過冷度區間有熱傳 增強的效果。
關鍵字: 冷凝熱傳、表面改質、濕潤性、奈米碳管、紅銅柱
Abstract
This research focused on condensation heat transfer of copper cylinder inside a closed chamber. The dimension of cylinder is 25mm in diameter and 50mm in length.
Besides, the modification method is printing carbon nanotube (CNT) onto the copper surface with different printing area ratio: 0%, 30%, 50%, 70%, and 100% as one of controlling factors. The other one is the subcooling degree, which is the temperature difference between condensation wall and steam.
After measurement, the wettability of CNT printed area is hydrophilic, while the one of plain surface is hydrophobic. However, the experimental results showed that within lower interval of subcooling degrees, which is 0 to 7.5∘, the heat transfer
coefficient and heat flux of the 30% and the 50% types are higher than the plain one.
Accompanying the experimental images, hydrophilic surface has benefit to droplet movement and nucleation. On the other hands, the 30%, the 50%, and the 70% types worsen the heat transfer as the subcooling degree is >7.5∘ because the wetting
transition induced the flooding upon the surface. From this research, even with hydrophilic patterns, the heat transfer performance could be enhanced during some subcooling degrees.
Keywords: condensation heat transfer, surface modification, wettability, carbon
Nomenclature
Cross section area of copper cylinder
Unmodified area
Modified area
Total area of condensation
Molecular concentration
Specific heat
Diameter of copper cylinder
Energy barrier of nucleation
Height of microstructure
Heat transfer coefficient of condensation
Latent heat of water evaporation
Nucleation speed
Nucleation flux
Thermal conductivity of copper
Boltzmann constant
Copper length
Half length of unprinted area
m Length of printed area
Mass flow rate of cooling water
Vapor pressure
Satruation pressure
Critical pressure
Heat taken by cooling water
Heat transporting in lateral direction
Average heat flux
Roughness
Radius of droplet
Minimum radius of nucleation
Radius of removal
Saturation temperature
Surface temperature of copper cylinder
Subcooling degree
time
water specific volume
Ratio of non condensable gas
Energy barrier of wetting transition
Angle
Angle
Angle
Contact angle of Wenzel model
Contact angle of Cassie Baxter model Ratio of droplet contacting onto substrate surface
Density
Surface tention
Content
論文口試委員審定書... II 致謝... III 中文摘要...IV Abstract ...V Nomenclature ...VI List of Figures ... X List of Tables ... XII
Chapter 1. Introduction ... 1
1.1 Motivation ... 1
1.2 Literature Review... 3
1.2.1 Condensation Heat Transfer Enhancement ... 3
1.2.2 Carbon Nanotube (CNT)... 8
1.3 Purpose ... 9
Chapter 2. Theory ... 19
2.1 Surface Wettability ... 19
2.1.1 Wettability and Contact Angle Theory ... 19
2.1.2 Young’s Equation ... 20
2.1.3 Wenzel Model ... 21
2.1.4 Cassie-Baxter Model ... 22
2.1.5 Partial Wetting Model and Wetting Transition ... 22
2.2 Condensation Heat Transfer ... 27
2.2.1 Stages of Condensation ... 27
2.2.2 Effects from Non-condensable Gas (NCG) ... 32
Chapter 3. Experiments ... 35
3.1 Surface Modification ... 35
3.1.1 Chemical and Materials ... 35
3.1.2 Equipment ... 35
3.1.3 Procedures ... 36
3.2 Thermal System ... 42
3.2.1 Equipment ... 42
3.2.2 Setup and Procedures ... 43
3.3 Error Analysis ... 46
Chapter 4. Results and Discussion ... 56
5.1 Conclusion ... 67 5.2 Future Prospects ... 68 Reference ... 70
List of Figures
Figure 1- 1. Lotus surface on leaves. [14] ... 10
Figure 1- 2. Contact angle measurement for n-octadecyl mercaptan on the surface before experimentation. [24] ... 10
Figure 1- 3. Optical microscope images during condensation. [26] ... 11
Figure 1- 4. Calculated overall heat-transfer coefficient of each sample, and the comparison between ceria-Cu and FAS-Cu. [27] ... 11
Figure 1- 5. The illustration of wetting transition. [28] ... 12
Figure 1- 6. Hierarchical structure surface. [36] ... 12
Figure 1- 7. Self-propelled jumping of condensates. [37] ... 13
Figure 1- 8. Water vapor condensation on fluoropolymer-coated silicon surfaces in ESEM. [38] ... 13
Figure 1- 9. Jumping and flooded condensation. [6] ... 14
Figure 1- 10. Ratio of work of adhesion to the available excess surface energy and droplet apparent contact angle as a function of droplet radius on the hierarchical biphilic surface. [39, S7] ... 14
Figure 1- 11. Comparison of droplet distribution between two different circular pattern types. [42] ... 15
Figure 1- 12. The highest heat transfer coefficients observed for the patterned condensation surface with various hydrophilic island diameters. [42] ... 15
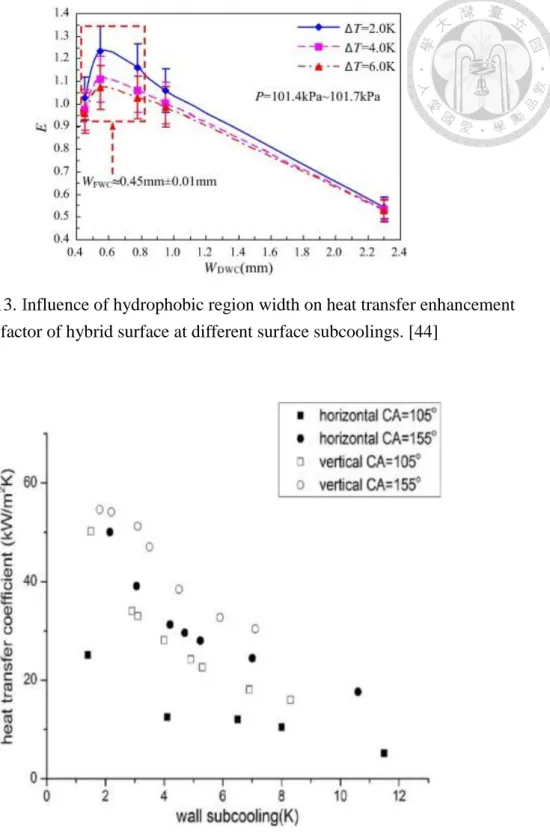
Figure 1- 13. Influence of hydrophobic region width on heat transfer enhancement factor of hybrid surface at different surface subcoolings. [44] ... 16
Figure 1- 14. Variation of heat transfer coefficient with wall subcooling for plain and superhydrophobic surfaces. [7] ... 16
Figure 1- 15. Additional heat transfer enhancement ratio of various types of modified surface as a function of wall subcooling for the (a) horizontal and (b) vertical surfaces. [7] ... 17
Figure 1- 16. Thermal conductivity as a function of volume fraction for CNT films compared to values reported for measurements for vertically-aligned CNT arrays and individual nanotubes (volume fraction = 1). [52] ... 17
Figure 1- 17. Absorptance of CNT and CNT/AlOOH coatings. [54] ... 18
Figure 1- 18. The illustration of microsturcture and droplet movement. [56] ... 18
Figure 2- 6. The mean droplet radius grows with time for different growth and
coalescence stages. [28] ... 30
Figure 2- 7. The external forces applied on the tube. [69] ... 31
Figure 2- 8. The Illustration of NCGs boundary layer. ... 33
Figure 2- 9. Hydrophilic surface with hydrophobic bumps to enhance the droplet falling. [71] ... 34
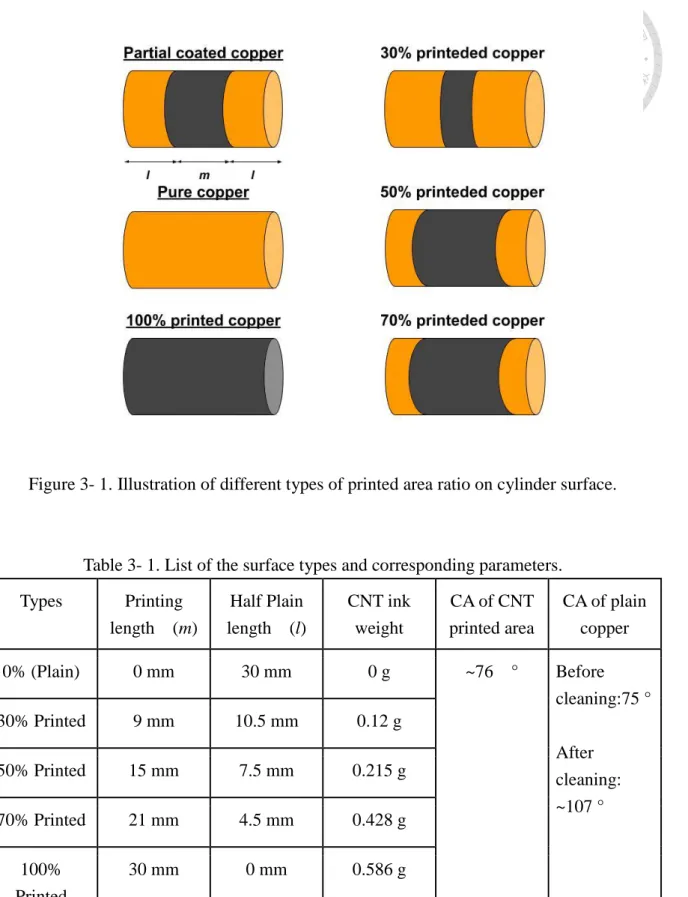
Figure 3- 1. Illustration of different types of printed area ratio on cylinder surface. .. 39
Figure 3- 2. The 100% printed cylinder. ... 40
Figure 3- 3. The ultrasonic cleaner. ... 40
Figure 3- 4. The design of holder. ... 41
Figure 3- 5. Experimental setup. ... 48
Figure 3- 6. The copper cylinder. (L is the length of condensing area, as blue frame region is the condensation area region) ... 48
Figure 3- 7. The condensing chamber. ... 49
Figure 3- 8. The silicone glue. ... 49
Figure 3- 9. The anti-fog sheet. ... 50
Figure 3- 10. The steam generator. ... 50
Figure 3- 11. The cooling circular bath. ... 51
Figure 3- 12. The T type thermocouple. ... 51
Figure 3- 13. The thermal grease. ... 52
Figure 3- 14. The K type thermocouple. ... 52
Figure 3- 15. The data logger system. ... 53
Figure 3- 16. The illustration of the temperature measured location. ... 53
Figure 4- 1. Heat transfer coefficient distribution of plain and 100% printed cylinder with subcooling degree. ... 58
Figure 4- 2. The illustration of nucleation from vapor with changes of subcooling degree Tsub. ... 58
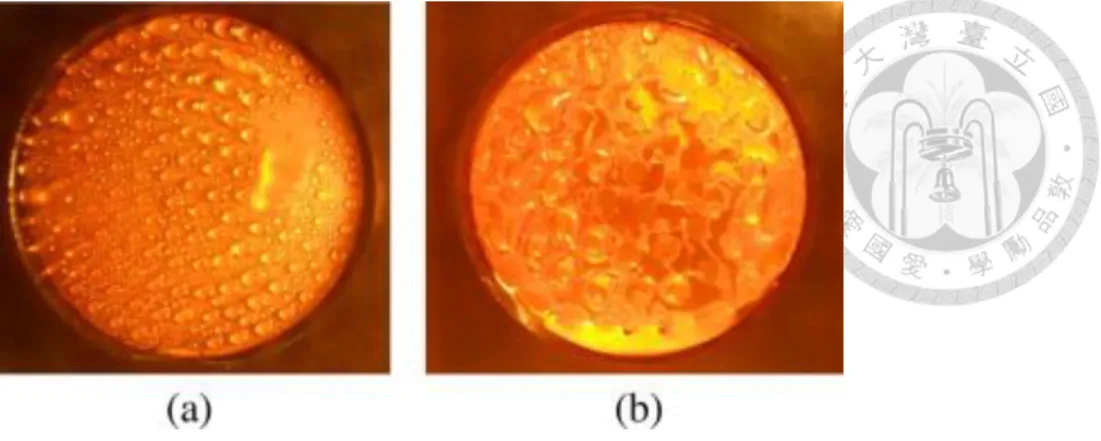
Figure 4- 3. Experimental images of plain and 100% printed copper cylinders: (A) plain (B) 100%. ... 59
Figure 4- 4. Heat flux distribution of plain and 100% printed cylinder with subcooling degree. ... 59
Figure 4- 5. Heat transfer coefficient distribution of partial printed cylinders with subcooling degree. ... 62
Figure 4- 6. Heat flux distribution of partial printed cylinderswith subcooling degree. ... 63 Figure 4- 7. Experimental images of partial printed copper cylinders: (A) 30%, (B)
printed cylinders with subcooling degree. ... 65
Figure 4- 9. Heat transfer coefficient distribution of plain, 30% printed, and 100% printed cylinders with subcooling degree in 0 to 8 °C. ... 66
Figure 4- 10. Heat flux distribution of plain, 30% printed, and 100% printed cylinders with subcooling degree. ... 66
List of Tables Table 2- 1. Various types of wettability. ... 26
Table 3- 1. List of the surface types and corresponding parameters. ... 39
Table 3- 2. The uncertainty of . ... 54
Table 3- 3. The uncertainty of . ... 54
Table 3- 4. The uncertainty of . ... 54
Table 3- 5. The uncertainty of . ... 55
Table 3- 6. The uncertainty of . ... 55
Chapter 1. Introduction
1.1 Motivation
Condensation heat transfer has been widespread applied in various industries including desalination [1], power generation [2], air conditioners [3], and etc. There are types of condensation. The filmwise condensation is tha the vapor forms liquid films on the surface, while the dropwise condensation shows little droplets emerge on the surface. Researches have indicated that the heat transfer performance in dropwise condensation is better than filmwise condensation [4, 5], which results from the lower surface energy between the substrate and water. As the wettability of the surface is more hydrophobic, droplets can be removed more easily, allowing the next occurrence of condensation, leading to the enhancement in heat transfer rate. From this aspect, the central target is to use surface modification to change the wettability [6], manipulating the distribution of different wettability patterns [7, 8], and making a microstructure on surface [9]. On the other hands, carbon nanotube (CNT), which is a hollow-cylinder shape composed of a two-dimensional hexagonal lattice of carbon atoms, attracts attention in this decade for its excellent physical properties, such as electric conductivity, thermal conductivity, and stiffness and stress. In general, CNT is used in the conductive materials in electrical circuit [10], and composition material
Inspired by the pioneers, my motivation is to combine the condensation with simple methods of print CNT, and investigate the heat transfer phenomenon.
1.2 Literature Review
1.2.1 Condensation Heat Transfer Enhancement
The experiment on dropwise condensation have been conducted since 1930.
Schmidt indicated that the heat transfer coefficient of dropwise condensation was one order higher in magnitude than filmwise condensation [4]. However, The theory of dropwise condensation is studied until 1960s, suggested by Le Fevre et a [12]. In 1999, Rose et al made a conclusion that the heat transfer coefficient of dropwise condensation is ten to twenty times than it of filmwise condensation [13]. Due to its potential, numerous researchers devoted themselves into enhancing dropwise
condensation by employing surface modification. Besides, lotus surface, which shown as Figure 1-1 [14], has inspired researchers of the investigation and manufacture of superhydrophobic surfaces. To sum up, the hydrophobic surface can be achieved by ion plating [15], lithography [16], chemical vapor deposition [17], layer-by-layer deposition [18], and chemical coating [19-23].
Among these modified methods, some focused on maintaining the dropwise condensation condition. Vemuri et al used self-assembled monolayer of n-octadecyl mercaptan to produce a hydrophobic surface, showing as Figure 1-2 [24, 25], and found that the condensation heat transfer coefficient SAM (n-octadecyl mercaptan)
by a factor of approximately 1.8 after 2600 h of experimentation for copper alloy surfaces, under vacuum condition in 33.86 kPa. Mondal et al designed a hybrid superhydrophobic–hydrophilic surface, composed of an array of hydrophilic needles on superhydrophobic surface, monitored the droplet growth rate, and demonstrated the 26 and 28 hours wetting condition in Figure 1-3 [26]. Moreover, in Shim et al’s study, a cerium-oxide material was investigated as modified surface on copper, in to improve the thermal stability [27]. Shim et al concluded that after 12 hours test of exposure to the hot steam condition, the cerium-oxide surfaces can remain its original microscope condensation behaviors, leading to stable heat transfer performance compared with the substrate treated with FAS-17
(1H,1H,2H,2H-perfluorodecyltrimethoxysilane) coating, as in Figure 1-4.
In spite of the experimental methods related to the maintenance of hydrophobic surfaces shown above, it is hard to control the wetting conditions as condensation continues. In general, wetting transition [28-30] occurs while condensation goes on, inducing the filmwise condensation, illustrated as Figure 1-5. Some scientists utilize external energy to repel droplets, such as vibrating the condensing surfaces [31-34]
and electrostatic force to driving the droplet movement [35]. In contrast, using
condensing surface with hierarchical structures, as Figure 1-6, showing the
hydrophobic wettability can repel the droplets from the surface more easily and faster.
In Boreykos et al’s study, carbon nanotubes were grown on silicon micropillars
resulting in the self-propelled jumping of condensates, as shown in Figure 1-7 [37].
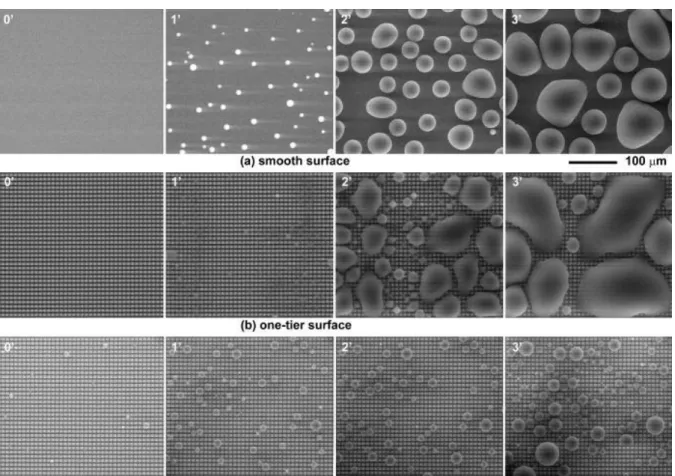
Besides, Chen et al observed that the sizes of droplets decreased on two-tier textured surface compared with smooth one by ESEM in Figure 1-8 [38]. From these aspects, the hierarchical microstructure surface has ability to remove the droplets by itself and minimize the condensate size. Also, the jumping phenomenon is relevant to heat transfer performance.
With the coalescence of droplets, the jumping phenomenon occurs and resulting in more regions to condense. This attracts researchers’ attention to unsterdanding how
to trigger the jumping. So far, scientists find that the coalescence-induced jumping phenomenon is relevant to surface structure, droplet size, and condensate properties [39]. For the most common condition, microstructure has benefit for triggering jumping and enhanced condensation heat transfer. In Figure 1-9, Miljkovic et al utilized nanoscale copper oxide surfaces through CVD to achieve the efficient
jumping phenomenon and condensation heat improvement [6]. He also observed that, with the rising in over-saturation of steam, or heat flux, condensing surface does not
the consequence with the characteristic length and nucleation density, which implies
the much saturation, the less space for nucleation, and more difficult to trigger jumping. In Yan et al’s research, they investigated the droplet jumping dynamics on
nanostructured superhydrophobic, hierarchical superhydrophobic, and hierarchical biphilic surfaces, respectively, by observing droplet velocity and jumping direction.
Besides, they made a diagram indicating the work of adhesion to the available surface energy and contact angle as a function of droplet initial radii, as Figure 1-10 [39].
Accompanying the increase in supersaturation and heat flux, the jumping and coalescence of droplets turns into flooding on condensing surface. Because of that, scientists attempt to control the nucleation sites on surface and prevent the filmwise condition [40, 41]. It is noted that the manipulation of surface morphology to change the nucleating distribution affects the condensing process [42-47]. The patterns on condensing surface could lead to complex wettability, motivating droplets into
combination and growing easily; finally, droplets escape from the surface and the surface enter the next cycle of condensation. In Chatterjee et al’s study, several
circular hydrophilic patterns with hydrophobic based regions are fabricated on copper surfaces. By means of it, he successfully controlled the droplet distribution and
interlaced hydrophobic and hydrophilic regions to conduct experiments. The results they observed shown in Figure 1-13 [44] reveals that the heat transfer coefficient would increase with the decrease in hydrophilic strip length, and generalized the optimum of the width of hydrophobic region. On the other hands, the orientational effects of the condensing surface is another factor to heat transfer. Lee et al from our lab conducted experiments to compare between the horizontal and vertical surfaces, as in Figure 1-14 [7]. He utilized spin coating to fabricate the copper surface, with nanoscale silicon dioxide solution made by sol-gel method, into superhydrophobic surface. Results indicated that the condensing surface is vertical, the heat transfer coefficient increased with decreasing the strip width while for horizontal downward surface showed the converse phenomenon, as in Figure 1-15.
1.2.2 Carbon Nanotube (CNT)
Carbon nanotube attracts attention in this decade for its excellent physical properties and applications. To most applications, CNT is used for its electrical conductivity. In semiconductivity industries, Pacchini et al studied the CNT printed paper with Ag layer to explore the electromagnetic effect on the resonant circuits [48].
Also, several researchers utilized screen printing to print CNT onto substrates as electronic networks [49-51]. On the other hands, thermal enhancement [52, 53] and optical properties are also investigated. Marconnet et al conducted experiments to enhance the thermal conductivity by electroplating CNT films [52]. They concluded that the thermal conductivity after electrodeposition was nearly 3 W/m/K, which is comparatively high for such low density films, as FIgure 1-16. Bera et al utilized simple spraying coating to fabricate the CNT/AlOOH coating, and investigated the absorptance under different temperature and time, as Figure 1-17 [54]. From these studies, it is noted that fabrication methods of CNT are relevant to the applications. As for researches relating condensation, wettability of modified surface is often
considered as the approach.
As for the coating of CNT, wettability is mostly measured as hydrophobicity
droplet impact dynamics of superhydrophobic CNT arrays [56]. They fabricated the surface by vacuum annealing treatment and found the surface had well ability to repel water droplets, as Figure 1-18. Besides, in order to fabricate on metallic surface, heat treatment [53,54, 56] or chemical vapor deposition [58-59] are accompanied by the procedures. But for experimental process, using simple ways to fabricate CNT films or layers is still worth discussing.
1.3 Purpose
From the researches above, it is potential to consider hybrid materials into fabricating coating on condensation heat transfer. Also, effects of simple methods used for CNT coating are rarely discussed. Combining the two factors, in this research, I investigated the effects of different area ratio of CNT film, which was fabricated by rolling printing, and observed the wetting conditions of the condensing surfaces under a close chamber with steam-air mixture. And finally, studied the condensation heat transfer from it.
Figure 1- 1. Lotus surface on leaves. [14]
Figure 1- 2. Contact angle measurement for n-octadecyl mercaptan on the surface before experimentation. [24]
Figure 1- 3. Optical microscope images during condensation. [26]
Figure 1- 4. Calculated overall heat-transfer coefficient of each sample, and the comparison between ceria-Cu and FAS-Cu. [27]
Figure 1- 5. The illustration of wetting transition. [28]
Figure 1- 6. Hierarchical structure surface. [36]
Figure 1- 7. Self-propelled jumping of condensates. [37]
Figure 1- 8. Water vapor condensation on fluoropolymer-coated silicon surfaces in ESEM. [38]
Figure 1- 9. Jumping and flooded condensation. [6]
Figure 1- 10. Ratio of work of adhesion to the available excess surface energy and droplet apparent contact angle as a function of droplet radius
on the hierarchical biphilic surface. [39, S7]
Figure 1- 11. Comparison of droplet distribution between two different circular pattern types. [42]
Figure 1- 12. The highest heat transfer coefficients observed for the patterned condensation surface with various hydrophilic island diameters. [42]
Figure 1- 13. Influence of hydrophobic region width on heat transfer enhancement factor of hybrid surface at different surface subcoolings. [44]
Figure 1- 14. Variation of heat transfer coefficient with wall subcooling for plain and superhydrophobic surfaces. [7]
Figure 1- 15. Additional heat transfer enhancement ratio of various types of modified surface as a function of wall subcooling for the (a) horizontal and (b) vertical surfaces.
[7]
Figure 1- 16. Thermal conductivity as a function of volume fraction for CNT films compared to values reported for measurements for vertically-aligned CNT arrays and
individual nanotubes (volume fraction = 1). [52]
Figure 1- 17. Absorptance of CNT and CNT/AlOOH coatings. [54]
Figure 1- 18. The illustration of microsturcture and droplet movement. [56]
Chapter 2. Theory
2.1 Surface Wettability
2.1.1 Wettability and Contact Angle Theory
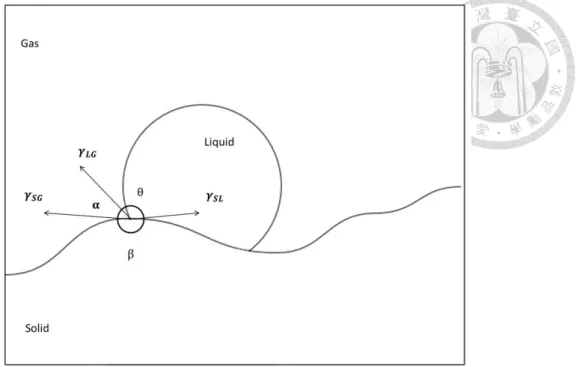
Surface wettability is a characteristic related to the gas, liquid, and solid when wetting phenomenon happens. Besides, the physical mechanism of wetting can be interpreted by tensions between contacting materials; in other words, are the surface tensions of liquid and gas, solid and gas, and solid and liquid, respectively.
More clearly, the wetting phenomenon consists of three types according to the balance of liquid on surface: adhesion, immersion, spreading, as Equation 2.1, 2.2, 2.3,
respectively. [60]
(2. 1)
(2. 2)
(2. 3)
While the liquid is equilibrium, the state of it contacting a solid surface with air around can be illustrated in Figure 2-1; by force balance in Newton’s law, the
following equations are used to describe this equilibrium.
(2. 4)
(2. 5)
(2. 6)
(2. 7)
(2. 8)
, , are angles between three tensions. It is noted that Equation 2.8 means the constraint by force balance. The contact angle " " can be defined as ,
indicating the wetting happens upon a flat surface plane. Moreover, when
。> > 。, the surface has hydrophobic characteristic; in contrast, when < 。, the surface belongs to hydrophilic property. Other definition of superhydrophobic and superhydrophilic characteristics are shown in Table 2-1.
2.1.2 Young’s Equation
Young’s equation considers a situation that droplet stays on flat, smooth, and homogeneous plane without gravitation effect. This model represents an equilibrium state between surface tensions, such as shown in Figure 2-2 and Equation 2.9. ,
, and are interfacial tensions between solid and vapor, solid and liquid, and
surface roughness and the complex micro/nano structure. With such consideration,
Wenzel proposed a theory enabling to describe real wetting model [61].
(2. 9)
2.1.3 Wenzel Model
Wenzel model is illustrated in Figure 2-3, which considers rough structure on the surface. He assumed that the liquid on the surface occupies the tiny gaps and so that completely wets the surface; in other words, the edges becomes only solid-liquid interface. Under this hypothesis, the contact can be obtained as following equation:
(2. 10)
is the contact angle of rough surface; is the contact angle of smooth surface with the same substrate material. means toughness ratio, defined as the ratio of actual contact area to the projected area on substrate surface. Based on Wenzel model, superhydrophobic and superhydrophilic surface can be fabricated via producing nano/ micro scale structure on hydrophobic and hydrophilic surface, respectively.
However, Wenzel model cannot apply under extreme situation such as large contact angle and roughness, supported by Lafuma in 2003 [62]. As for such condition, Cassie and Baxter proposed another wetting model [63].
2.1.4 Cassie-Baxter Model
Compared with in Wenzel model, in Cassis-Baxter model, liquid will not penetrate into the gap but stay on the top structure of surface, leaving un-wetting and air-contacting regions inside the structure. The illustration shows in Figure 2-4;
furthermore, the complex interface between air, liquid, and solid surface can be deduce into Equation 2.11 to describe. is the contact angle for Cassie-Baxter model, while is the smooth contact angle under the same substrate surface and is the area fraction of liquid onto solid surface.
(2. 11)
2.1.5 Partial Wetting Model and Wetting Transition
Whether as for Wenzel model or Cassie-Baxter model, it is crucial to consider the surface roughness and intrinsic contact angle to describe the wetting phenomenon.
Cassie-Baxter model is easier for droplet repelling due to the less contacting area leading to lower surface energy barrier between liquid and solid to overcover. In addition, Miljkovic observed the partial wetting model [64], as Figure 2-5. They concluded that the partial wetting model between Wenzel and Cassie-Baxter model has better heat transfer performance. On the other hands, wetting transition is also an
is related to energy barrier between droplet and contacting surface. Bormashenko concluded the energy barrier between these two model is as following [65]:
(2. 12)
Besides, the growth of droplets depends on the pressure. As growth reaches a level, edges of droplet would changes, which indicates the transition happens. Zheng concluded the critical pressure for the transition, as the following relation [66]:
(2. 13)
Whether controlling microstructure or using external force to stabilize that droplets stay on surface, wetting transition occurs while growth and coalescence continues. It is noted that wetting model turns from dropwise into filmwise wettability as nucleation density rises. As a result, wetting model affects the condensation heat transfer.
Figure 2- 1. Force balance of droplet on a surface.
Figure 2- 2. Illustration of Young’s Equation.
Figure 2- 3. Wenzel Model.
Figure 2- 4. Cassie-Baxter Model
Figure 2- 5. Partial wetting model. [64]
Table 2- 1. Various types of wettability.
Wettability Droplet situation
superhydrophilic ( < 10°)
hydrophilic (90° > > 10°)
hydrophobic (150° > > 10°)
superhydrophobic ( > 180°)
2.2 Condensation Heat Transfer
2.2.1 Stages of Condensation
One cycle of condensation heat transfer can be separated into three stages:
nucleation, growth and coalescence, and removal. The following parts include the discussion of three stages and effects of subcooling degrees.
2.2.1.1 Heterogeneous Nucleation
Heterogeneous nucleation comes from energy absorption which leads to the form of cluster, and induces the phase change. Classical nucleation theory indicates that an energy barrier is overcome; as following, the nuclei formation happens. The energy barrier equation is shown as following:
(2. 14) is the equilibrium and minimum radius for the nuclei, in order to further condensate
and grow the droplets. can be determined by the following [67]:
(2. 15)
Besides, the nucleation rate can be obtained by:
(2. 16)
is the nucleation constant, which depends on the material, is Boltzmann constant,
energy barrier is dramatic because of the exponential relation in the equation; in addition, the wettability affects the energy barrier. Also, the wall temperature is another factor. As the wall temperature increases, meaning the wall subcooling temperature decreasing, the nucleation rate declines, and vice versa.
2.2.1.2 Growth and Coalescence
After the nucleation, the nuclei start to turn into droplets, and follows the two stages to condensate: growth and coalescence. The first stage results from the cluster of molecules nearby, which occurs after the nucleation immediately. Besides, with the higher surface area of the nuclei, the the higher the growth rate is. The second stage happens as the size is big enough for the contact between droplets nearby, adjacent droplets combining, and then droplet continues growing up. In 1995, Beysens pointed out the relation between radius of droplet and time as following [68]:
(2. 17)
The regime of droplet growth is precisely different in the first and second stages, which induces that the η is distinct. Figure 2-6 shows that the mean droplet radius change with time deduces the distinct value η corresponding to growth and
the gravitational or external force applying on the droplet overcomes the surface tension. From these mechanism, the more rapid of growth and coalescence leads to the more efficient condensation heat transfer; in other words, the reduction of the duration in condensing cycle is better.
2.2.1.3 Removal
From the description of the last paragraph, the removal occurs in the end of he condensing cycle. In general, gravity is the external force applying on the droplet; in addition, gravity increases with the growth of the droplet. The force can be obtained from the following equations [69]:
(2. 18)
(2. 19)
and are gravitational force along with and perpendicular to the axial direction, respectively, where is the density of droplet, is the gravitational
acceleration, r is the radius of droplet, is the contact angle, is the inclined angle of tube, and is the azimuthal angle. The external forces, related to the angles defined
as above, applied on the tube are shown as Figure 2-7 [69].
Besides, the viscous force on the droplet can be determined as following [69]:
(2. 20)
advancing angle of the droplet.
Based on the Equation 2.19 and 2.20, the repelling radius of droplet on the tube can be determined as following:
(2. 21)
While is 。and 。, Equation 2.21 becomes:
(2. 22)
which corresponds to our experimental situation.
coalescence stages. [28]
Figure 2- 7. The external forces applied on the tube. [69]
2.2.2 Effects from Non-condensable Gas (NCG)
Non-condensable gas play another factor to condensation. While condensing, droplets form and emerge upon the surface, which would be obstructed and slow down by the boundary layer from non-condensable gas. Moreover, this phenomenon happens as surface subcooling degree increases, inducing the less efficient heat transfer. The diffusion mechanism of gas inside the condensing environment is simulated by the vapor pressure, or the saturation pressure. As NCGs flow into the regions between the the atmosphere and the surface, gas boundary layer forms and causes the impediment in condensation, which illustrated as Figure 2-8. Also, heat resistance from the boundary layer affects the heat transfer.
Ma et al found that the 1% increase in the concentration of NCGs leads to the decrease in heat flux [70]. However, they observed the coalescence and removal of droplets disturbs the boundary layer. Besides, Wen et al studied the effect of
enhancement in condensation from this disturbance [71]. They used the hydrophilic surface with hydrophobic bumps to trigger the falling droplets, disturb the NCG boundary layer, and increase water vapor diffusion, as Figure 2-9.
To sum up, the dropwise condensation has better performance than the filmwise
other words, the condensation heat transfer resulting from hybrid coated surface.
Figure 2- 8. The Illustration of NCGs boundary layer.
Figure 2- 9. Hydrophilic surface with hydrophobic bumps to enhance the droplet falling. [71]
Chapter 3. Experiments
3.1 Surface Modification
3.1.1 Chemical and Materials
1. Deionized water
2. MWCNT---AC tube-030(>98%)
From: Golden Innovation Business co.,Ltd.
3. Methanol (99.9%)
From: ECHO Chmical co. Ltd.
4. Hardener---NS150
From: Photo.cure co., Ltd 5. Acetone (99.9%)
From: UNI-ONWARD Corp.
3.1.2 Equipment
To prepare the CNT ink
1. Ultrasonic cleaner---Bransonic 3510 From: Barsonic
2. Electronic scale---GX400 From: A&D co., Ltd.
To prepare and polish the copper surface 1. Sandpaper #800, #1000, #1200, #2000 2. Acetone safety wash bottle
From: Chuan Chi Trading co., Ltd.
To conduct the surface modification 1. Furnance---Hong Sen HS-101
From: Chung Chuan 2. Tape mask
3. Holder
From: NTU Mechanical Workshop To measure the parapeters
1. Contact Angle Goniometer---Model100SB From: Sindatek
2. Electronic scale---GX400 From: A&D co., Ltd.
3.1.3 Procedures
Surface preparation
acetone are used to wash the polished surface, and then the copper cylinder was sent into the furnace for drying. After cleaning the surface, tape mask is used to produce the different types of modification. In this study, to investigate the printed area of total condensing surface is the main factor, which is to compare the effect of 0% (plain copper), 30%, 50%, 70%, and 100% (all printed copper). The total length of
condensing area is 30cm; thereby, the corresponding printing length (m) of 30%, 50%, 70% types are 10cm, 17cm, and 20cm, which is illustrated as Figure 3-1 and Table 3-1. The wider the printing length ( ) is, the smaller the plain area is. Besides, the
contact angle (CA) and the printed weight were measured and listed as Table 3-1. The 100% printed cylinder is shown in Figure 3-2.
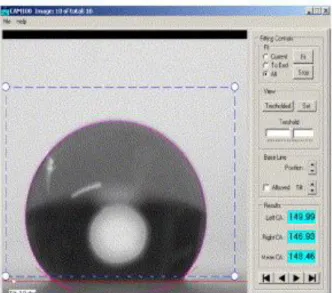
As for the parameters measured, the first one to be discussed is the contact angle (CA), which is measured with contact angle goniometer. Initially, normal copper surface is hydrophilic with CA around 75°. However, for plain area after cleaning, the wettability is hydrophobic with CA around 107 °, while the printed area is relative hydrophilic with CA around 76 °. It is noted that the surface roughness of printed area is nonuniform in microscale due to the printing procedure; as a result, the printed weight were recorded by electronic scale in order to make sure the ink printed on the copper surface is reasonable corresponding to area ratios. The next step is to prepare
Ink preparation and cylinder printing
The ink is composed of MWCNT, as the solute, the hardener, as the solvent, and methanol, as the dispersion. To begin, add MWCNT into the hardener to prepare the viscous solution with the proportion 1 gram: 0.1 gram. Then use the ultrasonic cleaner as Figure 3-2 to degas the solution. After stirring and degas add methanol into the solution with proportion 1.1g of solution: 0.5 milliliter of methanol. Then use the ultrasonic cleaner to degas again. After degased and stirring, the ink is prepared to print the copper cylinder.
Before printing, I designed a holder to make sure the polishing and printing is under stable circumstance. The design is shown in Figure 3-3 made of bearings and aluminium alloy plates. The prepared ink was put on a rectangle plate; then, this plate was set below the held cylinder and between the holder walls. Pushing the inked plate to rolling print the cylinder surface ink, the cylinder surface would be covered with the ink. After printing, the cylinder was sent into furnace for 30 minutes to dry the ink.
At last, the printed was prepared to conduct the experiments.
Figure 3- 1. Illustration of different types of printed area ratio on cylinder surface.
Table 3- 1. List of the surface types and corresponding parameters.
Types Printing length (m)
Half Plain length (l)
CNT ink weight
CA of CNT printed area
CA of plain copper
0% (Plain) 0 mm 30 mm 0 g ~76 ° Before
cleaning:75 ° After
cleaning:
~107 °
30% Printed 9 mm 10.5 mm 0.12 g
50% Printed 15 mm 7.5 mm 0.215 g
70% Printed 21 mm 4.5 mm 0.428 g
100%
Printed
30 mm 0 mm 0.586 g
Figure 3- 2. The 100% printed cylinder.
Figure 3- 3. The ultrasonic cleaner.
Figure 3- 4. The design of holder.
3.2 Thermal System
3.2.1 Equipment
1. Data logger system---MX100 From: Yokogawa
2. Thermocouple---Type T & Type K From: Chuan Chi Trading co., Ltd.
3. Digital camera---LY35862-001A From: JVC
4. Pressure transducer---DPG3.0 From: Atlantis
5. Cooling circulator bath---B401H From: Firstek
6. Silicone glue---Permatex #82180 From: Chuan Chi Trading co., Ltd.
7. Thermal grease---EG30 From: Electrolube
8. Flow meter---H400M & FBCVSW50C
From: Dr. Anti-fog
10. Condensing chamber and copper cylinders From: Chuan Chi Trading co., Ltd.
11. Steam generator
From: Chuan Chi Trading co., Ltd.
3.2.2 Setup and Procedures
Equipment setup
The experimental set is shown as Figure 3-4. The copper cylinder (Figure 3-5) was put into the chamber (Figure 3-6) with the corresponding holes on both side walls.
Seal the gaps between cylinder and chamber with the silicone glue (Figure 3-7); then dry it for 3 hours. The aluminum container and observing window covered with
anti-fog sheet (Figure 3-8) were assembled into the condensing chamber. To be further, the chamber was connected to the steam generator (Figure 3-9) and cooling circulator bath (Figure 3-10) by pipe fittings and tubes.
Besides, for measuring temperatures and pressures, thermocouples and pressure were esd in the experiments. T type of thermocouples (Figure 3-11) covered a few thermal grease (Figure 3-12) were inserted into the holes beside the copper cylinder while K type of them (Figure 3-13) were connected with the tees. All thermocouples
fit into the chamber in order to measure the pressure of insider the experimental space.
After connection, the experimental setup was ready for condensation.
Experimental procedures
Turn on the steam generator, cooling circulator bath with 20 °C setting and 50 cc/min of flow rate, and data logger system with the valve between the generator and
chamber closed. Then wait for the water achieving boiling. As the temperatures of the cylinder and steam generator reached stable value, the valve was opened to let the steam flowing into the chamber. After opening, the temperature measured would be rising dramatically with tiny droplets emerging on the surface; in the meantime, images and videos started to be recorded to compare the forming conditions between different types of cylinders. As the temperatures reached stable values, increase the flow rate with 10 cc/min to increase the subcooling degrees; then record the stable values again. By repeating the steps of controlling flow meter and recording temperatures, the subcooling degrees can be observed and recorded for all types of cylinders.
Pressure measurement
The pressures were observed during the whole experiment. In order to
(3. 1)
Temperature measurement and data reduction
The temperatrues measured location was shown as Figure 3-15. is the water temperature on outlet, meaning the right side, while is the water
temperature on the inlet, the left side; on the other hand, to were measured to deduce the subcooling degree .
In order to determine , I calculated it as the following steps. Firstly,
and were calculated by Equation 3.2 and 3.3, respectively, so that I obtained the mean temperatures on both sides; then, using Equation 3.4, the heat transported out by cooling system ( ) can be obtained by , , and ṁ,
the mass flow rate of cooling water measured from the flow meter.
(3. 2)
(3. 3)
(3. 4)
Moveover, the heat transported in lateral direction inside the cylinder ( ) is from Equation 3.5. is the thermal conductivity of copper, is the
cross section area of the cylinder, and is the distance between the thermocouples on two sides.
(3. 5)
Once the heat was decided, the average heat flux can be solved by
Equation 3.6 so as the wall temperature by Equtaion 3.7. is the
condensation area, and are radius from the central line to the outer surface and the location of thermocouples, respectively, while is the length of condensing area.
(3. 6)
(3. 7)
At last, the subcooling degree and heat transfer coefficient can be determined from Equation 3.8 and 3.9, respectively.
(3. 8)
(3. 9)
3.3 Error Analysis
Error analysis was estimated from Taylor [72]. With the following equations, the uncertainty of , , , , can be determined.
(3. 10)
(3. 11)
(3. 12)
(3. 13)
(3. 14)
Figure 3- 5. Experimental setup.
Figure 3- 6. The copper cylinder. (L is the length of condensing area, as blue frame
Figure 3- 7. The condensing chamber.
Figure 3- 9. The anti-fog sheet.
Figure 3- 11. The cooling circular bath.
Figure 3- 12. The T type thermocouple.
Figure 3- 13. The thermal grease.
Figure 3- 15. The data logger system.
Figure 3- 16. The illustration of the temperature measured location.
Table 3- 2. The uncertainty of . Tsub (°C)
3 6 9
Surface types
Plain 1.46% 0.84% 0.52%
All printed 5.01% 3.35% 2.02%
30% printed 1.04% 0.91% 1.06%
50% printed 1.68% 1.14% 1.16%
70% printed 1.68% 1.28% 1.16%
Table 3- 3. The uncertainty of . Tsub (°C)
3 6 9
Surface types
Plain 9.09% 10.36% 11.43%
All printed 3.45% 3.31% 2.20%
30% printed 6.45% 7.69% 8.33%
50% printed 3.20% 9.00% 15.38%
70% printed 4.12% 5.26% 7.55%
Table 3- 4. The uncertainty of . Tsub (°C)
3 6 9
Surface types
Plain 9.21% 10.37% 11.44%
All printed 6.08% 4.70% 2.98%
30% printed 6.54% 7.73% 8.40%
50% printed 3.62% 9.02% 15.43%
70% printed 4.45% 5.42% 7.64%
Table 3- 5. The uncertainty of . Tsub (°C)
3 6 9
Surface types
Plain 9.53% 10.40% 11.48%
All printed 6.62% 4.95% 3.16%
30% printed 7.09% 7.83% 8.48%
50% printed 4.73% 8.04% 15.45%
70% printed 5.41% 5.63% 7.71%
Table 3- 6. The uncertainty of . Tsub (°C)
3 6 9
Surface types
Plain 13.25% 15.46% 16.21%
All printed 8.99% 6.83% 4.35%
30% printed 9.64% 10.90% 11.93%
50% printed 5.95% 15.61% 21.83%
70% printed 7.00% 7.81% 10.85%
Chapter 4. Results and Discussion
4.1 The Condensation Effect of CNT Printing on the Copper
At first, I investigated the effects between plain and all printed cylinders. From Figure 4-1, The heat transfer coefficient of plain copper significantly has higher values than 100% printed one during the lower interval of subcooling degrees (Tsub), which is around 0 to 7.5 °C, while the two curves approach the steady with increasing Tsub. The declining trends result from the increasing thickness of NCGs boundary layer upon the condensing surface. The reason is illustrated as Figure 4-2. With Tsub increasing, the more heat can be transferred by the cylinder, resulting the more condensates nucleated and the less partial pressure of vapor near the condensing surface, and that is, the higher partial pressure of NCGs. In other words, the boundary layer of NCGs was getting thicker, blocking the nucleation from vapor, and inducing the rising thermal resistance.
Figure 4-1 also indicates that the heat transfer of 100% printed cylinder is not influenced by Tsub for most time. Observed from real image recorded as Figure 4-3, the condensate distribution appears as filmwise during the most interval of Tsub, while a few tiny droplets appear at lower interval. With such phenomenon, the whole
Besides, wetting transition occurs with heat flux changes during the rise in subcooling degree. Figure 4-4 is the condensation heat flux with changes in Tsub.
From basic heat transfer theory, the increase in Tsub corresponds to that the more heat can be transferred, meaning the more heat flux from condensation. However, the more heat flux induces the higher nucleation density on the surface. This will make the
coalescence of tiny droplets happen, and the wetting condition changes from dropwise situation into filmwise situation, which is as Miljkovic et al’s observation [6]. During
this transition, heat flux changes go gentle due to nonuniform distribution of growth and coalescence, which corresponds to 5 to 7 °C of the plain and 8 to 13 °C of the 100%. Over the transition, condensates on the surface appeared as uniform liquid film, allowing the steady increasing heat transfer.
Figure 4- 1. Heat transfer coefficient distribution of plain and 100% printed cylinder with subcooling degree.
Figure 4- 2. The illustration of nucleation from vapor with changes of subcooling
Figure 4- 3. Experimental images of plain and 100% printed copper cylinders: (A) plain (B) 100%.
Figure 4- 4. Heat flux distribution of plain and 100% printed cylinder with subcooling degree.
4.2 The Condensation Effect of Different Area Ratio
The experimental result of heat transfer coefficient for three partial printed copper cylinders is shown in Figure 4-5. The different area ratio of printed surface rarely affects the heat transfer coefficient; however, the heat flux distribution is quite different. The experimental results of heat flux for three partial printed copper
cylinders is shown as Figure 4-6. At first, in the low subcooling degree (Tsub) interval, around 0 to 5 °C, three lines show the rising trend, corresponding to the higher
nucleation density changes. However, the rising trends turn into declines, and then approach steady values.
For partial printed types, the droplets size and distribution on plain surface is closely related to the droplet dynamic. In other words, the area ratios of printed and plain area to the totals affected the droplet movement. Initially at low Tsub, the plain area dominates the heat flux, so that 30% printed type has higher values than other two. During the middle interval of Tsub (around 5 to 10 °C), the wetting transition happens on the printed and plain areas, inducing the gentle trend. As for the declines of the three types, area ratio coupled with film condensate staying on surface
significantly obstructed the heat flux.
Observed from the experimental images in Figure 4-7, because the CNT printed area is relatively hydrophilic, the increase in printed area ratio makes the droplet movement in horizontal direction more easier. As the growing droplet on plain surface attaches the condensates on printed surface, it would move toward the hydrophilic area due to surface tension, and new bare space will exist for the next nucleation. Because of this phenomenon, the more plain area leads to the less coalescence of droplets toward the printed area, and the more growth of droplets on the plain area. However, as increase in Tsub, nucleation density is coupled with the effect of printed area ratio.
Effects of nucleation changes and wetting transition
For the 30%, less droplets moved into printed area; moreover, due to the less printed area, the 30% limited the amount of condensates to move and affected the coalescence of droplets. As for the 70%, there is less enough area for nucleation on plain surface; in other words, for most time, condensates on the cylinder appeared as the filmwise. In the interval of high Tsub, the liquid film stayed on the surface for a longer time, and was difficult to fall out, which obstructed heat transfer enhancement.
For the 50%, the area ratio enhanced the heat flux transfer from 0 to 4 °C of Tsub, and the rise goes gentle with wetting transition happening, just as the plain and the
area could move toward the hydrophilic area with appropriate balance. However, with the increase of Tsub, liquid film, or the flood, fully appeared in most surface of cylinder. Furthermore, the time when liquid staying on the printed area is longer than on the plain one. That is to say the non-uniform distribution surface obstructs the heat transfer and even worsen it, corresponding to the decline on the 50% in Figure 4-7.
Figure 4- 5. Heat transfer coefficient distribution of partial printed cylinders with subcooling degree.
Figure 4- 6. Heat flux distribution of partial printed cylinderswith subcooling degree.
Figure 4- 7. Experimental images of partial printed copper cylinders: (A) 30%, (B) 50%, and (C) 70%.
4.3 The Discussion in Enhancement of Heat Transfer in Partial Tsub
From the discussion about the effects of CNT printing and area ratio, the changes of heat transfer coefficient are relevant to NCGs boundary layer. On the other hands, the changes of heat flux are associated with wetting condition and homogeneous surface distribution. However, the values between partial types and the plain could be explained from another aspect. Here, I discussed the comparison between plain, 30%
printed, and 100% printed types. The overall result of heat transfer coefficient (hcond) with subcooling degree (Tsub) is shown as Figure 4-8. To be discussed in detail as Figure 4-9, within the lower interval of Tsub (around 0 to 8 °C), the values of the 30%
are higher than the ones of the plain. This resulted from the mechanism of disturbance inside the NCGs boundary layer. Firstly, from Chapter 2.2.3, the coalescence and removal of droplets would disturbs the NCGs boundary layer and make the nucleation more easier and rapidly. In addition, the CNT printed area appears as the relatively hydrophilic regions and motivate the movement of droplets toward this area. As droplets form or flow near the edges of printed and plain areas, they will move into the printed area, leading to the bare regions for the next nucleation. In the meantime,
as shown in Figure 4-10. Discussed on last part, as Tsub increased, nucleation changes induced into wetting transition, and flood, which worsens the heat flux.
Figure 4- 8. Heat transfer coefficient distribution of plain, 30% printed, and 100%
printed cylinders with subcooling degree.
Figure 4- 9. Heat transfer coefficient distribution of plain, 30% printed, and 100%
printed cylinders with subcooling degree in 0 to 8 °C.
Figure 4- 10. Heat flux distribution of plain, 30% printed, and 100% printed cylinders with subcooling degree.
Chapter 5. Conclusion and Future Prospects
5.1 Conclusion
From the results in last chapter, the heat transfer performance of the CNT printed copper cylinder is various depending on the printed area ratio. From Figure 3-2, the CNT printed area is rough in macro-scale, which leaded to different wettability compared with lecture review [55-57]. However, the hydrophilic pattern had benefits to the heat transfer during some subcooling degrees.
For the all printed cylinder, the heat transfer coefficient and heat flux values are lower than the plain cylinder. In other words, the effects of all-CNT printing are worse due to the hydrophilic wettability. However, the declining trend with
subcooling degrees is quite slowly, which means that the hydrophilic CNT printing has better stability in heat transfer performance than plain plane.
The changes in printing area ratio clearly influenced the heat performance.
Firstly during low interval of subcooling degrees (0 to 5 °C), 30% printed cylinder has higher heat transfer coefficient than other two. However, for 50% printed cylinder, the heat flux valuses stayed stable than 30% printed one in middel interval (5 to 8 °C).
As for 70% printed cylinder, the value changes are close to all printed one. Three types showed declines with high interval of subcooling in heat flux (> 8 °C).
The enhancement phenomenon in heat transfer coefficient happened during the subcooling degrees from 0 to 8 °C. The reason resulted from the hybrid area. Due to the hydrophilic area, droplet movement contains vertical and horizontal directions, which benefits the new cycle of condensation. Moreover, the coalescence and disturbs the NCGs boundary layer.
To sum up, the CNT printing is a fast way to coat on cylinder or other shapes, which could benefit the other research fields. Even the total heat transfer performance of CNT printed cylinder is worse than plain one, partial enhancement shows the CNT material has potential for improvement.
5.2 Future Prospects
Condensation heat transfer is a field worth research. Based on this study of CNT printed cylinder, the future prospects are shown as following.
1. The wettability of CNT modification on copper material could be improved by means of post processing, such as annealing, laser treatments, and so on.
2. The atmosphere of condensation in this study is not perfect for heat transfer. If the concentration of NCGs decreases, the heat flux would accordingly
Figure 5- 1. Heat transfer coefficient distribution of all cylinders with subcooling degree.
Figure 5- 2. Heat flux distribution of all cylinders with subcooling degree.
Reference
[1] S. W. Sharshir, G. Peng, N. Yang, M. O. A. El-Samadony, and A. E. Kabeel, "A continuous desalination system using humidification - dehumidification and a solar still with an evacuated solar water heater", Applied Thermal Engineering, vol. 104, pp.
734-742,2016.
[2] J. M. Beer, "High efficiency electric power generation: The environmental role", Progress in Energy and Combustion Science, vol. 33, pp. 107-134, 2007.
[3] G. Jin, K. S. Lee, and B. Seo, "Characteristics of condensation formation on the surfaces of air conditioning indoor units", Applied Thermal Engineering, vol. 91, pp.
345-353, 2015.
[4] E. Schmidt, W. Schurig, and W. Sellschopp, "Condensation of water vapour in film and drop form", Zeitschrift Des Vereines Deutscher Ingenieure, vol. 74, pp.
544-544, 1930.
[5] J. W. Rose, "Dropwise condensation therory and experiment: a review", Proceedings of the Institution of Mechanical Engineers Part a-Journey of Power
and Energy, vol. 216, pp. 115-128, 2002.
[6] N. Miljkovic, R. Enright, Y. Nam, K. Lopez, N. Dou, J. Sack, and E. N. Wang,
[7] Y. A. Lee, L. S. Kuo, T. W. Su, C. C. HSU, and P. H. Chen, "Orientation effects of nanoparticle-modified surfaces with interlaced wettability on condensation heat transfer", Applied Thermal Engineering, vol. 28, pp. 1054-1060, 2016.
[8] J. L. Oestreich, C. W. M. van der Geld, J. L. G. Oliveria, and A. K. da Silva,
"Experimental condensation study of vertical superhydrophobic surfaces assisted by hydrophilic constructal-like patterns", International Journal of Thermal Sciences, vol.
135, pp. 319-330, 2019.
[9] S. H. Hoening and R. W. Bonner, III, "Dropwise condensation on
superhydrophobic microporous wick structures", Journal of Heat Transfer, vol. 140, pp. 071501-1-071501-7, 2018.
[10] A. Bachtold, P Hadley, T Nakanishi, and C. Dekker, "Logic circuits with carbon nanotube transistors', Science, vol. 294, pp. 1317-1320, 2001.
[11] T. Qiao, C. M. Li, S. J. Bao, and Q. L. Bao, "Carbon nanotube/polyaniline
composite as anode material for microbial fuel cells", Journal of Power Sources, vol.
170, pp. 79-84, 2007.
[12] E. J. Le Fevre and J. W. Rose, "A theory of heat transfer by dropwise
condensation", Proceedings of the Third International Heat Transfer Conference, vol. 2, pp. 362-375, 1966.
479-485, 1999.
[14] C. Neinhuis and W. Barthlot, "Characterization and distribution of
water-repellent, self-cleaning plant surfaces", Annals of Botany, vol. 79, pp. 667-677, 1997.
[15] Q. Zhao, D. C. Zhang, and J. F. Lin, "Surface materials with dropwise
condensation made by ion implantation technology", Heat Mass Transfer, vol. 34, pp.
2833-2835, 1991.
[16] D. Oner and T. J. McCarthy, "Ultrayhydrophobic surface. Effects of topography length scales on wetability", Langmuir, vol. 23, pp. 7293-7298, 2007.
[17] A. T. Paxson, J. L. Yague, K. K. Gleason, and K. K. Varanasi, "Stable dropwise condensation for enhancing heat transfer vis the initiated chemical vapor deposition (iCVD) of grafted polymer films", Advanced Maerials, vol. 26, pp. 418-423, 2014.
[18] J. Bravo, L. Zhai, Z. Z. Wu, R. E. Cohen, and M. F. Rubner, "Transparent superhydrophobic films based on silica nanoparticles", Langmuir, vol. 23, pp.
7293-7298, 2007.
[19] D. W. Tanner, D. West, D Pope, and C. J. Potter, "Promotion of
dropwisecondensation by monolayers of radioactive fatty acids .I, stearic acid on
"The useof organic coatings to promote dropwise condensation of steam", Journal of Heat Transfer-Transactions of the ASME, vol. 109, pp. 768-774, 1987.
[21] A. Taniguchi and Y. H. Mori, "Effeciveness of composite copper graphite fluoride platings for promoting dropwise condensation of steam - a
Preliminary-Study", International Communications in Heat and Mass Transfer, vol.
21, pp. 619-627, 1994.
[22] R. Gupta, V. Vaikuntanathan, and D. Sivakumar, "Superhydrophobic qualities of an aluminum surface coated with hydrophobic solution NeverWet", Colloids and Surfaces A: Physicochemical and Engineering Aspects, vol. 500, pp. 45-53, 2016.
[23] A. V. Rao, S. S. Latthe, S. A. Mahadik, and C. Kappenstein, "Mechanically stable and corrosion resistant superhydrophobic so-gel coatings on copper substrate", Applied Surface Science, vol. 257, pp. 5772-5776, 2011.
[24] S. Vemuri, K. J. Kim; B. D. Wood, S. Govindaraju, and T. W. Bell, "Long term testing for dropwise condensation using self-assembled monolayer coatings of n-octadecyl mercaptan", AppliedThermal Engineering, vol. 26, pp. 421-429, 2006.
[25] S. Vemuri and K. J. Kim, "An experimental and theoretical study on the concept of dropwise condensation", International Journal of Heat and Mass, vol. 49, pp.
649-657, 2006.
![Figure 1- 9. Jumping and flooded condensation. [6]](https://thumb-ap.123doks.com/thumbv2/9libinfo/9597975.628323/27.892.166.785.110.403/figure-jumping-flooded-condensation.webp)