Department of Life Science, National Taitung University Master Thesis
Advisor: Chun-Lin Lee, Ph.D.
Investigating the effect of different mineral composition of deep ocean water on the regulation of blood lipid in
the hamsters fed with high cholesterol diet
Master’s student: Kao-ko Lin
107 1
January, 2018
( Deep ocean water, DOW )
DOW
DOW Mg2+
(D) (D-
L-NaK) (D-L-Ca)
DOW DOW
total cholesterol (TC) low density lipoprotein-cholesterol (LDL-C)
aspartate transaminase (AST) D-L-NaK DOW
TC triglyceride (TG)
(p < 0.05) DOW
superoxide dismutase catalase D-L-
NaK DOW TC
DOW Mg2+ Ca2+
DOW
Abstract
A cholesterol-rich diet can induce hyperlipidemia, which increases free fatty acids in the serum, causing the liver to synthesize and store excessive triglycerides. Excess fat accumulation in the liver can lead to steatosis and nonalcoholic fatty liver disease.
Pure and low-temperature deep ocean water (DOW) is known to be rich in minerals and nutrients, which according to numerous studies have multiple health benefits.
These include lowering blood lipid level and blood pressure, suppressing metastatic breast cancer, and increasing resistance to fatigue, as well as improving obesity, diabetes, cardiovascular diseases, and skin conditions. Furthermore, the literature indicates that the magnesium ions in DOW can effectively alleviate cardiovascular diseases, but how DOW of varying mineral compositions differs in the control of blood lipid levels remains unclear. The present study compared how the DOW, DOW with low sodium and potassium, DOW with low calcium, differed in their effects on blood lipid level. An in vivo test was conducted in which hamsters were fed with a cholesterol-rich diet, and after they developed hyperlipidemia, they were fed with DOW, DOW with low sodium and potassium, DOW with low calcium for 8 consecutive weeks to observe how their blood lipid levels varied. The results indicated that DOW can significantly lower high total cholesterol (TC) and low-density lipoprotein cholesterol (LDL-C) levels induced by a cholesterol-rich diet; furthermore, DOW can also lower aspartate transaminase (AST) levels, which is an indicator of liver inflammation. Overall, magnesium, calcium DOW was determined to be the most effective at lowering TC and triglyceride levels, and it was also significantly effective (p > .05) at reducing hepatic lipid peroxidation and removing artery plaque. Regarding antioxidant enzyme activity, the three types of DOW were discovered to be effective at raising the activity of superoxide dismutase and catalase in hamster livers. In summary, magnesium, calcium DOW was the most effective at regulating blood lipid level because it surpassed the other two in lowering the TC level, artery plaque removal, and raising antioxidant enzyme activity. This suggests that the interaction between Mg2+
and Ca2+ may be key to the effectiveness of DOW in regulating blood lipids and antioxidizing the liver.
ACC(acetyl-CoA carboxylase) A ALT(alanine transaminase)
AMPK(5′-adenosine monophosphate-activated protein kinase) 5′
AST(aspartate transaminase) CAT(catalase)
DOW(deep ocean water) GPx(glutathione peroxidase) GRd(Glutathione reductase) GSH(glutathione)
HDL-c(high density lipoprotein cholesterol) LDL-c(low density lipoprotein cholesterol) MDA(malondialdehyde)
ROS(reactive oxygen species) SOD(superoxide dismutase) TC(total cholesterol)
TG(triglyceride)
VLDL-c(very low density lipoprotein cholesterol)
... I ABSTRACT ... II ... III ... IV ... VI ... VII
... 1
... 2
... 2
... 2
... 2
... 3
... 5
... 5
... 6
... 6
... 6
... 9
... 9
DOW ... 11
DOW ... 11
DOW Mg Ca Mg Ca ... 11
Mg Ca ... 11
DOW ... 12
... 13
... 13
... 13
... 15
... 16
... 18
... 18
... 18
... 18
(sacrifice) ... 21
... 21
TC TG ... 21
(thiobarbituric acid reactive substances, TBARS) ... 23
... 23
... 24
... 25
... 25
... 25
... 26
... 26
... 30
DOW Na Ca K Mg ... 32
... 35
... 35
H&E ... 39
... 39
... 42
... 47
... 47
... 47
... 48
... 48
... 49
... 51
3- 1 ... 17
3- 2 (g/kg diet) ... 18
3- 3 Syrian ... 20
4- 1 ... 27
4- 2 / ... 28
4- 3 ... 29
4- 4 / ... 32
4- 5 AST ALT ... 33
4- 6 ... 34
4- 7 38 6- 1 ... 50
1- 1 ... 8 2- 1 ... 14
4- 1 ... 36
4- 2 . 37
4- 3 (400 x) ... 40
4- 4 ... 41
4- 5 superoxide dismutase
... 43
4- 6 catalase ... 44
4- 7 glutathione peroxidase
... 45
4- 8 Glutathione reductase
... 46
(deep ocean water DOW) (thermocline)
DOW DOW
(Bak et al., 2012; Fan et al., 2016; Hwang et al., 2009; Sheu et al., 2013; Yang et al., 2014)
(Musso et al., 2003)
(Tessari et al., 2009) 106
( 2016)
Syrian
DOW
probucol total
cholesterol (TC) triglyceride (TG) high-density lipoprotein cholesterol (HDLC) low-density lipoprotein cholesterol (LDL-C)
TC TG DOW
DOW
glutathione reductase (GRd) glutathione peroxidase (GPx) catalase (CAT)
superoxidase dismutase (SOD) DOW
DOW
(deep ocean water, DOW) (thermocline)
3700 93%
1.3*109 ( )
DOW (Hwang et al., 2009)
( ) DOW
DOW DOW
DOW (Othmer
& Roels, 1973) 200 m DOW
200 m DOW
DOW DOW
( )
200 m
DOW 200 m
(Othmer & Roels, 1973)
( )
(Nigari) (reverse osmosis,
RO) ( )
(electro dialysis, ED)
SPA
( ) Na+ Mg2+ Ca2+ K+
Mg2+ Ca2+
(Luoma et al., 1983) Mg2+ Ca2+
Mg2+
(Larsson et al., 2012) (Kishimoto et al., 2010)
90
DOW DOW
( )
2013 Chen
300 900 1500 DOW `
(triglyceride, TG) (total
cholesterol, TC) (Chen et al., 2013)
DOW DOW 5′-adenosine
monophosphate-activated protein kinase (AMPK) acetyl-CoA carboxylase (ACC)
(Sheu et al., 2013) DOW
(low-density lipoprotein-cholesterol, LDL-C) DOW
DOW ob/ob
1000 DOW 84 84 DOW 7%
35.4%
4 (glucose transporter 4, GLUT4) p-AMPK PPARγ adiponectin
(Hwang et al., 2009)
( ) DOW
(Kou, 2012) DOW
500 g DOW 80 mL pH 3 ~ 4
moanscin amkaflavin citrinin ( , 2010)
DOW
(Shin, 2016)
( )
DOW 2002
500 mL DOW
IgE IL-4 IL-13 IL-18 (Kimata et al., 2002) Hataguchi
DOW K+ Se2+
Hg2+ Pb2+ 33 27
(Atopic eczema/dermatitis syndrome,AEDS) (Hataguchi et al., 2005) 2,4-dinitrochlorobenzene (DNCB) NC/Nga
DOW DNCB IgE
TNF-α IL-1β IL-6 CD4+/CD8+
T (T helper cells, Th) IL-4 IL-10 Th2 Th2 DOW IL-4 IL-10 (Bak et al., 2012)
( )
DOW
(superoxidase dismutase, SOD) (Glutathione peroxidase, GPx)
ICR (Fan et al., 2016)
( )
DOW
(Yang et al., 2014)
1 (Magnesium, Mg) DNA RNA
(Cohen et al., 2002)
250 mg 2 (Calcium, Ca)
°
3 (Selenium, Se)
( ., 2002)
4 (Iron Ferrum, Fe)
5 (Zine, Zn) DNA RNA
10 ~ 15 mg
6 (Potassium, K) 2 ~ 4 g
(Laurant & Touyz, 2000) (Khan et al., 2010)
Vaskonen Mg2+ Ca2+
(Vaskonen et al., 2001)
(low density lipoprotein cholesterol, LDL-C)
(Fruchart Duriez, 1998; Lusis, 2000) Steinberg (oxidative LDL, oxLDL)
(Steinberg et al., 1989) (EC)
EC LDL-C (Baumer et al., 2017)
(world health organization,
WHO)
I (chylomicron, CM) TG
IIa LDL-C
IIb LDL-C
(very low-density lipoproteincholesterol, VLDL-C) TG
III (chylomicronremnants)
(intermediate-density lipoproteincholesterol, IDL-C) TC TG
IV VLDL-C TG
LDL-C
V CM VLDL-C TG
VLDL-C TG
VLDL
VLDL-C LDL-C (high density
lipoprotein, HDL)
(Chancharme et al., 2002)
( )
1.
2.
( D3 ) 3.
( 2006)
A ( acetyl-CoA )
( 1 )
( 2 ) ( 3 ) ( 4 )
(lipoprotein receptors) ( 5 )
CM VLDL IDL LDL
HDL LDL CM VLDL
HDL
LDL-C TC 60-
70%
(atherosclerosis) LDL-C (Fernandez & Webb, 2008)
HDL-C (
20-30%)
HDL-C
°
(Fernandez & Webb, 2008)
TC LDL-C
; HDL-C HDL-C/LDL-C
( 2016)
( )
LDL-C (Fruchart
& Duriez, 1998; Lusis, 2000) LDL-C (endothelial cell of blood vessel) oxLDL
(monocytes) oxLDL
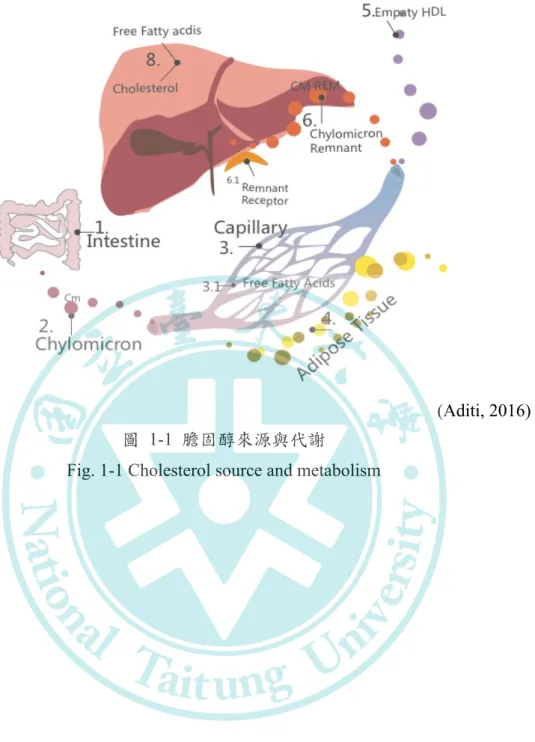
(Aditi, 2016) 1-1
Fig. 1-1 Cholesterol source and metabolism
(macrophages) macrophage oxLDL
(foam cell) foam cell Steinberg
oxLDL (Steinberg et al., 1989)
1. superoxidase dismutase (SOD)
SOD (O2-)
H2O2 O2 SOD
(Fukai & Ushio-Fukai, 2011) SOD
(Lu & Chiang, 2001)
2. catalase (CAT)
CAT H2O2 H2O2
H2O O2(Scibior & Czeczot, 2006)
CAT CAT
(Lu & Chiang, 2001)
3. glutathione peroxidase (GPx)
GPx GPx
glutathione glutathione H2O2
H2O O2
2 %
106
( 2016)
10-24 %
2
NAFLD
( )
NAFLD (Non-alcoholic
steatohepatitis, NASH)
NAFLD Day James 1998
(Day & James, 1998) (oxidative stress) (insulin resistence
IR) (lipid peroxidation)
(Sanyal et al., 2001)
( )
(Musso et al., 2003) 1985 (Westwater and Fainer, 1958)
(McClain et al., 2004) NAFLD
(Musso et al., 2003)
( )
NAFLD NAFLD (BMI)
α(TNF-α)
NAFLD C- (hs-CRP)
NAFLD (Ajmal et al., 2014) NAFLD
(cardiovascular disease, CVD) (Byrne and Targher, 2015)
( )
(carotid-artery intimal medial
thickness, CIMT) NAFLD
CIMT
NAFLD CIMT
(subclinical) 2015 Ampuero
NAFLD CIMT NAFLD NAFLD (Ampuero et al., 2015)
DOW
DOW
DOW
(triglyceride, TG) (total cholesterol, TC) (Chen et al., 2013)
DOW DOW 5′-adenosine
monophosphate-activated protein kinase (AMPK) acetyl- CoA carboxylase (ACC)
(Sheu et al., 2013) DOW
(low-density lipoprotein-cholesterol, LDL-C) DOW TBARS (Fu et al., 2012) DOW
28 300 1200 DOW (Yoshikawa et al., 2003)
Ca 2+ Mg 2+
RO
(Nanofiltration,
NF) Na+ Cl- Ca2+
Mg 2+ NF
SO42- Ca2+ CaSO4 (
)
Ca 2+ Mg 2+
Mg 2+
Vaskonen Mg2+ Ca2+
(Vaskonen et al., 2001)
DOW
2013 Chen
300 900 1500 DOW
MDA GSH TEAC
(Chen et al., 2013) DOW 2011 Lee
DOW DOW
(Lee et al., 2011)
DOW
DOW (Ha et al., 2014) (Bak et al.,
2012) (Fan et al., 2016) (Chen et al., 2013)
DOW (Kishimoto et al., 2010)
DOW
D D-L-NaK D-L-Ca DOW
DOW
DOW Na+ Mg2+
Ca2+ K+
2-1 AIN- 93G Growth Purified Diet
0.2% Syrian
D D-L-NaK D-L-Ca
probucol TC TG HDL-
C LDL-C TC TG
DOW
DOW GRd GPx CAT SOD
DOW
D( Mg +C a+ K)
TC TG TC TGTCTG LDL-C HDL-C
se rum
D( Mg +C a) D( Mg +K )
NaCa KMgCAT SOD GRd GPx TBARS
H& E AS T AL T
2-1 Fig 2-1 The outline of this studyDOWD-L-NaKD-L-Ca
1. (UltraPure water system) (PURELAB Classic UV MK2, ELGA LabWater Co., Marlow, UK)
2. (Electronic Balance) (AY-220, Shimadzu Co., Kyoto, Japan)
3. (Hotplate & Stirrer) (SH-301, Suntex Instruments Co., Ltd, New Taipei, Taiwan)
4. (Centrifuge) (Sorvall Legend Micro 17R, Thermo Fisher Scientific Inc., Germany)
5. (D-130, Wiggen hauser, Germany)
6. (Enzyme-linked immunosorbant assay, ELISA) (SUNRISE, Tecan Trading AG, Switzerland)
7. (Water bath) (OSB-2000, Tokyo Rikakikai Co., Ltd, Tokyo, Japan) 8. (pH meter) (pH meter) (UltraBasic pH Meter, Denver Instrument Co., Goettingen, Germany)
9. (Digitale camera) (Coolpix 800, Nicon Co., Tokyo, Japan)
10. (Digital camera) (Moticam 5, Motic Deutschland GmbH, Wetzlar, Germany)
( ) 1. 95%
2. Thiobarbituric acid (TBA) Sigma Chemical Co, (St. Louis, MO, USA) 3. Tricholoroacetic acid (TCA) Merck Co. (Darmstadat, Germany)
4. Dimethylsulfoxide (DMSO) Sigma Chemical Co, (St. Louis, MO, USA) 5. NaCl Sigma Chemical Co, (St. Louis, MO, USA)
6. NaOH Merck Co. (Darmstadat, Germany)
( )
1. (Gene Asia Biotech Co. LTD., Nang-Tou
Hsien, Taiwan)
2. (casein) (corn starch) (cellulose) (choline
3. (Tainan, Taiwan)
( )
Probucol Sigma (Sigma Chemical Co., St. Louis, MO, USA)
( )
1. BCA protein assay kit (23225, Pierce, Rockford, USA)
2. TC (BXC0261, Fortress) TG (BXC0271, Fortress) Fortress Diagnostics Ltd. (Antrim, UK)
3.Catalase (ECAT-100, BioAssay) BioAssay Systems LLC. (Hayward, Ca, USA)
4. GPx (RS 504, Randox) SOD (SD 125, Randox) GRd (GR 2368, Randox ) Randox Laboratories Ltd. (Crumlin, Antrim, UK)
( ) ( deep ocean water, DOW) (Taitung, Taiwan)
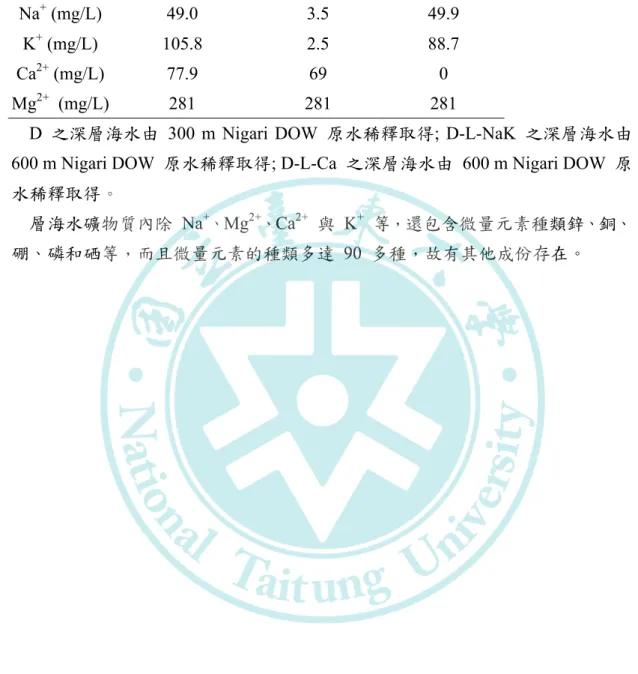
1.D 300 m Nigari DOW Na+ 49 mg/L K+ 105.8 mg/L Ca2+ 77.9 mg/L Mg2+ 281 mg/L
2. D-L-NaK 600 m Nigari DOW Ca2+ 69 mg/L Mg2+ 281 mg/L
3. D-L-Ca 600 m Nigari DOW Na+ 49 mg/L K+ 88.7 mg/L Mg2+ 281 mg/L
3-1
DOW FDA 60
7.4 (US FDA, 2005)
DOW 281 mg/L
3- 1
Table 3-1 The different compositions of minerals for deep ocean water.
D D-L-NaK D-L-Ca
Na+ (mg/L) 49.0 3.5 49.9
K+ (mg/L) 105.8 2.5 88.7
Ca2+ (mg/L) 77.9 69 0
Mg2+ (mg/L) 281 281 281
D 300 m Nigari DOW ; D-L-NaK
600 m Nigari DOW ; D-L-Ca 600 m Nigari DOW
Na+ Mg2+ Ca2+ K+
90
Usman Hosono
2001 (Usman & Hosono, 2001)
Syrian
6 ~ 7 8 48 60% 23 ± 1
C 8:00 ~ 20:00 12
8
AIN-93 3-1 8
NOR HC PRO
Probucol D Na+ Mg2+ Ca2+
K+ D-L-NaK Mg2+ Ca2+
D-L-Ca Na+ Mg2+ K+
1.0 mL
DOW 600 mL
Mg2+
FDA 60 7.4
(US FDA, 2005)
3-2 NOR (Nomal diet)
HC (High-Cholesterol diet) Probucol (PRO)
0.124 g/kg
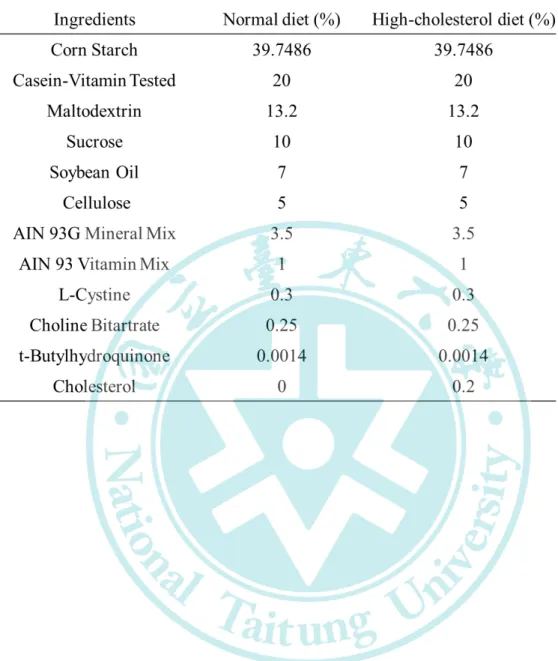
3- 2 (g/kg diet)
Table 3-2 The composition of the diet of each group (g/kg diet).
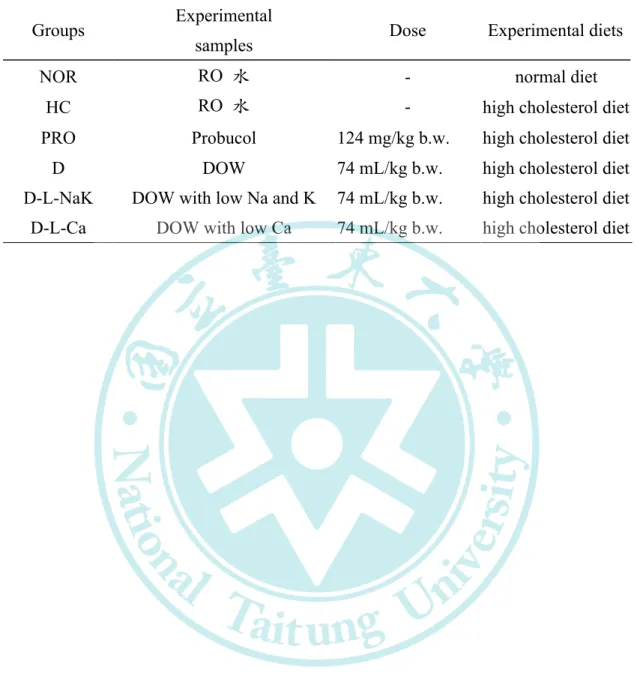
3- 3 Syrian
Table 3-3 Syrian hamster experimental animal dose group and sample configuration.
Groups Experimental
samples Dose Experimental diets
NOR RO - normal diet
HC RO - high cholesterol diet
PRO Probucol 124 mg/kg b.w. high cholesterol diet
D DOW 74 mL/kg b.w. high cholesterol diet
D-L-NaK DOW with low Na and K 74 mL/kg b.w. high cholesterol diet D-L-Ca DOW with low Ca 74 mL/kg b.w. high cholesterol diet
D 600 mL DOW Mg2+ 281 mg/L 600 mL x 281 mg/L 168.6 mg Mg2+
Mg2+ 168.6
mg/60 x 7.4 20.794 mg/kg Mg2+ 74 mL
DOW/kg b.w. Mg2+ 20.79 mg/kg;Na+ 3.62 mg/kg; K+ 7.82 mg/kg;Ca2+ 5.76 mg/kg
D-L-NaK 600 mL Na+ K+ DOW
281 mg/L 600 mL x 281 mg/L 168.6 mg Mg2+
Mg2+
168.6 mg/60 x 7.4 20.794 mg/kg Mg2+ 74
mL DOW/kg b.w. Mg2+ 20.79 mg/kg; Ca2+ 5.10 mg/kg
D-L-Ca 600 mL Ca2+ DOW 281 mg/L
600 mL x 281 mg/L 168.6 mg Mg2+
Mg2+ 168.6
mg/60 x 7.4 20.794 mg/kg Mg2+ 74 mL
DOW/kg b.w. Mg2+ 20.79 mg/kg; Na+ 3.69 mg/kg; K+ 6.56 mg/kg
(sacrifice)
10%
0.9% -80°C
TC TG HDL-C LDL-C
AST ALT (Tainan,
Taiwan) (Beckman-700, Fullerton, CA, USA)
TC TG ( )
hood DMSO (dimethyl sulfoxide) (total cholesterol, TC) (triglyceride, TG)
(BXC0261, Fortress) TC (BXC0271,
Fortress) TG ( )
0.1 g
1 mL chloroform : methanol (2:1 v/v) (1 mm) 1 -
2 40 60 M/s 5
15000 xg 5 500 µL hood
DMSO TC TG (BXC0261,
Fortress) TC (BXC0271, Fortress) TG
( )
TC TG
(BXC 0261, Fortress) TC (BXC 0271, Fortress)
TG
TC (BXC 0261, Fortress)
96 2 µL 200 µL reagent 37 C 5 min
ELISA reader 500 nm
TG (BXC 0271, Fortress)
2 µL 96 200 µL reagent 37 °C
5 min ELISA reader 546 nm
(thiobarbituric acid reactive substances, TBARS) ( )
0.1 g 1.0 mL 1X- lysis buffer (1% Triton X-100 20mM Tris 40 mM NaF 0.2 % SDS 0.5 % deoxy -cholate 1 mM EDTA 1 mM EGTA 1 mM Na3VO4 100 mM NaCl pH 7.5) 4 °C 12,000 x g
15 min -80 °C
TBA (thiobarbituric acid) (malondialdehyde, MDA) MDA
Tarladgis TMP (1,1,3,3-
tetramethoxypropane) TMP 1 mM
1N H2SO4 100 µL
50 µL 300 µL 5% trichloroacetic acid 100 µL 60 mmol/L TBA 95°C 30 min
20-30 min MDA
(Tarladgis et al., 1964)
bicinchoninic acid (BCA) kit
20 µL 200
µL BCA reagent 37°C 10 min ELISA reader 570
nm
( )
0.1 g 1.0 mL 1X-PBS (0.026 M NaCl 0.0026 M
NaH2PO4 pH 7) 4°C 12,000 xg 15 min
-80°C
( ) (superoxide dismutase, SOD)
SOD superoxide dismutase assay kit (SD 125, Randox) xanthine xanthine oxidase (XOD)
2-(4-iodophenyl)-3-(4-nitrophenol)-5-phenyltetrazolium chloride (I.N.T.)
I.N.T. SOD superoxide
dismutase assay kit mixed substrate (xanthine, I.N.T.) buffer (CAPS, EDTA) xanthine oxidase
buffer mixed substrate 5 µL 170 µL mixed substrate 25 µL xanthine oxidase 37°C
505 nm 30 15 min
( ) (catalase, CAT)
CAT (EnzyChromTM Catalase Assay Kit, ECAT-100, BioAssay Systems, Hayward, CA, USA) CAT H2O2 H2O
O2 Kit HRP Enzyme Dye Reagent 570 nm
CAT H2O2 CAT
H2O2 H2O2 H2O2
H2O2 H2O2 CAT
( ) (glutathione peroxidase, GSH-PX)
glutathione peroxidase assay kit (RS 504, Randox)
GPx Glutathione (GSH) glutathione reductase (GRd)
NADPH oxidised glutathione (GSSG)
glutathione peroxidase assay kit reagent (glutathione, glutathione
buffer reagent 4 µL 200 µL reagent
8 µL cumene agent 37 C 340 nm
1 min 3.5 min
8
°
100% methanol Sudan IV (2% w/v) 3 100%
90% 80% 70% 60% methanol phosphate buffered saline (PBS) Sudan IV
photoshop
( ) - (hematoxyline-eosin, H&E)
hematoxylin
10 min 10 min 10
min hematoxylin (250 µL 10N HCl +100 mL 70%
EtOH) 50%
70% 80% 95% eosin (0.1g eosin+100 mL 95%
EtOH+30 µL 10N HCl) 30min 95% 100%
5 2 xylene
± (mean ± SD) SPSS 12.0
( ) DOW
8 48 8
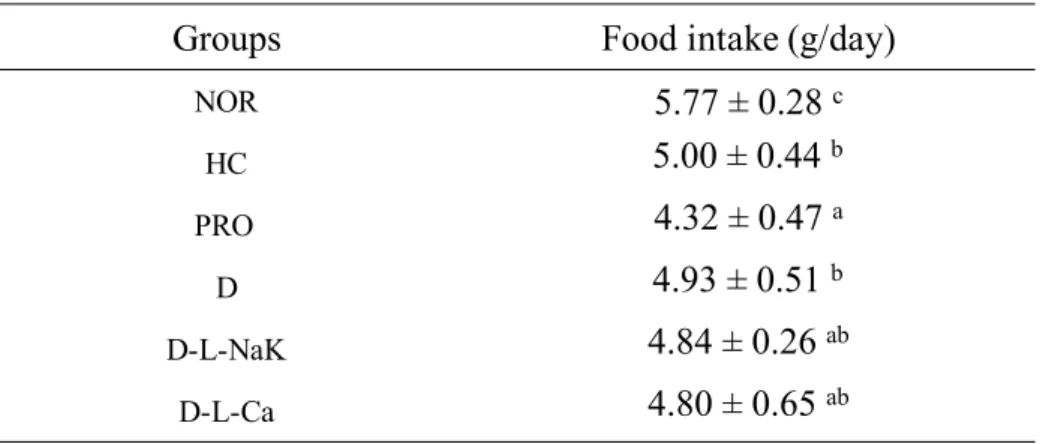
4-1 (HC)
(NOR) (p < 0.05) DOW
(PRO) (HC) (p < 0.05)
DOW
DOW (p > 0.05)
( ) /
4-2 NOR
/ (p < 0.05)
DOW
(PRO) (HC) (p < 0.05)
DOW DOW
(p > 0.05)
( )
4-3 (HC)
(NOR) (p < 0.05)
DOW
(HC) (p > 0.05)
Probucol
(p < 0.05) Probucol
( 034160 )
4-1
Table 4-1 Effect on the body wight gain of experimental hamster by feeding of different component of mineral for DOW after 8 weeks.
NOR: normal group, HC: high-cholesterol diet, PRO: probucol powder (0.124 g/kg/day 100 g b.w.) and high-cholesterol diet, D: Deep ocean water (74 mL/kg 100 g b.w.) and high-cholesterol diet, D-L-NaK: Deep ocean water with low sodium and potassium (74 mL/kg 100 g b.w.) and high-cholesterol diet, D-L-Ca: Deep ocean water with low calcium (74 mL/kg 100 g b.w.) and high-cholesterol diet, Data are presented as mean
± SD (n=8). Mean values within each column with different superscripts are significantly different (p < 0.05).
Groups body weight (g)
0th week 8th week
NOR 109.2 1.7 a 116.8 4.6 a
HC 109.0 5.6 a 129.0 8.4 b
PRO 109.6 2.2 a 115.6 3.4 a
D 108.7 5.1 a 115.7 5.7 a
D-L-NaK 107.7 4.1 a 114.3 5.5 a
D-L-Ca 108.3 4.4 a 114.1 6.2 a
4-2 /
Table 4-2 Effect of various sample on the liver weight/body weight ratio of experimental hamster.
NOR: normal group, HC: high-cholesterol diet, PRO: probucol powder (0.124 g/kg/day 100 g b.w.) and high-cholesterol diet, D: Deep ocean water (74 mL/kg 100 g b.w.) and high-cholesterol diet, D-L-NaK: Deep ocean water with low sodium and potassium (74 mL/kg 100 g b.w.) and high-cholesterol diet, D-L-Ca: Deep ocean water with low calcium (74 mL/kg 100 g b.w.) and high-cholesterol diet, Data are presented as mean
± SD (n=8). Mean values within each column with different superscripts are significantly different (p < 0.05).
Groups Liver weight Liver weight/body weight ratio (%)
NOR 3.01 0.21 a 2.51 0.13a
HC 4.48 0.35 d 3.53 0.18 b
PRO 3.85 0.19 bc 3.24 0.08 c
D 3.73 0.23 bc 3.21 0.14 c
D-L-NaK 3.70 0.33 b 3.18 0.23 c
D-L-Ca 3.76 0.19 cd 3.37 0.05 c
4-3
Table 4-3 Daily food intake of experimental hamster fed with various samples
NOR: normal group, HC: high-cholesterol diet, PRO: probucol powder (0.124 g/kg/day 100 g b.w.) and high-cholesterol diet, D: Deep ocean water (74 mL/kg 100 g b.w.) and high-cholesterol diet, D-L-NaK: Deep ocean water with low sodium and potassium (74 mL/kg 100 g b.w.) and high-cholesterol diet, D-L-Ca: Deep ocean water with low calcium (74 mL/kg 100 g b.w.) and high-cholesterol diet, Data are presented as mean
± SD (n=8). Mean values within each column with different superscripts are significantly different (p < 0.05).
Groups Food intake (g/day)
NOR 5.77 ± 0.28 c
HC 5.00 ± 0.44b
PRO 4.32 ± 0.47 a
D 4.93 ± 0.51 b
D-L-NaK 4.84 ± 0.26 ab
D-L-Ca 4.80 ± 0.65 ab
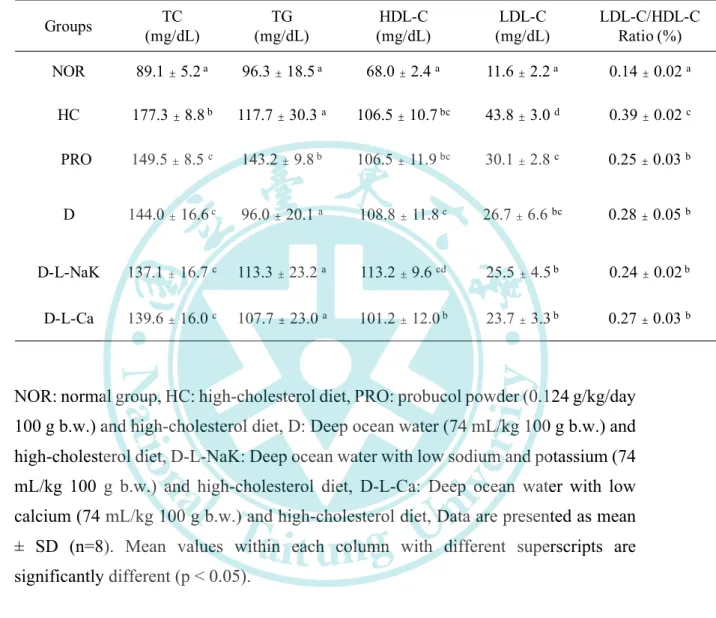
( ) TC TG
TC TG 4-4
(HC) (NOR) HC
TC (p < 0.05)
DOW
(PRO) (HC) (p < 0.05)
DOW TC DOW
TG 4-4 (HC)
(NOR) DOW TG
(PRO) (p < 0.05)
Probucol TG
( IIb ) TG
HDL-C (Noto et al., 2003)
( ) HDL-C LDL-C
HDL-C 4-4
(HC) (NOR) HC HDL-C
(p < 0.05) DOW HDL-C
LDL-C (HC) (NOR)
HC LDL-C (p < 0.05)
HC DOW
(PRO) (HC) (p < 0.05)
LDL-C DOW
(p > 0.05) LDL-cholesterol/HDL-cholesterol
(HC) (NOR) (p < 0.05) DOW
(PRO) (HC) (p < 0.05) DOW
DOW (p >
0.05)
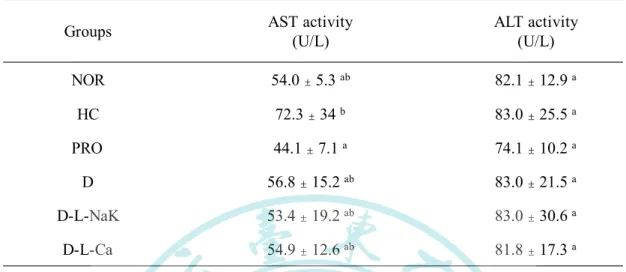
( ) AST ALT
AST ALT
4-4
/
Table 4-4 Effect of various samples on the serum cholesterol, triglyceride, HDL- cholesterol, LDL-cholesterol concentration and LDL-cholesterol/HDL-cholesterol ratio
NOR: normal group, HC: high-cholesterol diet, PRO: probucol powder (0.124 g/kg/day 100 g b.w.) and high-cholesterol diet, D: Deep ocean water (74 mL/kg 100 g b.w.) and high-cholesterol diet, D-L-NaK: Deep ocean water with low sodium and potassium (74 mL/kg 100 g b.w.) and high-cholesterol diet, D-L-Ca: Deep ocean water with low calcium (74 mL/kg 100 g b.w.) and high-cholesterol diet, Data are presented as mean
± SD (n=8). Mean values within each column with different superscripts are significantly different (p < 0.05).
Groups TC
(mg/dL)
TG (mg/dL)
HDL-C (mg/dL)
LDL-C (mg/dL)
LDL-C/HDL-C Ratio (%)
NOR 89.1 5.2a 96.3 18.5a 68.0 2.4 a 11.6 2.2a 0.14 0.02 a
HC 177.3 8.8b 117.7 30.3 a 106.5 10.7bc 43.8 3.0 d 0.39 0.02 c
PRO 149.5 8.5 c 143.2 9.8b 106.5 11.9bc 30.1 2.8 c 0.25 0.03 b
D 144.0 16.6c 96.0 20.1 a 108.8 11.8c 26.7 6.6 bc 0.28 0.05 b
D-L-NaK 137.1 16.7 c 113.3 23.2 a 113.2 9.6 cd 25.5 4.5b 0.24 0.02b
D-L-Ca 139.6 16.0 c 107.7 23.0 a 101.2 12.0b 23.7 3.3b 0.27 0.03 b
AST ALT
4-5 AST (NOR)
(HC) (p < 0.05)
AST DOW
(HC) (p < 0.05) DOW
AST DOW
ALT 4-5 ALT
(NOR) (HC) (p > 0.05) DOW
(PRO) (HC)
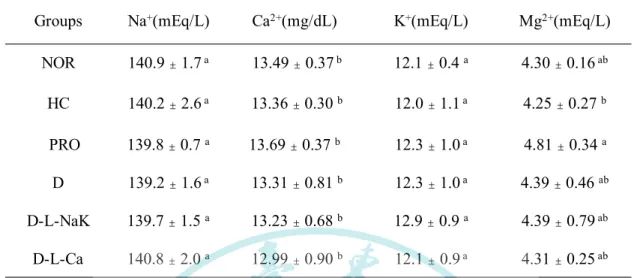
DOW Mg2+ Ca2+ K+ Na+
DOW 4-6
138.7 mEq/L -161.2 mEq/L
8.03 mEq/L – 14.12 mEq/L
12.2 mg/dl -14.7 mg/dl
(Mary et al., 2006) 4-6
4-5 AST ALT
Table 4-5 Effect of various samples on the serum Aspartate aminotransferase and Alanine transferase activity of experimental hamster.
NOR: normal group, HC: high-cholesterol diet, PRO: probucol powder (0.124 g/kg/day 100 g b.w.) and high-cholesterol diet, D: Deep ocean water (74 mL/kg 100 g b.w.) and high-cholesterol diet, D-L-NaK: Deep ocean water with low sodium and potassium (74 mL/kg 100 g b.w.) and high-cholesterol diet, D-L-Ca: Deep ocean water with low calcium (74 mL/kg 100 g b.w.) and high-cholesterol diet, Data are presented as mean
± SD (n=8). Mean values within each column with different superscripts are significantly different (p < 0.05).
Groups AST activity
(U/L)
ALT activity (U/L)
NOR 54.0 5.3 ab 82.1 12.9 a
HC 72.3 34 b 83.0 25.5 a
PRO 44.1 7.1 a 74.1 10.2 a
D 56.8 15.2 ab 83.0 21.5 a
D-L-NaK 53.4 19.2 ab 83.0 30.6 a
D-L-Ca 54.9 12.6 ab 81.8 17.3 a
4-6 Na+ Mg2+ Ca2+ K+
Table 4-6 Effect of various samples on the serum Na+ Mg2+ Ca2+ and K+ content.
NOR: normal group, HC: high-cholesterol diet, PRO: probucol powder (0.124 g/kg/day 100 g b.w.) and high-cholesterol diet, D: Deep ocean water (74 mL/kg 100 g b.w.) and high-cholesterol diet, D-L-NaK: Deep ocean water with low sodium and potassium (74 mL/kg 100 g b.w.) and high-cholesterol diet, D-L-Ca: Deep ocean water with low calcium (74 mL/kg 100 g b.w.) and high-cholesterol diet, Data are presented as mean
± SD (n=8). Mean values within each column with different superscripts are significantly different (p < 0.05).
Calcium,12.2 mg/dl - 14.7 mg/dl; Sodium,138.7 mEq/L - 161.2 mEq/L; Potassium,8.03 mEq/L – 14.12 mEq/L
Groups Na+(mEq/L) Ca2+(mg/dL) K+(mEq/L) Mg2+(mEq/L)
NOR 140.9 1.7a 13.49 0.37b 12.1 0.4 a 4.30 0.16ab
HC 140.2 2.6a 13.36 0.30 b 12.0 1.1a 4.25 0.27 b
PRO 139.8 0.7 a 13.69 0.37 b 12.3 1.0a 4.81 0.34 a
D 139.2 1.6a 13.31 0.81 b 12.3 1.0a 4.39 0.46 ab
D-L-NaK 139.7 1.5 a 13.23 0.68 b 12.9 0.9 a 4.39 0.79ab
D-L-Ca 140.8 2.0 a 12.99 0.90 b 12.1 0.9a 4.31 0.25ab
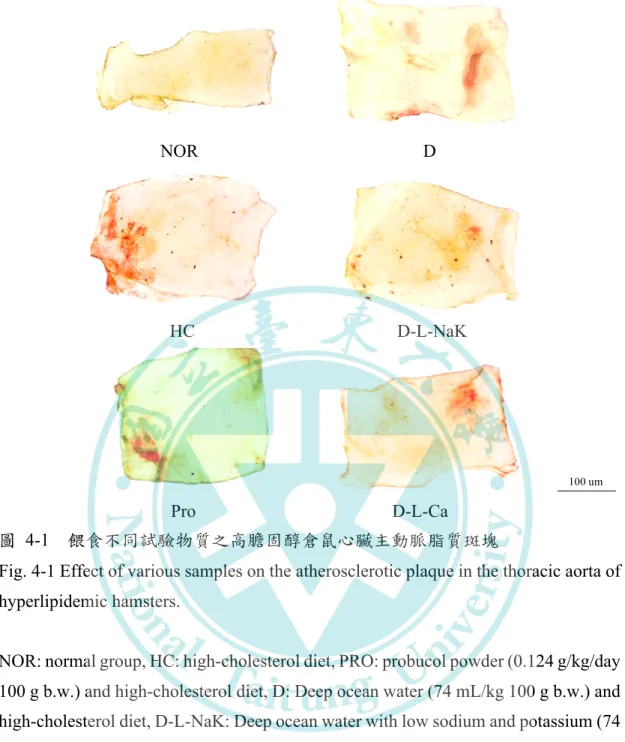
LDL LDL
LDL LDL
(Steinberg et al., 1989) Sudan IV
4-1
4-2 HC
NOR HC
(p < 0.05) HC
4-3 PRO D D-L-NaK D-L-Ca
HC (p < 0.05) Probucol
DOW D-L-NaK Na+ K+ Mg2+ Ca2+
TC TG
TC 4-7
(HC) (NOR) (p < 0.05)
DOW
(PRO) (HC) (p < 0.05) DOW
TC DOW D-L-NaK
D-L-Ca (p < 0.05) D-L-Ca D (p < 0.05) D-L-NaK
TC
TG 4-7
(HC) (NOR) (p > 0.05)
NOR D
HC D-L-NaK
Pro D-L-Ca
4-1
Fig. 4-1 Effect of various samples on the atherosclerotic plaque in the thoracic aorta of hyperlipidemic hamsters.
NOR: normal group, HC: high-cholesterol diet, PRO: probucol powder (0.124 g/kg/day 100 g b.w.) and high-cholesterol diet, D: Deep ocean water (74 mL/kg 100 g b.w.) and high-cholesterol diet, D-L-NaK: Deep ocean water with low sodium and potassium (74 mL/kg 100 g b.w.) and high-cholesterol diet, D-L-Ca: Deep ocean water with low calcium (74 mL/kg 100 g b.w.) and high-cholesterol diet, Data are presented as mean
± SD (n=8). Mean values within each column with different superscripts are significantly different (p < 0.05).
100 um
4-2
Fig. 4-2 Effect of various samples on the atherosclerotic plaque area of experimental hamster.
NOR: normal group, HC: high-cholesterol diet, PRO: probucol powder (0.124 g/kg/day 100 g b.w.) and high-cholesterol diet, D: Deep ocean water (74 mL/kg 100 g b.w.) and high-cholesterol diet, D-L-NaK: Deep ocean water with low sodium and potassium (74 mL/kg 100 g b.w.) and high-cholesterol diet, D-L-Ca: Deep ocean water with low calcium (74 mL/kg 100 g b.w.) and high-cholesterol diet, Data are presented as mean
± SD (n=8). Mean values within each column with different superscripts are significantly different (p < 0.05).
Normal HC Pro D(Mg+Ca+K)D(Mg+Ca) D(Mg+K)
Lipid plaque (%)
0 5 10 15 20
a
d
cd
bc
bc
ab
NOR HC PRO
NOR HC PRO D D-L-NaK D-L-Ca
4-7
Table 4-7 Effect of various samples on hepatic and feces triglyceride and cholesterol content of experimental hamster.
NOR: normal group, HC: high-cholesterol diet, PRO: probucol powder (0.124 g/kg/day 100 g b.w.) and high-cholesterol diet, D: Deep ocean water (74 mL/kg 100 g b.w.) and high-cholesterol diet, D-L-NaK: Deep ocean water with low sodium and potassium (74 mL/kg 100 g b.w.) and high-cholesterol diet, D-L-Ca: Deep ocean water with low calcium (74 mL/kg 100 g b.w.) and high-cholesterol diet, Data are presented as mean
± SD (n=8). Mean values within each column with different superscripts are significantly different (p < 0.05).
Groups Liver Feces
TC (mg/g) TG (mg/g) TC (mg/g) TG (mg/g)
NOR 2.05 0.18 b 19.36 3.53 c 4.20 0.84 a 3.16 0.48b
HC 4.43 0.46 d 21.95 4.65 c 8.67 0.96 b 6.05 0.40c
PRO 1.96 0.22 ab 13.39 1.24 b 2.97 0.72cd 7.18 0.33d
D 2.43 0.19 c 11.93 1.23 ab 3.41 0.74 c 2.97 0.58b
D-L-NaK 1.14 0.83 a 9.13 0.97a 2.06 0.38 e 2.07 0.29a
D-L-Ca 2.24 0.04 bc 11.10 1.35ab 2.18 0.88 de 3.01 0.44b
DOW TG D-L-NaK
TC TG 4-7
(HC) (NOR) (p < 0.05)
HC TC
TC TC
TG
H&E
4-3 (HC)
(HC) (NOR)
(NOR) (HC)
(NOR)
DOW
(HC) D-L-NaK
(malondialdehyde,
MDA) MDA
MDA 4-4
MDA (HC) (NOR)
MDA (p < 0.05)
DOW
(PRO) (HC) (p < 0.05)
DOW (PRO) DOW DOW
MDA DOW
(p > 0.05)
4-3 (400 ×)
Fig.3 Pathological examination of liver of experimental hamsters in the 400 × power field. The liver sections were stained using H&E and observed in the light microscope.
NOR: normal group, HC: high-cholesterol diet, PRO: probucol powder (0.124 g/kg/day 100 g b.w.) and high-cholesterol diet, D: Deep ocean water (74 mL/kg 100 g b.w.) and high-cholesterol diet, D-L-NaK: Deep ocean water with low sodium and potassium (74 mL/kg 100 g b.w.) and high-cholesterol diet, D-L-Ca: Deep ocean water with low calcium (74 mL/kg 100 g b.w.) and high-cholesterol diet, Data are presented as mean
± SD (n=8). Mean values within each column with different superscripts are significantly different (p < 0.05).
49
100 um
100 um
100 um 100 um
100 um
100 um D
D-L-NaK
D-L-Ca
4-4
Fig. 4-4 Effect of various sample on the liver TBARS amount of experimental hamster.
NOR: normal group, HC: high-cholesterol diet, PRO: probucol powder (0.124 g/kg/day 100 g b.w.) and high-cholesterol diet, D: Deep ocean water (74 mL/kg 100 g b.w.) and high-cholesterol diet, D-L-NaK: Deep ocean water with low sodium and potassium (74 mL/kg 100 g b.w.) and high-cholesterol diet, D-L-Ca: Deep ocean water with low calcium (74 mL/kg 100 g b.w.) and high-cholesterol diet, Data are presented as mean
± SD (n=8). Mean values within each column with different superscripts are significantly different (p < 0.05).
(Mg+Ca+K) (Mg+Ca) (Mg+K) NOR HC PRO D D-L-NaK D-L-Ca
ROS (Medina, Moreno-Otero, 2005)
ROS SOD O2-
H2O2 H2O2 catalase (CAT) H2O O2 GPx
GSH GSSG H2O GSSG NADPH
GRd GSH CAT SOD GRd GPx
4-5 4-6 SOD CAT
(HC) (NOR) (p < 0.05)
(PRO) (HC) SOD
CAT SOD CAT
DOW (HC) SOD CAT
(p < 0.05) DOW SOD CAT
DOW SOD (p > 0.05) CAT
D-L-NaK CAT D-L-Ca (p < 0.05)
D-L-Ca D D-L-NaK CAT
4-7 GPx
(PRO) (p < 0.05) (NOR)
DOW GPx
4-8 GRd
(HC) (NOR) (p < 0.05) DOW
GRd
4-5 SOD
Fig. 4-5 Effect of various samples on antioxidant enzyme SOD activities in the liver of experimental hamster.
NOR: normal group, HC: high-cholesterol diet, PRO: probucol powder (0.124 g/kg/day 100 g b.w.) and high-cholesterol diet, D: Deep ocean water (74 mL/kg 100 g b.w.) and high-cholesterol diet, D-L-NaK: Deep ocean water with low sodium and potassium (74 mL/kg 100 g b.w.) and high-cholesterol diet, D-L-Ca: Deep ocean water with low calcium (74 mL/kg 100 g b.w.) and high-cholesterol diet, Data are presented as mean
± SD (n=8). Mean values within each column with different superscripts are significantly different (p < 0.05).
Normal HC Pro D(Mg+Ca+K)D(Mg+Ca) D(Mg+K)
SOD activity (U/mg protein)
0 20 40 60 80 100
a
b
b
a a
a
a
a b
b b b
NOR HC PRO D D-L-NaK D-L-Ca
4-6 CAT
Fig. 4-6 Effect of various samples on antioxidant enzyme CAT activities in the liver of experimental hamster.
NOR: normal group, HC: high-cholesterol diet, PRO: probucol powder (0.124 g/kg/day 100 g b.w.) and high-cholesterol diet, D: Deep ocean water (74 mL/kg 100 g b.w.) and high-cholesterol diet, D-L-NaK: Deep ocean water with low sodium and potassium (74 mL/kg 100 g b.w.) and high-cholesterol diet, D-L-Ca: Deep ocean water with low calcium (74 mL/kg 100 g b.w.) and high-cholesterol diet, Data are presented as mean
± SD (n=8). Mean values within each column with different superscripts are significantly different (p < 0.05).
Normal HC Pro D(Mg+Ca+K)D(Mg+Ca) D(Mg+K)
CAT activity (U/mg protein)
0.0 0.5 1.0 1.5 2.0 2.5 3.0
ab
d
d
c
a
bc
NOR HC PRO
NOR HC PRO D D-L-NaK D-L-Ca
4-7 GPx
Fig. 4-7 Effect of various samples on antioxidant enzyme GPx activities in the liver of experimental hamster.
NOR: normal group, HC: high-cholesterol diet, PRO: probucol powder (0.124 g/kg/day 100 g b.w.) and high-cholesterol diet, D: Deep ocean water (74 mL/kg 100 g b.w.) and high-cholesterol diet, D-L-NaK: Deep ocean water with low sodium and potassium (74 mL/kg 100 g b.w.) and high-cholesterol diet, D-L-Ca: Deep ocean water with low calcium (74 mL/kg 100 g b.w.) and high-cholesterol diet, Data are presented as mean
± SD (n=8). Mean values within each column with different superscripts are significantly different (p < 0.05).
Normal HC Pro D(Mg+Ca+K)D(Mg+Ca) D(Mg+K)
GPx activity (U/mg protein)
0.0 0.5 1.0 1.5 2.0 2.5
ab
ab
a
b b
c
NOR HC PRONOR HC PRO D D-L-NaK D-L-Ca
4-8 GRd
Fig. 4-8 Effect of various samples on antioxidant enzyme GRd activities in the liver of experimental hamster.
NOR: normal group, HC: high-cholesterol diet, PRO: probucol powder (0.124 g/kg/day 100 g b.w.) and high-cholesterol diet, D: Deep ocean water (74 mL/kg 100 g b.w.) and high-cholesterol diet, D-L-NaK: Deep ocean water with low sodium and potassium (74 mL/kg 100 g b.w.) and high-cholesterol diet, D-L-Ca: Deep ocean water with low calcium (74 mL/kg 100 g b.w.) and high-cholesterol diet, Data are presented as mean
± SD (n=8). Mean values within each column with different superscripts are significantly different (p < 0.05).
Normal HC Pro D(Mg+Ca+K)D(Mg+Ca) D(Mg+K)
GRd cativity (U/mg protein)
0.0 0.1 0.2 0.3
0.4 a
b
c
d
b
d
d
a
b
a
b
NOR HC PRO
NOR HC PRO D D-L-NaK D-L-Ca
Na+ Mg2+ Ca2+ K+
Mg2+ (Kishimoto et al., 2010)
DOW 281 mg/L Mg2+ Mg2+
168.6 mg/60 x 7.4 20.79 mg/kg
D 74 mL DOW/kg b.w. 20.79
mg/kg Mg2+;3.62 mg/kg Na+;7.82 mg/kg K+;5.76 mg/kg Ca2+ D-L-NaK
74 mL DOW/kg b.w. 20.79 mg/kg
Mg2+;5.10 mg/kg Ca2+ D-L-Ca 74 mL
DOW/kg b.w. 20.79 mg/kg Mg2+; 3.69 mg/kg Na+;6.56 mg/kg K+
(p < 0.05) /
/ (p < 0.05)
( TC TG HDL-C LDL-C )
TC DOW
TC DOW
TG TG
NOR
HDL-C LDL-C (LDL-C/HDL-C ratio)
DOW
LDL-C (p < 0.05) DOW D-L-NaK
D-L-Ca D
(Hooper et al., 2003) DOW Na+ Mg2+ Ca2+
K+
HC NOR (p < 0.05)
DOW (
) HC (p < 0.05)
DOW D-L-NaK D D-L-Ca
AST ALT
AST
TC TC
TC NOR (p < 0.05)
TC (p < 0.05)
D-L-NaK (p < 0.05) Mg2+ Ca2+
TC TC
TC TC TG
SOD O2 H2O2 H2O2 catalase
H2O O2 GPx GSH GSSG H2O
GSSG NADPH GRd GSH (Wulf et al., 2002) SOD CAT Grd
SOD CAT
DOW D-L-NaK D D-L-
Ca
TBARS (HC) NOR (p <
0.05) DOW
DOW
DOW
CAT D-L-NaK DOW Mg2+ Ca2+
DOW
Na+
Mg2+ Ca2+ K+ DOW
/
6-1 TC LDL-
C LDL-C / HDL-C (p < 0.05)
DOW LDL-C D-L-NaK
(p > 0.05)
6-1 TC
D-L-NaK (p > 0.05)
SOD CAT
D-L-NaK D D-L-Ca
D-L-NaK D D-L-Ca
Na+ Mg2+ Ca2+ (Lee et al., 2012)
D D-L-Ca Na+ Mg2+ Ca2+
Mg2+ Na+ K+
D-L-NaK D-L-Ca D-L-NaK
Mg2+ Ca2+
DOW Na+ Mg2+ Ca2+ K+
6-1
Table 6-1 Comparison of the regulation of blood lipid between deep ocean water and high cholesterol diet groups with different minerals.
D D-L-NaK D-L-Ca
TC * * *
TG
HDL-C #
LDL-C * ** **
LDL-C / HDL-C * * *
AST ALT
* ** *
TC * ** *
TG * ** *
TBARS ** ** **
SOD # # #
CAT # # #
GPx
GRd # #
* P < 0.05
** P < 0.01
# P < 0.05
TAIWAN SOCIETY OF DEEP OCEAN WATER RESOURCE APPLICATION
2016 106
(2012) 3T3-L1
(2015)
(2012)
(2010)
2002
Ajmal, M R, Yaccha, M, Malik, M A, Rabbani, M U, Ahmad, I, Isalm, Nand Abdali, N.
Prevalence of nonalcoholic fatty liver disease (NAFLD) in patients of cardiovascular diseases and its association with hs-CRP and TNF-alpha. Indian Heart J, 66, 574-579. (2014).
Ampuero, J, Gallego-Duran, Rand Romero-Gomez, M. Association of NAFLD with subclinical atherosclerosis and coronary-artery disease: meta-analysis. Rev Esp Enferm Dig, 107, 10-16. (2015).
Bak, J P, Kim, Y M, Son, J, Kim, C Jand Kim, E H. Application of concentrated deep sea water inhibits the development of atopic dermatitis-like skin lesions in NC/Nga mice. BMC Complement Altern Med, 12, 108. (2012).
Baumer, Y, McCurdy, S, Weatherby, T M, Mehta, N N, Halbherr, S, Halbherr, P, Yamazaki, Nand Boisvert, W A. Hyperlipidemia-induced cholesterol crystal production by endothelial cells promotes atherogenesis. Nat Commun, 8, 1129.
(2017).
Byrne, C Dand Targher, G. NAFLD: a multisystem disease. J Hepatol, 62, S47-64.
(2015).
Chancharme, L, Therond, P, Nigon, F, Zarev, S, Mallet, A, Bruckert, Eand Chapman,
Chen, Y C. Alleviative effects of deep-seawater drinking water on hepatic lipid accumulation and oxidation induced by a high-fat diet. J Chin Med Assoc, 76, 95-101. (2013).
Cohen, H, Sherer, Y, Shaish, A, Shoenfeld, Y, Levkovitz, H, Bitzur, Rand Harats, D.
Atherogenesis inhibition induced by magnesium-chloride fortification of drinking water. Biol Trace Elem Res, 90, 251-259. (2002).
Day, C Pand James, O F. Steatohepatitis: a tale of two "hits"? Gastroenterology, 114, 842-845. (1998).
Fan, H, Tan, Z, Hua, Y, Huang, X, Gao, Y, Wu, Y, Liu, Band Zhou, Y. Deep sea water improves exercise and inhibits oxidative stress in a physical fatigue mouse model. Biomed Rep, 4, 751-757. (2016).
Fernandez, M Land Webb, D. The LDL to HDL cholesterol ratio as a valuable tool to evaluate coronary heart disease risk. J Am Coll Nutr, 27, 1-5. (2008).
Fruchart, J Cand Duriez, P. High density lipoproteins and coronary heart disease. Future prospects in gene therapy. Biochimie, 80, 167-172. (1998).
Fu, Z Y, Yang, F L, Hsu, H Wand Lu, Y F. Drinking deep seawater decreases serum total and low-density lipoprotein-cholesterol in hypercholesterolemic subjects.
J Med Food, 15, 535-541. (2012).
Fukai, Tand Ushio-Fukai, M. Superoxide dismutases: role in redox signaling, vascular function, and diseases. Antioxid Redox Signal, 15, 1583-1606. (2011).
Ha, B G, Park, J E, Shin, E Jand Shon, Y H. Effects of balanced deep-sea water on adipocyte hypertrophy and liver steatosis in high-fat, diet-induced obese mice.
Obesity (Silver Spring), 22, 1669-1678. (2014).
Hataguchi, Y, Tai, H, Nakajima, Hand Kimata, H. Drinking deep-sea water restores mineral imbalance in atopic eczema/dermatitis syndrome. Eur J Clin Nutr, 59, 1093-1096. (2005).
Hooper, L, Bartlett, C, Davey Smith, Gand Ebrahim, S. Reduced dietary salt for prevention of cardiovascular disease. Cochrane Database Syst Rev, CD003656.
(2003).
Hsu, C Sand Kao, J H. Non-alcoholic fatty liver disease: an emerging liver disease in Taiwan. J Formos Med Assoc, 111, 527-535. (2012).
Hwang, H S, Kim, H A, Lee, S Hand Yun, J W. Anti-obesity and antidiabetic effects of deep sea water on ob/ob mice. Mar Biotechnol (NY), 11, 531-539. (2009).
Khan, A M, Sullivan, L, McCabe, E, Levy, D, Vasan, R Sand Wang, T J. Lack of
cardiovascular disease. Am Heart J, 160, 715-720. (2010).
Kimata, H, Tai, H, Nakagawa, K, Yokoyama, Y, Nakajima, Hand Ikegami, Y.
Improvement of skin symptoms and mineral imbalance by drinking deep sea water in patients with atopic eczema/dermatitis syndrome (AEDS). Acta Medica (Hradec Kralove), 45, 83-84. (2002).
Kishimoto, Y, Tani, M, Uto-Kondo, H, Saita, E, Iizuka, M, Sone, H, Yokota, Kand Kondo, K. Effects of magnesium on postprandial serum lipid responses in healthy human subjects. Br J Nutr, 103, 469-472. (2010).
Larsson, S C, Orsini, Nand Wolk, A. Dietary magnesium intake and risk of stroke: a meta-analysis of prospective studies. Am J Clin Nutr, 95, 362-366. (2012).
Laurant, Pand Touyz, R M. Physiological and pathophysiological role of magnesium in the cardiovascular system: implications in hypertension. J Hypertens, 18, 1177- 1191. (2000).
Lee, C L, Kung, Y H, Wang, J J, Lung, T Yand Pan, T M. Enhanced hypolipidemic effect and safety of red mold dioscorea cultured in deep ocean water. J Agric Food Chem, 59, 8199-8207. (2011).
Lee, C T, Lien, Y H, Lai, L W, Ng, H Y, Chiou, T Tand Chen, H C. Variations of dietary salt and fluid modulate calcium and magnesium transport in the renal distal tubule. Nephron Physiol, 122, 19-27. (2012).
Lu, Y Fand Chiang, C F. Effect of dietary cholesterol and fat levels on lipid peroxidation and the activities of antioxidant enzymes in rats. Int J Vitam Nutr Res, 71, 339- 346. (2001).
Luoma, H, Aromaa, A, Helminen, S, Murtomaa, H, Kiviluoto, L, Punsar, Sand Knekt, P. Risk of myocardial infarction in Finnish men in relation to fluoride, magnesium and calcium concentration in drinking water. Acta Med Scand, 213, 171-176. (1983).
Lusis, A J. Atherosclerosis. Nature, 407, 233-241. (2000).
McClain, C J, Mokshagundam, S P, Barve, S S, Song, Z, Hill, D B, Chen, Tand Deaciuc, I. Mechanisms of non-alcoholic steatohepatitis. Alcohol, 34, 67-79. (2004).
Medina, Jand Moreno-Otero, R. Pathophysiological basis for antioxidant therapy in chronic liver disease. Drugs, 65, 2445-2461. (2005).
Musso, G, Gambino, R, De Michieli, F, Cassader, M, Rizzetto, M, Durazzo, M, Faga,
Noto, H, Kawamura, M, Hashimoto, Y, Satoh, H, Hara, M, Iso-o, N, Togo, M, Kimura, Sand Tsukamoto, K. Modulation of HDL metabolism by probucol in complete cholesteryl ester transfer protein deficiency. Atherosclerosis, 171, 131-136.
(2003).
Othmer, D Fand Roels, O A. Power, fresh water, and food from cold, deep sea water.
Science, 182, 121-125. (1973).
Sanyal, A J, Campbell-Sargent, C, Mirshahi, F, Rizzo, W B, Contos, M J, Sterling, R K, Luketic, V A, Shiffman, M Land Clore, J N. Nonalcoholic steatohepatitis:
association of insulin resistance and mitochondrial abnormalities.
Gastroenterology, 120, 1183-1192. (2001).
Scibior, Dand Czeczot, H. [Catalase: structure, properties, functions]. Postepy Hig Med Dosw (Online), 60, 170-180. (2006).
Sheu, M J, Chou, P Y, Lin, W H, Pan, C H, Chien, Y C, Chung, Y L, Liu, F Cand Wu, C H. Deep sea water modulates blood pressure and exhibits hypolipidemic effects via the AMPK-ACC pathway: an in vivo study. Mar Drugs, 11, 2183- 2202. (2013).
Steinberg, D, Parthasarathy, S, Carew, T E, Khoo, J Cand Witztum, J L. Beyond cholesterol. Modifications of low-density lipoprotein that increase its atherogenicity. N Engl J Med, 320, 915-924. (1989).
Tessari, P, Coracina, A, Cosma, Aand Tiengo, A. Hepatic lipid metabolism and non- alcoholic fatty liver disease. Nutr Metab Cardiovasc Dis, 19, 291-302. (2009).
Usmanand Hosono, A. Hypocholesterolemic effect of Lactobacillus gasseri SBT0270 in rats fed a cholesterol-enriched diet. J Dairy Res, 68, 617-624. (2001).
Vaskonen, T, Mervaala, E, Seppanen-Laakso, Tand Karppanen, H. Diet enrichment with calcium and magnesium enhances the cholesterol-lowering effect of plant sterols in obese Zucker rats. Nutr Metab Cardiovasc Dis, 11, 158-167. (2001).
Westwater, J Oand Fainer, D. Liver impairment in the obese. Gastroenterology, 34, 686- 693. (1958).
Yang, C C, Yao, C A, Lin, Y R, Yang, J Cand Chien, C T. Deep-sea water containing selenium provides intestinal protection against duodenal ulcers through the upregulation of Bcl-2 and thioredoxin reductase 1. PLoS One, 9, e96006. (2014).
Yoshikawa, T, Mine, Y, Morikage, Kand Yoshida, N. Pharmacological profile of AS- 9705, a novel benzotriazolecarboxamide derivative, as a gastroprokinetic agent with potent anti-emetic activity. Arzneimittelforschung, 53, 98-106. (2003).