國立臺灣大學公共衛生學院環境衛生研究所 碩士論文
Graduate Institute of Environmental Health College of Public Health
National Taiwan University Master Thesis
糕餅烘焙作業環境粉塵及化學性有害物暴露調查 Exposure to Flour Dust
and Hazardous Chemicals in Bakeries
張佩婷 Pei-Ting Chang
指導教授: 蔡詩偉 博士 Advisor: Shih-Wei Tsai, Ph.D., CIH
中華民國 105 年 7 月
July, 2016
中文摘要
近年來,順應台灣民眾飲食習慣的改變,糕餅烘焙產業之成長極為快速;而 依據流行病學研究結果顯示,麵包師傅患有職業性氣喘比例約為 5%-20%,再加 上其他眼、鼻等症狀的高發生率,致使其相關的勞工安全衛生議題備受重視。
目前國內對於糕餅烘焙業勞工健康、工作環境、空氣中粉塵及揮發性有機物 質的研究資料極為有限,而為了關心與促進此工作場所的勞工健康,本研究藉由:
(1) 整理國內連鎖糕餅製作產業資料、國內外有關連鎖糕餅製作作業勞工呼吸道 有害物暴露之職業安全衛生相關文獻;(2)訪視整理連鎖糕餅業,進行勞工安全 衛生項目資料調查與整理;(3) 糕餅製作環境空氣中常見或危害較甚物種辨識及 定量;及(4) 問卷調查等工作執行,進而了解其危害因子、並提出安全衛生改善 或管理建議。
本研究以主動採樣幫浦,搭配 IOM 粉塵採樣器、並聯矽膠採樣管、XAD-2 採 樣管進行烘焙業空氣中 9 項有害物質採樣,流量分別設為 2000 mL/min、100 mL/min 及 35 mL/min,採樣時間為 5 小時。採樣後,氣狀樣本經溶劑脫附,
使用氣相層析質譜儀進行分析。
本研究除了完成 15 間糕餅烘焙業者的現場訪視之外,另完成 5 家業者的空 氣採樣,共計 66 個空氣樣本,182 筆空氣濃度。此外,本研究亦搭配總揮發性 有機物、粉塵直讀式儀器等進行採樣;結果顯示可吸入性粉塵平均濃度為 0.27 mg/m3,範圍為 0.01-0.83 mg/m3,有 23%之採樣點高於 ACGIH 之 TLV-TWA(0.5
mg/m3),顯示粉塵暴露為烘焙業之重要職業衛生議題。另一方面,丁二酮、2,3-
戊二酮、乙醯乙醇、2,3-已二酮、2,3-庚二酮、乙醛及呋喃甲醛等也皆存在於烘 焙業空氣中;其中部份樣本之乙醛濃度可達一般室內空氣濃度之 37-83 倍。與非 操作區相比,工作區之總揮發性有機物濃度可達 21 倍,顯示工作流程中空氣中 有害物的濃度在廠區中有累積的現象。
建議糕餅烘焙業應加強室內空調換氣率,訂立烘焙業職業安全衛生相關之工 作規範,注意可吸入性粉塵暴露情形,以降低員工的可能健康風險。
關鍵字:糕餅烘焙業、空氣採樣、可吸入性粉塵、乙醛、人工香精
Abstract
In correspondence with a transition trend of Taiwanese’ eating habits, bakeries become a fast growing industry. High prevalent Baker’s Asthma, the most frequently reported occupational asthma since the 20th century, as well as eye/nose symptoms, make occupational health a critical issue in the bakeries. Currently, the studies about workers’ health, working environment, dust and airborne concentrations of the associated chemicals in the bakeries of Taiwan are limited. Hence, to improve occupational health, the objectives of this research were to: (1) perform a comprehensive collection of information regarding bakery; (2) perform a
comprehensive literature survey on occupational safety and health regarding bakery and related workplace; (3) identify hazardous airborne materials and perform air sampling and analysis in the bakery; and (4) perform walk-through surveys at the bakeries and administrate questionnaires for the workers.
In this study, the walk-through surveys have been carried out for 15 different bakeries. Field air samplings were performed at 5 out of the 15 bakeries. The average concentration of inhalable dust was found to be 0.27 mg/m3, with a range of 0.01-0.83 mg/m3. Among the samples, 23% of them were higher than the ACGIH TLV-TWA (0.5 mg/m3), in terms of the concentration of inhalable dust. The findings indicate that inhalable dust is an important air pollutant for workers in the bakeriess.
In addition, diacetyl, acetoin,2,3-pentanedione, 2,3-hexanedione,
2,3-heptanedione, furfural, and acetaldehyde were also found in the bakeries with various levels. In one of the samples, it was observed that the concentration of acetaldehyde was 37-83 times higher than the general indoor environment. On the other hand, the concentration of total VOCs in the working area can be 21 times higher than other non-working areas. The results suggest that the hazardous airborne substances might be accumulated in the bakeries.
To lower the levels of exposures, bakeries should improve the ventilation and air exchange rate. It is also important to implement work rules, in terms of occupational safety and health, for the baking industry, and to monitor the exposures of inhalable dust and total VOCs.
Keywords: bakeries, air sampling, inhalable flour dust, acetaldehyde, food flavoring
目 錄
中文摘要 ... i
Abstract ... ii
目 錄 ... iii
List of Tables ... v
List of figures ... vi
Chapter 1 Introduction ... 1
1.1 Baking industry in Taiwan ... 2
1.2 Health Effects and Potential Hazards in Bakeries ... 3
1.2.1 Exposure to Flour Dust ... 3
1.2.2 Exposure to Food Flavoring ... 5
1.2.3 Research Objective ... 7
1.2.4 Research Framwork ... 8
Chapter 2 Materials and Methods ... 9
2.1 Selecting Bakeries ... 9
2.2 Walk-through Survey ... 9
2.3 Selecting Hazardous Chemicals ... 10
2.4 Sampling and Analytical Methods ... 11
2.4.1 Instruments and reagents ... 11
2.4.2 Sampling Methods ... 12
2.4.3 Direct Reading Instruments ... 12
2.4.4 Sampling Strategies ... 13
2.4.5 Sample Pretreatments ... 13
2.5 Analytical Methods ... 14
Chapter 3 Results ... 17
3.1 Walk-through surey ... 17
3.1.1 Environmental information ... 17
3.1.2 Number of Workers and Types of Orders ... 18
3.1.3 Personal Protection Equipment ... 18
3.2 Air sampling and analysis ... 19
3.2.1 Factory 1 ... 19
3.2.2 Factory 2 ... 20
3.2.3 Retail store 3 ... 21
3.2.4 Retail store 4 ... 22
3.2.5 Retail store 5 ... 23
3.3 Health Questionnire ... 24
Chapter 4 Discussion ... 26
4.1 Walk-through survey in 10 bakeries ... 26
4.2 Inhalable flour dust and Hazardous Chemicals ... 27
4.2.1 Concentrations of flour dust ... 27
4.2.2 Concentrations of Acetaldehyde and Ketones ... 28
4.2.3 direct-reading instruments ... 29
4.3 Results of Health Questionnaire ... 30
Chapter 5 Conclusions and Recommendations ... 31
5.1 Conclusions ... 31
5.2 Recommendations ... 32
Appendix ... 33
Appendix 1 Health Questionnaires ... 33
Appendix 2. RStudio code and output for Pearson's Chi-squared test ... 39
Reference ... 40
List of Tables
Table 1 Number of chain baking stores and brands in Taiwan ... 44
Table 2 The total number of factories and workers ... 44
Table 3 Sampling methods and results in different reasearch ... 44
Table 4 Air sampling and surveys at food flavoring workplaces ... 45
Table 5 Properties of the analytes ... 46
Table 6 GC-MS conditions of analytes ... 47
Table 7 Retention times and selected ions of GC-MS ... 47
Table 8 Detection limit of target analytes ... 48
Table 9 Walk through survey toward 10 baking workplaces ... 49
Table 10 Orders and products in ten bakeries ... 50
Table 11 Personal protective equipment in 10 bakeries ... 51
Table 12 Factory 1 concentrations of analytes ... 52
Table 13 Factory 2 concentrations of analytes ... 53
Table 14 Retail store 3 concentration of analytes ... 54
Table 15 Retail store 4 concentration of analytes ... 55
Table 16 Retail store 5 concentration of analytes ... 56
Table 17 Demographic characteristics of study subjects (n=68) ... 57
Table18 Lifestyle and general health descriptions (n=68) ... 58
Table19 Prevalence of workers reporting health symptoms (n=68) ... 59
Table 20 Prevalence of workers reporting health symptoms (n=68) ... 59
Table 21 Asthma-like symptoms among different level flour dust exposure groups ... 60
Table 22 Part of materials frequently used in baking industry ... 61
Table 23 Comparison of detected inhalable dust concentration with TLV-TWA ... 64
Table 24 Results of air sampling in baking mix plants ... 64
List of figures
Figure 1 Silica gel tube ... 65
Figure 2 2-(hydroxylmethyl)piperdine treated XAD-2 tube ... 65
Figure 3 IOM sampler with MultiDust Foam Disc [45] ... 65
Figure 4 ppb RAE3000 VOC monitor ... 66
Figure 5 AEROCET 531 Handheld Particle Mass Profiler ... 66
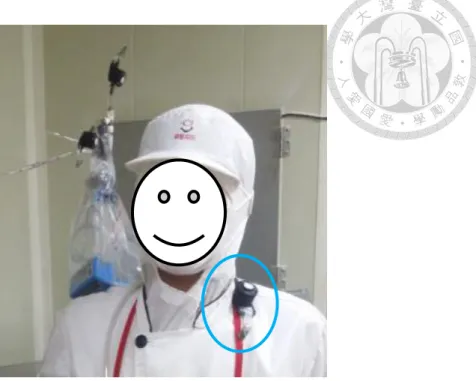
Figure 6 Position of sampler during task-based personal sampling... 67
Figure 7 Chromatograms of diacetyl, 2,3-pentanedione, acetoin, 2,3-hexanedione, 2,3-heptanedione . 68 Figure 8 Chromatograms of acetaldehyde and furfural ... 68
Figure 9 Calibration curve of diacetyl、2,3-pentanedione (0.05-20 ng/μL) ... 69
Figure 10 Calibration curve of acetoin, 2,3-hexanedione, 2,3-heptanedione (0.1-20 ng/μL) ... 69
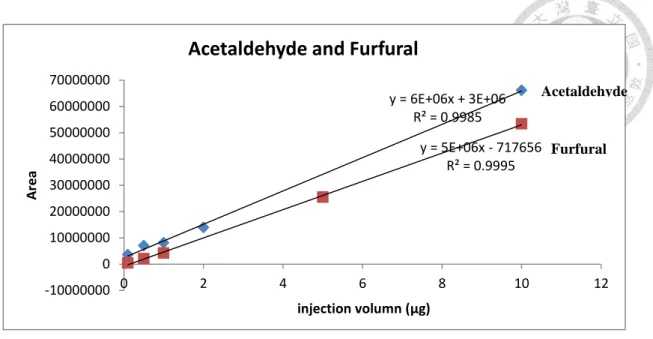
Figure 11 Calibration curve of acetaldehyd and furfural (0.1-10μg) ... 70
Figure 12 Calibration curve of acetaldehyde in back sorbent section (0.08-5μg) ... 70
Figure 13 Factory 1 similar exposure group and sampling sites... 71
Figure 14 Concentrations of total volatile organic compounds in factory 1 ... 71
Figure 15 factory 2 similar exposure group and sampling sites ... 72
Figure 16 Concentrations of total volatile organic compounds in factory 2 ... 72
Figure 17 Particle mass concentrations during flour weighing in factory 2 ... 73
Figure 18 Particle mass concentrations during oil sprayed in factory 2 ... 73
Figure 19 Similar exposure group and sampling sites in retail store 3 ... 74
Figure 20 Particle mass concentrations in retail store 3 ... 74
Figure 21 Retail store 4 similar exposure group and sampling sites ... 75
Figure 22 Retail store 5 similar exposure group and sampling sites ... 76
Figure 23 Concentrations of total volatile organic compounds retail store 5 ... 76
Figure 24 Particle mass concentrations in retail store 5 ... 77
Figure 25 Comparison of detected inhalable dust concentration with TLV-TWA ... 77
Figure 26 Concentration of acetyldehyde in different workplaces ... 78
Figure 27 Average concentrations of ketones at working and counter/office ... 78
Chapter 1 Introduction
According to the Nutrition and Health Survey from the Food and Drug
Administration in Taiwan, a transition trend of food source has been found. Compared to 1993~1996, it was indicated that an increasing proportion of people tend to have more convenient food, such as bread, sandwiches, and hamburgers, as the source of carbohydrate in 2005~2008. [1] ; In correspondence with the trend, the annual value of production reached 50 billion in 2010, according to the Food Industry Research and Development Institute.[2]
With case report started from the 20th century, Baker’s asthma has been a very frequently reported occupational disease, and exposure to flour dust was recognized as the primary cause to trigger allergic reaction.[3][4][5]
In order to enhance the diversity, smell, and taste of products, raw materials used in baking workplaces became more complicated, including widely used food additives, such as the food flavoring which caused severe occupational health events in the U.S.[6]. Furthermore, the necessary mixing, blending, and heating process increased the concentrations of airborn hazards, including dust and organic volatile compounds, which may pose potential health risks toward workers in the bakeries.
1.1 Baking industry in Taiwan
According to the Taiwan Chain Stores and Franchise Association, the number of brands and the number of baking chain stores increased rapidly in recent 10 years.
(Table 1)[7] As shown in Table 2, the total number of factories and the number of workers grew fastly (i.e., 910 enterprise units and 20,428 workers in 2011 with 40 billion revenues).[8] Moreover, accumulated people had certificates of baking were 228,677 in 2014. [9]
The Taiwan Bakery Association reported that there are 4,588 companies taking part in the business association. Compared to the number of total chain stores in Taiwan, it was obvious that the independent bakeries and online shopping companies may also play an important role in this industry.[10] On the other hand, the Taipei Bakery Association showed that the number of baking retail stores and the combinative coffee shops has exceeded 9000, and 10,000, respectively. [2]
1.2 Health Effects and Potential Hazards in Bakeries
1.2.1 Exposure to Flour Dust
In the baking process, workers need to weigh and sieve flour, sugar, and other baking powder before mixing with eggs, food flavoring, yeast, and butter. At the same time, they prepare different stuffings with butter, food flavoring, and sugar. Dough would then be divided, shaped, and fermented under different temperature and humidity. Finally, workers would bake dough with different temperatures after applying oil on the dough and baking plates.
It was indicated that 5-19% of adults’ asthma results from occupational exposure.
With case report started from the 20th century, bakers’asthma is one of the most frequently reported occupational asthma. [11] The symtoms include cough, shortness of breath, wheezing, and chest tightness.[4] Significant correlation was reported between asthmatic symtoms and positive skin prick allergy tests to wheat flour, rye flour, and soy bean flour. Therefore, exposure to flour dust and other allergens in bakeries was generally recognized as the primary risk factor.[2][3][12]As a result, both the American Conference of Industrial Hygienists (ACGIH) and the Cal/OSHA had set the Occupational Exposure Limits (OELs) of 0.5 mg/m3 for the inhalable flour dust. [4]
In Finnish, Frence, Astralia, USA, and Germany, the prevalences for Baker’s asthma ranged from 4% to 10%, and were about 14-23% for rhinitis. [2][3][4][13][14]
In a two-year follow-up study toward new apprentices, 41.2% developed rhinitis and
the cumulative incidence of asthma-like symptoms reached 20.5%. [11]The epidemiological research in Germany maintained that bakers’ risk of getting
obstructive lung disease was 50 times higher than the average risk of other professions.
[3]
In 2003, a research that included 70 industrial and traditional bakeries was conducted in Belgium. The average concentration of inhalable flour dust reached 2.10 mg/m3 in traditional bakeries, and 1.06 mg/m3 in industrial bakeries. [15] R Baatjies et al. (2007) pointed out that bakers in charge of making dough and operating mixing machine had the highest exposure to flour dust, which was 0.904 mg/m3. [16] In 2010 and 2013, the survey carried out by the National Institute for Occupational Safety and Health (NIOSH) found out that the median concentration was up to 8.21mg/m3, and workers in high exposure group were more likely to undergo wheezing, runny nose, itchy eyes, and watery eyes. [4][17]In conclusion, the research showed that the concentration of inhalable flour dust ranged from 0.125 to 8.21mg/m3. (Table 3) Furthermore, Burdorf A et al. (1994) reported that in the total mass of inhalable dust, 39% is thoracic subfraction, and 19% is respirable subfraction. [17][18] [20][21] Even though great attention has been raised regarding the exposure to flour dust in many countries, there is no regulation toward exposure to flour dust at workplaces in Taiwan.
[20]
1.2.2 Exposure to Food Flavoring
It was reported elsewhere that over 540 kinds of volatile organic compounds were released naturally during the baking process, and additional food flavoring was used to enhance the smell and aroma. [23][24] M. I. Rincon-Delgadillo et al. (2012) and other baking ingredient stores indicated that flavoring substances were widely added in variable products commonly used in the bakeries, such as sour cream, cottage cheese, and margarine.[25][26] The detected concentration reached 22,000μg/g in the products.
[27]
In 1958, the USFDA started the “GRAS”program. Through examining
toxicological data, many food additives and flavoring substances were classified as
"Generally Recognized as Safe (GRAS)".[28][29][30] However, as pointed out by the US Department of Labor, while the flavorings may be safe when eaten, the health effects via inhalation is unknown since the exposure routes other than ingestion were not considered. [6]
In 2000, NIOSH started the investigations regarding the microwave popcorn manufacturing facilities and food flavoring plants, since several former workers were diagnosed with a severe, rare lung disease, bronchiolitis obliterans. Current workers
also had fixed airway obstruction which indicated lung function abnormalities.
Diacetyl, which was extensively used to produce a variety of food flavoring, was identified as the most common air contaminants and was considered as the primary risk factor. [6][31][32]
As shown in Table 4, it was found that the concentration of total volatile organic compounds in flavoring manufacturing plant reached 100,000 ppb in 2007. As for diacetyl and acetoin, the concentrations of 0.002-0.235ppm were determined. [33] In 2012, the US OSHA detected diacetyl in 8-hr TWA of 4.31 ppm and short-term concentration of 50.95 ppm, which exceeded the ACGIH TWA (0.01 ppm) as well as the STEL (STEL, 0.02 ppm) in the flavoring industry. [34][35]
Apart from diacetyl, up to 150 volitile organic compounds (VOCs) was detected, including acetoin, 2,3-pentanedione, acetic acid, furfural, and acetaldehyde. [6][33] In animal studies, the above compounds were found to influence important
macromolecules such as DNA, structural proteins, and enzymes, especially for furfural and acetaldehyde. [36][37][38][39]
Some flavorings plants started to use less hazardous diacetyl substitute, including diacetyl trimer, 2,3-pentanedione, 2,3-hexanedione, and 2,3-heptanedione. However, in 2012, the US OSHA alerted that the toxicities of the substitutes may be similar to diacetyl because of the similar functional α-diketone group. [6][32]
During mixing, blending, and heating process under 200-300C, flavoring
substances volatilized and high air concentrations of various compounds have been observed. [6][32]Food and Drug Administration in Taiwan have positive listings to regulate food additives in Taiwan, but there is no regulation or recommendation toward industry dealing with flavoring substances.[40][41] In addition, baking workplaces in Taiwan tended to be crowded and poorly ventilated, and the long term overexposure to flour dust and flavoring substances may be even risky for the workers.[42]
1.2.3 Research Objective
As mentioned in the research background, the information of chemical and flour dust exposure in bakeries in Taiwan was limited. Therefore, the aims of this study were to: 1) describe the environmental characteristics related to occupational hazards; 2) identify and measure the air concentrations of flour dust and chemicals in bakeries; 3) administrate health questionnaire to collect the information on worker’s health status.
1.2.4 Research Framwork
Gather information of Baking industry & Flour dust and Food flavoring
Walk-through survey
Environmental factors, raw materials,& personal protective equipment
Air sampling and analysis
Average environmental concentrationsDirect reading instrument for total VOCs and particle
Flour dust and chemicals exposure assessments in bakeries
Health and safety reccomendations
Administrate
Questionnaires
Chapter 2 Materials and Methods
2.1 Selecting Bakeries
In Taiwan, stores selling baking products can be categorized into baking retail stores, chain stores, combinative coffee shops, convenient stores, supermarkets, and online shopping platforms. The common retail store has its factory/kitchen in the same building. (前店後廠)[43] Some of the chain retail stores are only dealing with selling, packaging, heating or baking of the semifinished products and leave its central factories or kitchens in charge of producing.
Through telephone inquiries and administrative documents, 15 bakeries were included in the study, and air sampling was conducted in 5 of the 15 bakeries, which were scattered in Taipei City, New Taipei City, Taoyuan City, Hsinchu City, Changhua City, and Kaohsiung City.
2.2 Walk-through Survey
During walk-through surveya, field information were recorded based on bakeries owners’ and workers’ reports, or researcher’s observation, including environmental
factors, working conditions, raw materials and personal protective equipments used.
For instance, the surface areas of the bakeries, the number of workers, the number of branches, the ventilation system, and the operating procedures were noted. In addition, in order to gather the information of food flavoring, the ingredients labled on frequently used materials were recorded by cameras.
2.3 Selecting Hazardous Chemicals
According to the literature reported elsewhere, the Flavor and Extract
Manufacturers Association (FEMA) identified 34 "high priority" flavoring substances which potentially posed respiratory risk. Among them, diacetyl, acetoin,
2,3-pentanedione, 2,3-hexanedione, and 2,3-heptanedione were chosen to be monitored the airborne concentrations. (Table 5) [32][44]
Research in recent years further recognized that wheat lipid transfer protein, lactoserum, and rye were potential allergens in the bakeries, and it is reported that the concentrations of flour dust corresponded to the amount of allergens. [45][46][47][48]
Therefore, inhalable flour dusts were chosen to measure by the IOM multidust sampler.
2.4 Sampling and Analytical Methods
2.4.1 Instruments and reagents
Ethanol: 99.9%, A.C.S. Reagent, J.T. Baker.
Toluene: 99.9%, Gradient Grade for Liquid Chromatography, Merck.
2,3-Pentanedione, analytical standard, Aldrich.
Acetoin, analytical standard, Aldrich.
2,3-Hexaneedione, analytical standard, Aldrich.
2,3-Heptaneedione, analytical standard, Aldrich.
Diacetyl, analytical standard, Aldrich.
Acetaldehyde, analytical standard, Aldrich.
Furfural, analytical standard, Aldrich.
XAD-2 treated with 2-HMP: SKC Cat. No. 226-118.
Silica gel tube: SKC Cat. No. 226-183.
Sampling pump: GilAir Plus, SENSIDYNE.
Gas chromatography column: DB-5MS, length 60 meters, I.D. 0.32 mm, Film 0.25μm, J&W
Scientific.
Gas chromatography column: Rtx-Volatiles, length 60 meters, I.D. 0.32 mm, Film 1.5μm,
RESTEK.
Gas chromatography mass spectrometry: Agilent 6890GC, Agilent.
IAQ Monitor: AirBoxx IAQ Monitor, KD Engineering.
Flow rate calibrator: BIOS Defender 510-M, DryCal Technology.
IOM sampler with MultiDust Foam Disc: SKC Cat. No. 225-70A.
2.4.2 Sampling Methods
Air sampling methods in this study were adopted from both the National Institute for Occupational Safety and Health (NIOSH) and the US OSHA, which were OSHA 1013, NIOSH 2538, NIOSH 2529, and NIOSH 2539. [49][50][51] During sampling, two Gilair plus personal sampling pumps were connected to the IOM sampler and the sorbent tubes, respectively. Silica gel tube and the XAD-2 tube were connected to the pump in parallel.
Diacetyl, acetoin, 2,3-pentanedione, 2,3-hexanedione, and 2,3-heptanedione were sampled by two silica gel tubes connected in series to a sampling pump which was calibrated at a flow rate of 100 mL/min. (Figure 1) [52] In addition, 2-(hydroxymethyl) piperidine treated XAD-2 tubes were used to measure furfural and acetaldehyde under 35 mL/min of flow rate. (Figure 2) Meanwhile, Inhalable flour dust and respirable flour dust were sampled by using IOM sampling heads with Teflon® filters (pore size 1.0 micro with) and MultiDust Foam Discs under 2000 mL/min of flow rate. (Figure 3)
2.4.3 Direct Reading Instruments
In order to gather the concentration profiles of VOCs and particle mass, ppb RAE3000 was used to monitor the total VOCs and AEROCET 531 was used to measure PM1, PM2.5, PM7, PM10, and TSP.(Figure 4Figure 5)
2.4.4 Sampling Strategies
At each bakery, air samples were taken at four different sites, including weighing
area, baking area, dough making/decorating area, and office/counter. The samplers were placed at bakers’ breathing zone height (1.3-1.5 meters). The sampling duration
was 5 hours. Two field blanks and more than one lab blanks were prepared for each sampling and analysis. The flow rates were calibrated before and after sampling.
Task-based personal sampling of inhalable flour dust was carried out at one bekery on a worker in charge of weighing flour dust and food flavoring dust, and the task lasted for 42 min, approximately. As shown in Figure 6, the sampler was put on the worker’s
chest.
2.4.5 Sample Pretreatments
After sampling, the adsorbent tubes were covered by lids, sealed with parafilm, shipped to laboratory, and then stored in the fridge. Before desorbing, sorbent was poured into a 4 mL vial. Xad-2 sorbent was desorbed by 2 mL tolulene followed by 60 mins ultrasonic bath. As for silica gel tube, 2 mL ethanol:water (95:5) was used
followed by mechanical shaking for 60 minutes. Finally, supernatant was transferred to a new 1.8 mL vial for analysis and storage. [49][50]
As for the IOM sampler, Teflon® filters and IOM multidust foam discs were
conditioned over 24 hours in a chamber under temperature (20oC) and humidity (35%) control. Pre-weigh and post-weigh the whole cassette were conducted to acquire the mass of inhalable dust. In order to acquire the mass of respirable dust, cassette was weighed for the second run after removing the multidust foam disc. [51]
2.5 Analytical Methods
2.5.1 Instrumental Analysis and calibration curves
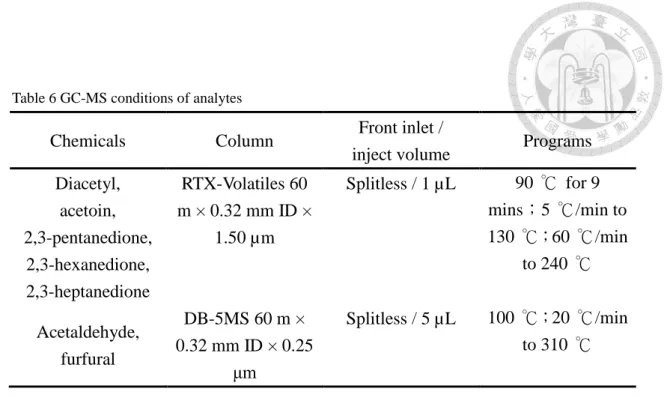
Gas chromatography with mass spectrometry (GC-MS) was applied to analyze the samples. Diacetyl, 2,3-pentanedione, acetoin, 2,3-hexanedione, and 2,3-heptanedione were separated by a RTX-Volatiles column. To analyze acetaldehyde and furfural, a DB-5MS column was used. Detailed information listed in Table 6 including oven program, injection setting and inlet temperature.
The mass spectrometry was operated in electron ionization at 70 eV and quantitative analysis was conducted by selected ion monitoring (SIM) mode. (Table 7) The
chromatograms of analytes were shown in Figure 7Figure 8.
2.5.2 Calibration Curve
The chemical standard solutions were used to verify and develop the analytical
method. The calibration curves with concentration ranges were shown in Figure 9Figure 10Figure 11Figure 12, and good linearity was indicated with R2 =0.99.
Acetaldehyde and furfural standard stock solutions were injected on the XAD-2 sorbent to prepare calibration curve. In addition, because the mass of acetaldehyde in front and back sorbent sections were different, two different calibration curves were performed and applied.
2.5.3 Determination of the mass of analytes in the air
After acquiring the mass of analytes on the sorbent from calibration curve, the air
concentrations could be derived from the following calculation.
C=(W
f+W
b-B
f-B
b)/V
C:the mass of analytes in the air (mg/m3) V : air volume sampled (m3)
Wf:the mass in the sample front sorbent (mg) Wb:the mass in the sample back sorbent (mg)
Bf:the mass in the average media blank front sorbent (mg) Bb:the mass in the average media blank back sorbent (mg)
2.5.4 Method Detection Limit (MDL)
According to the method of US Environmental Protection Agency (EPA), the
method detection limit (MDL) was calculated by the below formula. [53]
MDL = (standard deviation of replicate analysis) × (student’s t value for 99 % confidence level with n-1 degrees of freedom) ; standard deviations were obtained by repeating the lowest concentrations of calibration curves for seven times.
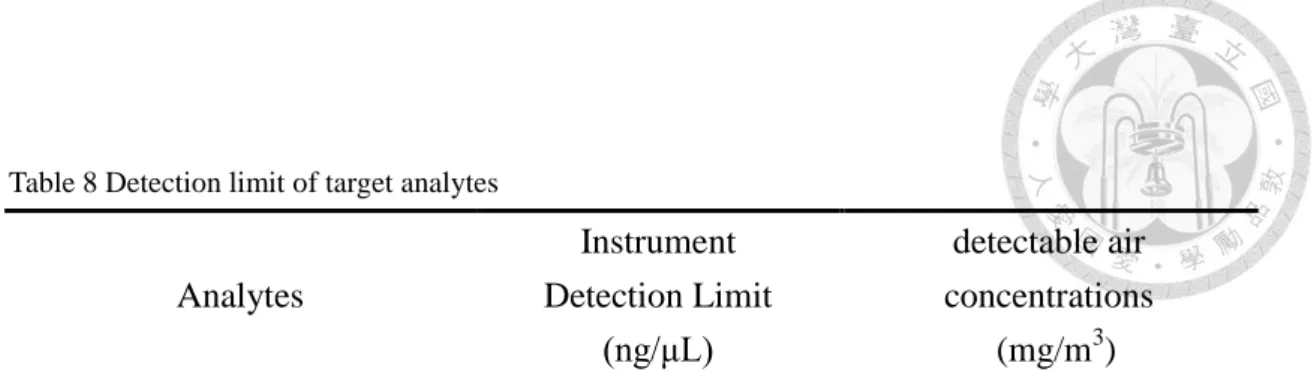
If under the 100 % desorption efficiency conditions, the detectable air concentrations for in this study were calculated by detectable air concentrations
=MDL×desorption volume/ air volume sampled (Table 8)
Chapter 3 Results
3.1 Walk-through survey
This study visited 15 baking workplaces, including 8 factories, 4 traditional retail stores, 1 retail store with online shopping platform, and 2 chain retail stores. The information of working environment, types of orders, and personal protective equipments used were collected.
3.1.1 Environmental information
Apart from traditional retail stores, a number of the chain retail stores located at commercial area with limited working space. Hence, the stores were only in charge of packaging and selling breads, while there were central kitchens/factories operated at different locations. For the stores far from the factories, half-finished frozen doughs were delivered to the retail stores followed by the decorating/baking tasks.
As shown in Table 9, the size of factories tended to be larger. Most of the workplaces were not equipped with local exhaust ventilation systems. In addition, standing fans with larger flowing rate were equipped at two workplaces, which may lead to the resuspension of flour dust.
3.1.2 Number of Workers and Types of Orders
There were usually more workers in factories and workers tended to separated further into small groups, such as, flour weighing/mixing, dough shaping, and
packaging; therefore, workers in factories may repeat the same tasks all day in similar working area, which was a crucial factor to exposure profile.
In addition, the bakers in chain retail stores may expose to high concentration of flavoring substances, because they repeated baking semi-finished dough all day in crowded kitchen. Futhermore, as shown in Table 10, the workload may be variable due to the catering and lunch box orders, which were deeply related to the extra work hours
and usage of different types of raw material. Some factories did shift working especially on sepcial festivals such as mother’s day
3.1.3 Personal Protection Equipment
The wearing of working suit in baking worplace considered more about protecting the food safty, therefore, workers need to wear clean working shoes, strip cap, and working suits to enter factories. At dough making area, most workers did not wear gloves because it was inconvenient during blending dough by arms. (Table 11)
3.2 Air sampling and analysis
Air sampling was conducted at 5 baking workplace, which located in Taipei City, New Taipei city, Hsinchu City, and Taoyuan City.
3.2.1 Factory 1
This is a well-known brand with 30 branches in Taiwan. The facrories is 4000 m2, and the sampling sites located in the working area on the second and third floor, as show in Figure 13. The first round of baking tasks was at 4 -10 am in 2F, and the second run baking process finished at 1:00 pm in 3F. There were around 30 workers at the sampling day
The air conditioner was on, and there was ventilation system connected to ovens only on the third floor, the ventilation system is 1.5 m above the tunnel ovens. There were 4 sampling sites at weiging room (A), 2F baking room (B), 3F baking room (C), and office in which sometimes microbial experiments were conducted and was next door to the weighing room (D).
As shown in Table 12, the concentrations of inhalable flour dust (0.55 mg/m3) exceeded TLV-TWA of 0.5 mg/m3, and the other one (0.41 mg/m3) exceeded 1/2 TLV-TWA. Ketones were detected at four sites and with higher concentration in weighing room. Even though it was lower than 1/10 PEL, the concentration of
acetaldehyde was much higher, especially in weighing room room. (Table 12) Because
the baking task ended before the time we stopped sampling, so if we adjusted the sampling time according to working time, the workers’ exposure concentration may be
3-5 times higher than detected.
As for the result of direct-reading instrument, Figure 14 indicated that the total VOCs reached 5000ppb, which was 21 times higher than non-working area (1F).
Moreover, the VOCs concentration opposite trends in 2F and 3F revealed that VOCs may accumulate in the working area during baking process; for instance, the
concentration in 2F was higher in the morning when the first run of baking task finished.
3.2.2 Factory 2
This was an industrial bakery which provided cakes for supermarkets and
convenient stores. The facrories was 1653 m2; Shaping and decorating was conducted on the first floor, and baking area was on the second floor. The task started at 8 am, and finished around 6 pm. There were 45 workers on the sampling day. The air conditioner was on, and there was ventilation systems connected to the tunnel ovens. There were 4 sampling sites at weiging room (A), 2F baking tunnel ovens (B), 3F cake decorating area (C), and office (D). (Figure 15)
The highest concentrations of inhalable dust were 0.82 mg/m3, which exceeded TLV-TWA of 0.5 mg/m3, and the concentration of 42 mins task-based personal sampling was 0.83 mg/m3. (Table 13) Both acetaldehyde and furfural were detected, and the highest concentration of acetaldehyde measured around tunnel ovens.
The TVOCs direct reading instrument showed the ventilation system on the second floor needed to be improved. After entering the factory, the TVOCs
concentration rose fastly, the highest concentration of TVOCs was 8,678 ppb, 21 times higher than concentration in office. (Figure 16) As shown in Figure 17Figure 18, the particle mass concentration in flour-weighing room and oil-spryed room were much higher than the concentration in office; total suspended particles were measured 0.697 and 9.47 mg/m3, respectively.
3.2.3 Retail store 3
This is a well-known traditional bakery in central Taiwan, with the surfaces of 331 m2. The stores mainly produced traditional cakes and moon cake. The materials were simple and no food flavorings were used during the process. The flexible amount of production depended on the selling condition. It was not the busy season for the store on the sampling day.
All windows and doors were open when air sampling was conducted, and there
were ventilation systems connected to ovens. There were 11 workers on the sampling day, and 4 sampling sites located at weiging and theiving area (A), baking areas (B), working table (C), and counter (D). (Figure 19)
Higher concentration of flour dust was detected around ovens and working table, which were higher than 1/2 TLV-TWA. The concentration of 2,3-heptanedione was higher beside counter, it may result from the cooling and packaging tasks conducted there.(Table 14)
This store is the only one without the detectable acetaldehyde, and coincided on the low direct-reading TVOCs concentrations, which were all lower than 400 ppb. As for total particle mass shown in Figure 20, the concentration peaked at 0.278 mg/m3 during pouring flour dust.
3.2.4 Retail store 4
This was not only a retail store but also a popular online shopping brand. With the surfaces of 116 m2, the store was on the first flour and cakes and breads were produced on the basement floor. They normally started to bake at 10 am, and there were 6 workers on the sampling day.
The only ventilation device was a window fan and the basement was crowded.
The 4 sampling sites were set up near weiging and mixing area (A), ovens(B), heating
area (C), and warehouse(D). (Figure 21)
The concentrations of inhalable dust at A, B, C sampling sites exceeded 1/2 TLV-TWA, the concentration at baking area reached 0.77 mg/m3. Workers did not wear any mask, and due to the poor air circulation in basement, it was also hot in the
afternoon. Higher acetaldehyde concentration detected at heating area and warehouse.
(Table 15)
3.2.5 Retail store 5
This was a chain store of a famous brand located in Taipei City, with the surfaces of 149 m2. Breads was sold on the first floor, and a small proportion of bread was produced on the second floor. The ventilation system were connected to ovens and air circulation was pretty good on the second floor. The 4 sampling sites were set up near working table (A), working table (B), counter (C), and stairs(D). (Figure 22)
The concentrations of inhalable dust were the lowest among 5 bakeries. Acetoin and acetaldehyde were detected at all sampling sites. (table 16) Most of breads were produced by their central factories in New Taipei City, and shipped to this chain store for selling. So there were lots of breads and cakes put besides counter and waited to be packaged and placed on shelves. This was probably the reason why the concentrations of TVOCs would be higher on the first floor than the second floor, which was over
2000ppb, 4-5 times the outdoor concentrations. (Figure 23)
3.3 Health Questionnire
Questionnaires were designed based on respiratory disease questionnaire created by American Thoracic Society administrated and NIOSH’s plants investigation questionnaire in 2009. [52][54] Participants’ demographic data, disease history , health status, and on-job symptoms were recorded. (appendix 1)
Highlights of the results
1. The participants’ demographic data is listed in Table 17. The percentage of male and female is similar.
2. The average work years in baking industry were 7.15 years, 77.9% workers needed to work at least 10 hours per day. And 92.6% workers had (less than) 6 days vacations per monthes. (Table 17)
3. 26.4% and 8.8% workers had smoking and drinking habit, respectively. 19%
workers believed they were less healthy than people at the same age. (Table18) 4. 10.2% had hands/face skin disease, 20.5% had tendinitis/ arthritis, and 36.7%
had nose or skin allergy. (Table18)
5. About asthmatic symptoms, 14.7% had a cough over 3 monthes, 23.5% had
shortness of breath, 2.9% still have asthma. (Table18)
6. During the work in past 12 months, 8.8% workers often had eye/nose/throat symptoms, and 10.2% often had Runny nose and stuffy nose.(Table19)
7. In the past 12 monthes, 3-10% workers often/always had skin issues, and 20%
for musculoskeletal symptoms. (Table 20)
8. In the past 12 monthes, 23.4% worker thought the workplaces were too hot, and only 45% workers thought the ventilation were good. (Table 20)
9. As shown in Table 21, apart from calculated the prevalence of symptoms, participants were divided into two groups based on their tasks. High exposure group were in charge with weighing flour, mixing ingredients, and cake making, and low exposure group were responsible for shaping dough, packaging, and decorating. After grouping, prevalences of asthma-like symptoms of the two groups were derived, and Pearson's Chi-squared tests were conducted to test the significance of odds ratio in RStudio. (appendix 2) The result indicated that odds ratio = 3.2, p-value = 0.02, which meant the prevalence of asthmatic group in high exposure group was significant higher than that in low exposure group.
Chapter 4 Discussion
4.1 Walk-through survey in 10 bakeries
Environmental factors differed a lot in various kinds of bakeries. All tasks were conducted in the same room in traditional retail stores, so the highest concentrations of flour dust were not necessary near the flour handling sites due to wind flow. Even though industrial bakeries may have better local ventilation systems connected to the ovens, the circulating air conditioning and the large amount of baking tasks may still lead to high concentrations of hazardous chemicals.
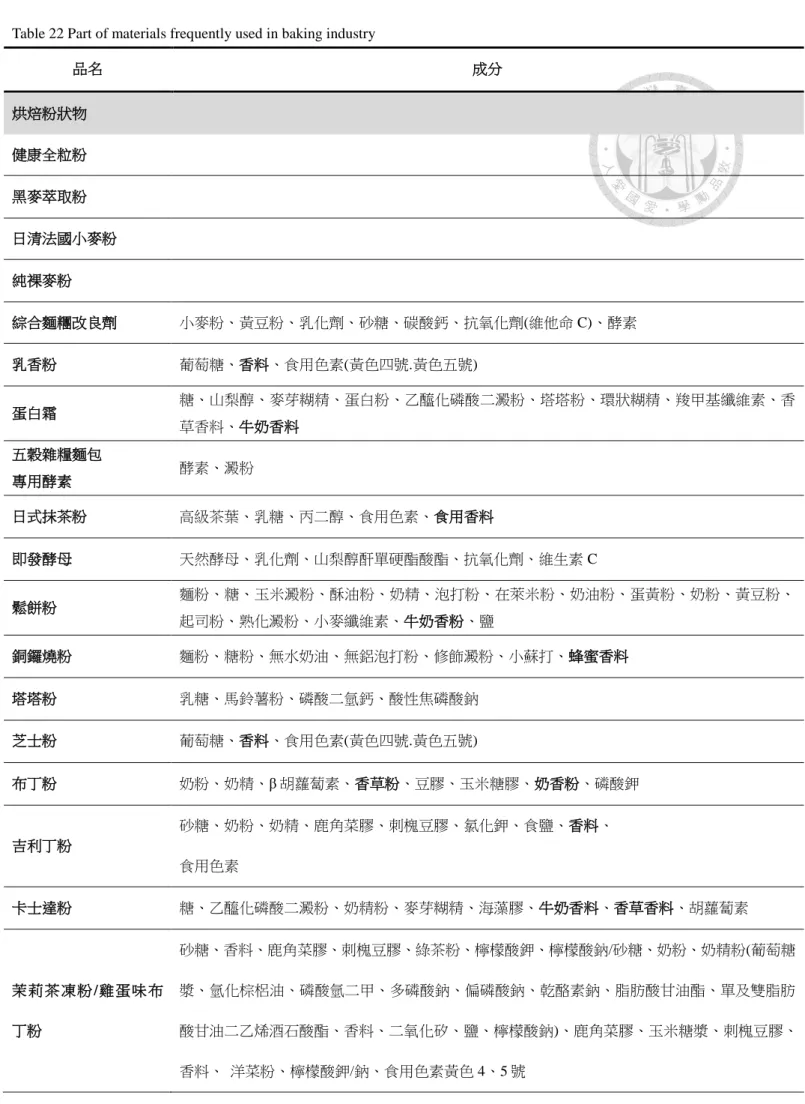
As shown in Table 22, since food flavorings are added into diverse raw material in the bakeries, more research will be needed to explore the influence to workers’ health, including skin symtoms for workers incharge of shaping and decorating dough.
The usage of personal protection equipement varied from stores to stores, and the
purpose of wearing mask was to follow the food safety regulation, but not to protect workers’ health. The most commonly used was surgical mask, which may not be
practical to protect workers from the exposure to flour dust and chemicals.
For those workers in charge of cooking and controlling oven temperature, the heat exposure and skin burns issues were also critical. Naomi Sharon et al. (2008) indicated that long term exposure to heat during monitoring baking process may result
in the damage of the lens epithelial cells. [55]
4.2 Inhalable flour dust and Hazardous Chemicals
4.2.1 Concentrations of flour dust
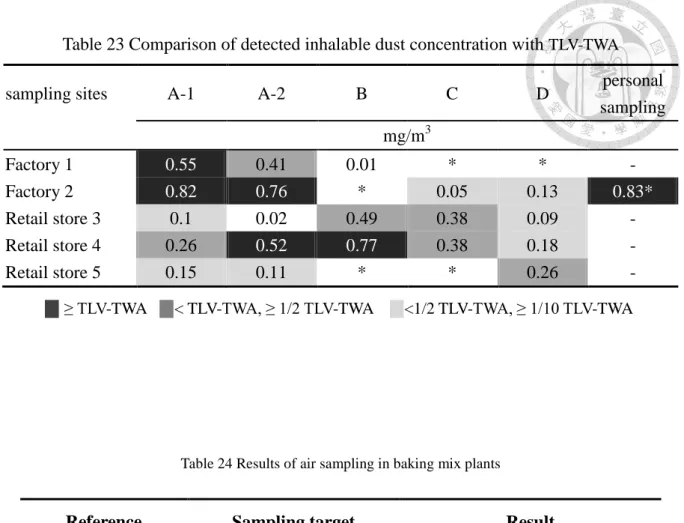
Among the 5 bakeries conducted air sampling, 23% of the samples with
concentration exceeded the ACGIH TLV-TWA for flour dust of 0.5 mg/m3[48];46.2%
of the samples exceeded 1/2 TLV-TWA;73% of the samples exceeded 1/10 TLV-TWA.
(Table 23) However, there were only 7 out of 15 workplaces requested workers to wear mask. In addition, masks offered by most of the companies were very thin and there was no regulation to remind workers of changing mask periodically.
Considering the frequently occurred skin/nose allergic and respiratory symptoms, exposures to flour dust were the most crucial issue in the industry, in terms of occupational safety and health.
Furthermore, the Figure 25 indicated that the clear job and working area division caused the different patterns of inhalable flour dust among dissimilar bakeries. In factory 1 and factory 2, the high inhalable dust concentrations were only detected at the weighing area.
The concentration ranges of the inhalable flour dust were 0.01-0.83 mg/m3 in this research, while 0.125-93 mg/m3 was determined from other studies. [4][15][16] The
highest proportion of respirable dust is 36% detected in factory 2, which is higher than 19% indicated in Burdorf A. et al. (1994)[17]
4.2.2 Concentrations of Acetaldehyde and Ketones
As shown in Figure 26, P. Lovreglio et al. (2009) reported the average residential concentration of acetaldehyde was 0.010 mg/m3 in Italy [56], and S. Uchiyama et al.
(2015) found that it was 0.022 mg/m3 in Japan. [57] The highest concentration of acetaldehyde determined was 0.83 mg/m3 in this research, which was around 37-83 times higher than the residential concentration. In addition, J.H. Cheng et al. (2015) found that the highest concentration of acetaldehyde was 0.086 mg/m3 among 6 different types of restaurants. Hence, the highest concentration detected in the bakeries in this study was ten times higher than the concentrations found in the restaurants previously. [58]
Apart from acetaldehyde, ketones were also identified in bakeries. All ketones were detected in low air concentrations, which were similar to the finding reported by two researches conducted in baking mix plants by G. Day et al. in 2009 and 2011.
(Table 24) However, according to field observation, workers in industrial bakeries
might still expose to large amount of food flavoring during some tasks, especially for the industrial ones, since every worker was in charge of a particular task. For example, workers in weighing room may expose to food flavoring dust for all day.
On the other hand, the Figure 27 showed the average concentrations of ketones in working and non-working area. For some ketones were detected in relatively higher concentrations at non-working area, it may resulted from the cooling and packaging tasks conducted beside counter in the retail stores.
4.2.3 direct-reading instruments
As for the result from direct-reading instruments, the concentration of total volatile organic compounds reached 5000 ppb-8000 ppb, which was 21 times higher than non-working areas, such as the office. With air conditioner running, the TVOCs concentration of 3000 ppb was still detected in the office of factory 1, where no operation was conducted. The concentration of 3000 ppb was 13 times higher than the rooms out of the floor where factory 1 located. The above finding pointed out that the exchange rate of the air conditioner needed to be improved.
4.3 Results of Health Questionnaire
The health questionnaire indicated the high prevalence of eyes (8.8%), respiratory (8-23.5%), allergic symptoms (36.7%), asthmatic symptoms (5.8-23.5%),
musculoskeletal (20%), and skin symptoms (3-10%). G.Y. Hur et al. (2007) also reported high prevalence (17%) of upper and lower respiratory symptoms in Korean bakeries. Keeping the same standing posture, repeated action, and heavy lift may be the reason why 20% of the workers usually had musculoskeletal disorders. Some workers expressed that being contact to flour dust, oil-sprayed, and yeast resulted in eyes and skin symptoms, and the denser smell in bakeries was from cooking fume and cheese.
Chapter 5 Conclusions and Recommendations
5.1 Conclusions
To the best of our knowledge, this study provided the first survey of airborne hazards in the baking workplaces in Taiwan. The concentration range of inhalable dust was 0.01-0.83 mg/m3, and 23% of the samples collected were higher than the ACGIH TLV-TWA (0.5mg/m3). As to the other chemicals, such as aldehydes and ketones, the concentrations were all well below PEL-TWA. However, the high TVOCs direct-reading concentrations at workplaces indicated that the ventilation system needed to be improved.
Moreover, some repeated tasks in the factories might be risky, especially for workers in weighing room and oil-sprayed area where they exposed to high concentrations of flour dust and food flavoring particle.
The results of questionnaire also stated that the prevalence of on job health symtoms were relatively high, including respiratory, skin, nose, and musculoskeletal symptoms. The exposure of the flour dust was suspected to play an important role for the causes.
5.2 Recommendations
1. To reduce the accumulation of hazardous chemicals, the air exchange rate should be increased, while ventilation systems connected to ovens should be equipped to lower down the temperature of the surrounding area
2. To provide suitable personal protection equipments, while workers with asthma history should be transferred to tasks with lower flour dust exposure
Activated carbon masks and dust masks could be provided at different working areas. Workers with asthma history and respiratory symptoms should avoid tasks in weighing and mixing room, and should be transferred to shaping, decorating, and packaging areas.
3. To cover the basket during weighing, sieving, and pouring flour dust. And weighing flour could be done on the table, since it can reduce airborn flour dust if the tools were closer to the containers. Local exhaust ventilation system is also recommended in the flour weighing room.
4. To improve the efficiency of the local exhaust ventilation system, when cooking and frying are conducted indoors, to prevent the accumulation of the cooking fume
5. Using glove is adviced to avoid skin irritation when performing cleaning job with detergents
Appendix
Appendix 1 Health Questionnaires
臺灣糕餅烘焙業者健康問卷調查
主辦單位: 勞動部勞動及職業安全衛生研究所
研究單位:國立臺灣大學環境衛生研究所
您好!這份問卷是想了解您工作時的基本健康狀況 為了增進您的健康,以及提供往後烘焙業職場安全衛生的建議 我們希望透過這份問卷了解烘焙業者工作情形、員工健康狀況
感謝您耐心回答下列問題
問卷結果僅供研究用途,結果也會以整體數據而非個人資料呈現 希望透過這個研究,我們能幫助你們工作同時也能保護身體健康
問卷為匿名方式,敬請放心填寫!
若填寫上有任何建議或問題,可註記在題目旁或空白處,
或聯絡 台大環境衛生所 張佩婷 小姐 E-mail:[email protected]
手機:0912206577
非常感謝您的幫忙,願意撥空接受我們的問卷調查!
一、基本資料
1. 年齡:__________
2. 性別:_____
3. 身高: _______公分 ; 體重: _______公斤
4. 學歷: □國小 □國中 □高中職 □大學專科 □碩士以上 二、工作型態
1. 工作店家名稱:_______________
2. 全職或兼職: 全職 兼職
3. 職別:烘焙師(傅) 學徒 收銀員 廚房人員 麵包搬運送貨員
其他:____
4. 您總共在本店/廠工作:_____年_____月
5. 您總共在烘焙業工作:____年____月
6. 每週需工作幾天:____天,或者月休____天
7. 通常____點上班~____點下班,每周約加班_____小時
每日大約工作內容(請填數字。 若同時進行多個工作,大略填寫主要工作即可)
1:秤、篩麵粉,糖粉,發粉 2:使用麵粉攪拌機 3:手揉麵團 4:控制麵包發
酵 5:切割、整形麵團 6:西點、蛋糕製作 7:控制烤箱溫度 8:裝飾加料 9:出爐、冷卻 10:包裝、運送出貨 11:結帳 12:炸豬油、烹煮 13:清洗用 具、環境
08 點之前:______________________________________
08~12 點:______________________________________
下午 1~5 點:____________________________________
下午 5~9 點:____________________________________
三、日常作息及一般健康狀況 1. (1)請問您有抽菸的習慣嗎?
有 以前有,現在已戒菸 從來沒有(請跳第 2.題)
(2)請問您 現在/以前有吸菸時 的吸菸量?
每天半包 每天一包 每天 1.5 包 每天 2 包 每天 2.5 包以上
(3)請問您 到現在/以前有吸菸時 總共抽菸幾年?
總共________年
2. 請問您現在是否有喝酒的習慣?
有,每周約喝_______毫升(cc),哪一種酒: _________酒
沒有
3. 請問您有沒有運動的習慣?
有,每周________小時 沒有
4. 請問您覺得最近一年來,與同年齡的人相比,自己健康狀況如何?
很好 還不錯 普通 較差 很差
5. 您現在或曾經被醫生診斷有以下疾病嗎?(請勾選)
無 曾經有,已治好 現在有,治療中
(1)
心臟病(2)
糖尿病(3)
高血壓(4)
肌腱炎(5)
關節炎(6)
脊椎、椎間盤疾患(7)
鼻炎(8)
肺炎、氣管炎(9)
肺氣腫(10)
手、臉部皮膚病(11)
月經失調6. 您有被醫生診斷出鼻子過敏、皮膚過敏嗎? 有 沒有(跳第 7.題)
若有:
(1)小時候就有過敏體質嗎? 有 沒有
7. 您最近有咳嗽症狀嗎 有 沒有(跳到第 8.題)
若有:
(1)曾經連續咳嗽三個月或更久嗎? 有 沒有
(2)休假時,咳嗽的情形怎麼樣? 相同 改善 更常咳嗽
8. 快速行走或爬緩坡時,會有呼吸急促難以調節的情況嗎? 有 沒有(跳
第 9.題) 若有:
(1)與同年齡人相比,情況有沒有比較明顯? 有 沒有 (2)曾有需要停止前進以緩和呼吸的情況嗎? 有 沒有
9. 過去 12 個月,呼吸時是否曾有哮喘、喘鳴(咻咻)聲響? 有 沒有(跳 第 10.題)
若有:
10. 曾經被醫生診斷為「氣喘」嗎? 有 沒有(跳到第 11.題) 若有:
(1)最近一次得到氣喘是哪年、哪月? ____年____月 (2)當時有在烘焙業嗎?
沒有 有,當時已經在烘焙業工作____年/月(圈選) (3)現在還有「氣喘」嗎? 有 沒有
(4)現在還有用藥嗎(吃藥、噴劑)? 有 沒有
(5)放假時,氣喘的情形怎麼樣? 相同 改善 更常氣喘 (6)小時候有氣喘症狀嗎? 有 沒有
(7)有哪一原料較容易引起氣喘症狀嗎? 有,什麼原料?_______
沒有
11. 過去 12 個月,工作時以下症狀出現頻率、下班後情形? (請勾選)
沒有 很少
偶爾 (1 次/
月)
常常 (每周 多次)
總是 (幾乎 每天)
放假、下班後 左方症狀 會改善嗎?
(無症狀免答)
眼睛症狀(1)
眼睛乾、癢、流眼淚會改善
差不多
情況更糟
(2)
眼睛刺激、痠痛(3)
眼睛持續有異物感(4)
眼睛發紅、有血絲呼吸道症狀
(5)
鼻子喉嚨乾癢會改善
差不多
情況更糟
(6)
鼻子喉嚨刺激、刺痛(7)
流鼻水、鼻塞(8)
打噴嚏、咳嗽(9)
有痰、有異物感(10)
胸悶、喘不過氣(1)沒有感冒時有發生過這種情況嗎? 有 沒有
(2)放假時,喘鳴的情形怎麼樣? 相同 改善 更常喘鳴 (3)哪一年、哪一個月開始有喘鳴(咻咻)聲響的? ____年____月
進行下列工作時會有眼睛、呼吸道不舒服的感覺嗎?
□會,請勾選
秤、篩麵粉、蛋糕粉 攪拌雞蛋、麵粉、打蛋糕
使用香草粉、香精 揉、整形麵糰 發酵 控制烤箱溫度
麵包出爐、冷卻 清洗動作 炸豬油、烹煮
包裝、運送、結帳 其他:______
□均不會
12. 過去 12 個月,工作時以下症狀出現頻率、下班後情形? (請勾選)
沒有 很少
偶爾 (1 次/
月)
常常 (每周多
次)
總是 (幾乎每
天)
放假、下班後 左方症狀 會改善嗎?
(無症狀免答)
皮膚症狀(1)
燒、燙傷會改善
差不多
情況更糟
(2)
脫皮、紅腫(3)
皮膚癢、乾燥、疼痛(4)
不明疹子、溼疹(5)
手掌、手指頭皮膚裂開肌肉骨骼症狀
(6)
手腕、手臂肌肉痠痛會改善
差不多
情況更糟
(7)
脖子、肩膀僵硬痠痛(8)
背部肌肉痠痛(9)
腿部肌肉痠痛其他症狀
(10)
滑倒、跌倒會改善
差不多
情況更糟
(11)
頭暈、頭痛、嗜睡(12)
疲倦無力、動作不協調(13)
沮喪、焦慮(14)
噁心想吐 接觸下列什麼原料時會有皮膚不舒服的感覺?
□會,請勾選
麵粉、麥粉、麵糰 打發蛋白 香草粉、香精 酵母
優格、起司、奶油抹醬 烤盤油、植物油、豬油 清潔劑 醃漬類水果、果醬 酒類 冷凍麵團 其他:__________□均不會
進行哪一項工作時會較明顯有肌肉痠痛的感覺?
□會,請勾選
搬運、秤、篩麵粉 攪拌雞蛋、麵粉、打蛋糕 搬運、送貨 揉製、整形麵糰 麵包烘烤前、後搬動烤盤 使用麵包夾 進烤箱前蛋糕製模 清理物品、地面、桌面
其他:________□均不會
四、工作環境描述
沒有 很少 偶爾 常常 總是
(1)
烘烤時,廚房太熱以致大量流汗(2)
廚房通風狀況「較差」的頻率如何?(3)
廚房空氣品質「較差」的頻率如何?(4)
您戴口罩頻率如何?烘烤過程,空氣中有以下哪些物質較多、味道較濃嗎?
(4)
麵粉、麥粉、蛋糕預拌粉(5)
油煙(6)
乳酪、起司、酥皮味(7)
布丁、克林姆、奶油味、奶粉(8)
雞蛋牛奶、蛋白霜(10)
香草、焦糖、黑糖、咖啡等調味料(11)
芋頭、紅豆、青蔥等其他餡料Appendix 2. RStudio code and output for Pearson's Chi-squared test
References
[1] 吳幸娟,潘文涵,葉乃華,張新儀,洪淑怡:台灣成人與老人營養素及食物攝取來源之變
遷趨勢:由 NASHIT 1993~1996 到 2005~2008。2011。
[2] 財政部北區國稅局:烘焙食品業原物料耗用通常水準。
http://service.ntbna.gov.tw/etwmain/front/ETW118W/CON/1409/7769246663127972826?tadcod e 。Cited: 2015/7。
[3] J. Brisman. Baker’s Asthma. Occupational and Environmental Medicine 2002; 59(7): 498–502.
[4] X. Baur. Baker's asthma: causes and prevention. International Archives of Occupational and Environmental Health 1999; 72(5): 292-6.
[5] E. H. Page, Chad H. Dowell, Charles A. Mueller, Raymond E. Biagini, Dick Heederik. Exposure to Flour Dust and Sensitization Among Bakery Employees. American Journal of Industrial Medicine 2010; 53(12):1225–32
[6] U.S. Department of Labor. Occupational Exposure to Flavoring Substances: Health Effects and Hazard. Safety and Health Information Bulletin SHIB 10-14-2010.
https://www.osha.gov/dts/shib/shib10142010.html. Cited: 2015/7
[7] 台灣連鎖加盟協會:台灣連鎖店年鑑;民國 95、99、103 年統計。
[8] 行政院主計總處:工商及服務業企業單位經營概況。
http://www.dgbas.gov.tw/ct_view.asp?xItem=35303&ctNode=3267。Cited: 2015/7。
[9] 勞動部勞動力發展署技能檢定中心:烘焙食品技能檢定合格數。
http://www.labor.gov.tw/index.jsp。Cited:2015/7。
[10] 台灣省糕餅商業同業公會聯合會。
http://www.bakery-taiwan.com.tw/?p=mdoc&SETid=3587&Msoft=735。Cited: 2015/7。
[11] T. Skjold, R. Dahl, B. Juhl, T. Sigsgaard. The incidence of respiratory symptoms and sensitisation in baker apprentices. European Respiratory Journal 2008; 32(2): 452–459
[12] X. Baur, Paul O. Degens, and Ingrid Sander. Baker’s asthma: Still among the most frequent occupational respiratory disorders.Journal of Allergy and Clinical Immunology 1998; 102(6):1 [13] G. Salcedo, S Quirce, A Diaz-Perales. Wheat Allergens Associated With Baker’s Asthma. J
Investig Allergol Clin Immunol 2011; 21(2): 81-92
[14] M. C. Yeung, J-L. Malo. Aetiological agents in occupational asthma. European Respiratory Journal 1994; 7(2): 346-371.
[15] P. Bulat, K. Myny, L. Braeckman, et al. Exposure to inhalable dust, wheat flour and a-amylase allergens in industrial and traditional bakeries. The Annals of Occupational Hygiene 2004; 48(1):
57-63.
[16] R Baatjies, T Meijster, AL Lopata et al. A pilot study of exposure to flour dust and allergens in cape town bakeries. Current Allergy & Clinical Immunology 2007; 20(4): 210-214
to flour dust, spices, and other ingredients among poultry breading workers. NIOSH 2013; Report No. 2009-0131.
[18] A Burdorf, L Lillienberg, J Brisman. Characterization of exposure to inhalable flour dust in Swedish bakeries. The Annals of Occupational Hygiene 1994; 38(1): 67–78
[19] J. Elms, E. Robinson, S. Rahman and A. Garrod. Exposure to flour dust in UK bakeries: Current use of control measures. The Annals of Occupational Hygiene 2005; 49(1): 85-91.
[20] R Houba, D Heederik, K Kromhout. Grouping stategies for exposure to inhalable dust, wheat allergens and a-amylase allergens in bakeries. The Annals of Occupational Hygiene 1997; 41(3):
287-296.
[21] A Brant, J Berriman, Sharp C, J Welch, C Zekveld, M Nieuwenhuijsen, J Elms, et al. The changing distribution of occupational asthma: a survey of supermarket bakery workers. European
Respiratory Journal 2005; 25(2): 303-308.
[22] 行政院勞工委員會:粉塵危害預防標準。
http://www.laws.taipei.gov.tw/lawsystem/wfLaw_Information.aspx?LawID=A040290070002400 -20031231。Cited:2015/7。
[23] In Hee Cho and D.G. Peterson. Chemistry of Bread Aroma: A Review. Food Science and Biotechnology 2010; 19(3): 575-582.
[24] C. Petisca, A.R.Henriques, T. Pe´rez-Palacios, O. Pinho, I.M.P.L.V.O. Ferreira. Assessment of hydroxymethylfurfural and furfural commercial bakery products. Journal of Food Composition and Analysis 2014; 33(1):20–25.
[25] 艾佳家庭烘焙網。http://www.pcstore.com.tw/homebakery/。Cited:2015/7。
[26] 橋農食品企業有限公司。 http://www.baking7-11.com/about.asp。Cited:2015/7。
[27] M. I. Rincon-Delgadillo , A. Lopez-Hernandez , I. Wijaya , and S. A. Rankin. Diacetyl levels and volatile profiles of commercial starter distillates and selected dairy foods. American Dairy Science Association 2012; 95(3):1128–1139
[28] K. R. Schrankel. Safety evaluation of food flavorings. Journal of Toxicology 2004; 198(1-3): 203–
211.
[29] T. B. Adams, J. Doull, J. I. Goodman, I. C. Munro, P. Newberne, P. S. Portoghese, R. L. Smith, B.M.
Wagner, C. S. Weil, L. A. Woods, and R. A. Ford. The FEMA GRAS Assessment of Furfural Used as a Flavour Ingredient. Food and Chemical Toxicology 1997; 35(8): 739-751.
[30] Flavor and Extract Manufacturers Association GRAS™ program.
https://www.femaflavor.org/gras. Cited:2015/7
[31] K. Kreiss, A. Gomaa, G. Kullman et al. Clinical bronchiolitis obliterans in employees at a microwave-popcorn plant. New Engl. J. Med. 347(5): 330-338, 2002.
[32] Flavor and Extract Manufacturers Association. Respiratory Health and Safety in the Flavor Manufacturing Workplace 2012.
[33] R. Kanwal and G. Kullman. Report on severe fixed obstructive lung disease in workers at a flavoring manufacturing plant. NIOSH 2007; HETA 2006-0303-3043
[34] M. Huey, K. Morton, and K. R. Lee. Diacetyl Exposure at a Food Flavoring Production Facility.
Journal of Occupational and Environmental Hygiene 2012; 9(4): D59–D62.
[35] G. Day, R. LeBouf, A. Grote, S. Pendergrass, K. Cummings, K. Kreiss, and G. Kullman.
Identification and Measurement of Diacetyl Substitutes in Dry Bakery Mix Production 2011; 8(2):
93–103.
[36] J. H.E. Arts, Hans Muijser, Marko J. Appel, C. Frieke Kuper, Jos G.M. Bessems, and Ruud A.
Woutersen. Subacute (28-day) toxicity of furfural in Fischer 344 rats: a comparison of the oral and inhalation route. Food and Chemical Toxicology 2004; 42(9): 1389–1399.
[37] J.S. Fedan, J.A. Dowdy, K.B. Fedan, A.F. Hubbs. Popcorn worker's lung: In vitro exposure to diacetyl, an ingredient in microwave popcorn butter flavoring, increases reactivity to methacholine.
Toxicology and Applied Pharmacology 2006; 215(1): 17-22.
[38] R.A. Woutersen, and V. J. Feron. Inhalation toxicity of acetaldehyde in rats. IV. Progression and regression of nasal lesions after discontinuous of exposure. Toxicology 1987; 47(3): 295-305.
[39] Ann F. Hubbs, Amy M. Cumpston, W. Travis Goldsmith et al. Respiratory and Olfactory Cytotoxicity of Inhaled 2,3-Pentanedione in Sprague-Dawley Rats. The American Journal of Pathology 2012; 181(3): 829-44
[40] 衛生福利部食品藥物管理署:食品添加物使用範圍及限量暨規格標準。
https://consumer.fda.gov.tw/Law/FoodAdditivesList.aspx?nodeID=521。Cited:2015/7.
[41] 食品添加物使用範圍及限量暨規格標準。附 TABLE 一食品添加物之品名、使用範圍及限量。
Cited:2015/7。
[42] 周承緯:A study on occupational characteristics of bakery chefs (學位論文)。 台灣:國立中央 大學;民國 100 年。
[43] 黃鈺涵:中小型烘焙業經營策略與績效之研究(學位論文)。銘傳大學;民國 98 年。
[44] National Library of Medicine. Hazardous Substances Data Bank (HSDB). [online]
https://toxnet.nlm.nih.gov/cgi-bin/sis/htmlgen?HSDB, cited:2016/7
[45] A. Cartier, C. Lemière, J. Malo. Occupational Asthma (OA) to Lactoserum in a Baker. Journal of Allergy and Clinical Immunology 2005; 115(2):S29
[46] G.Y Hur, D. H. Koh, H. A. Kim, H. J. Park et al. Prevalence of work-related symptomsand serum-specific antibodies to wheat flour in exposed workers in the bakery industry. Respiratory Medicine 2007; 102(4):548-555
[47] A. Palacin, S. Quirce, A. Armentia, M.Ferna´ndez-Nieto et al. Wheat lipid transfer protein is a major allergen associated with baker’s asthma. Environmental and occupational respiratory disorders 2007; 120(5):1132-8
[48] ACGIH® © 2012. 2012 TLVs® and BELs® Rhreshold Limit Values for Chemical Substances and Physical Agents & Biological Exposure Indices with 7th Edition Documentation
[49] National Institute for Occupational Safety and Health. NIOSH pocket guide to chemical hazards;
2010.
[50] Occupational Safety and Health Administration. Sampling and analytical methods 104; 1994.
[51] SKC, Inc. Operating Instructions for IOM Personal Samplers and IOM Samplers with MultiDust.
[52] Gregory A. Day, Kristin J. Cummings, Greg J. Kullman. Report on an Investigation of Buttermilk Flavoring Exposures and Respiratory Health at a Bakery Mix Production Facility. NIOSH 2009;
HETA 2008-0230-3096.
[53] US Environmental Protection Agency. Definition and procedure for the determination of the method detection limit. http://www.epa.gov/region9/qa/pdfs/ 40cfr136_03.pdf. Cited: 2016/07 [54] BG. Ferris. Epidemiology standardization project. Am Rev Respir Dis 1978; 118(6 Pt 2):1-120.
[55] N.Sharon, P. Z. Bar-Yoseph, E. Bormusov, A. Dovrat. Simulation of heat exposure and damage to the eye lens in a neighborhood bakery. Experimental Eye Research 2008; 87(1):49-55
[56] P. Lovreglio, A. Carrus, S. Iavicoli, I. Drago et al. Indoor formaldehyde and acetaldehyde levels in the province of Bari, South Italy, and estimated health risk. The Royal Society of Chemistry 2009;
11(5): 955-961
[57] S. Uchiyama, T. Tomizaw, A. Tokoro, M. Aoki et al. Gaseous chemical compounds in indoor and outdoor air of 602 houses throughout Japan in winter and summer. Environmental Research 2015;
137:364-372
[58] J.H. Cheng, Y.S.Lee, K.S. Chen. Carbonyl compounds in dining areas, kitchens and exhaust streams in restaurants with varying cooking methods in Kaohsiung, Taiwan. Journal of Environmental Sciences 2016; 41:218-26