CONTROL OF REACTIVE DISTILLATION COLUMNS FOR AMYL
ACETATE PRODUCTION USING DILUTE ACETIC ACID
Wan-Jen Hung, I-Kuan Lai, Shih-Bo Hung, Hsiao-Ping Huang, Ming-Jer Lee, and Cheng-Ching Yu*
ABSTRACT
This work explores the feasibility of recovery of acetic acid from aqueous solu-tions with different acid concentrasolu-tions. Instead of separating acid from water using azeotropic distillation, acetic acid is converted to acetate via esterification. A range of acetic acid concentrations is explored, varying from 100 wt%, to 75 wt%, to 50 wt%, and then to 30 wt%. The TAC analysis shows that a standalone reactive distillation is more economical than a flowsheet with a pre-treatment unit. Process characteristics have been explored and the results show significant nonlinearity associated with reac-tive distillation columns for all four different acid concentrations. A systematic design procedure is devised to control reactive distillation columns by temperature control. Reasonable control performance can be achieved. A further improvement can be made by incorporating feedforward control for feed flow disturbance. Finally, one-tempera-ture-one composition control structure is also examined. Acceptable control perfor-mance can be obtained while maintaining acetate composition.
Key Words: reactive distillation, esterification, acetic acid recovery, process control,
temperature control, nonlinearity measure.
*Corresponding author. (Tel: 3365-1759; Fax: 886-2-3366-3037; Email: [email protected])
W. J. Hung, I. K. Lai, H. P. Huang, and C. C. Yu are with the Department of Chemical Engineering, National Taiwan University Taipei 106, Taiwan.
S. B. Hung and M. J. Lee are with the Department of Chemical Engineering, National Taiwan University of Science and Technology Taipei 106, Taiwan.
I. INTRODUCTION
Dilute acetic acid solutions are often produced in many chemical processes, manufacturing of tereph-thalic acid, dimethyl terephthalate, cellulose ester, and acetate rayon (Xu et al., 1999a, 1999b; Saha et al., 2000; Chien et al., 2004; Hung et al., 2005b). Typically, the acetic acid concentration ranges from 70 wt% to 35 wt% and possibly down to 2-6 wt% for wood distillation. Generally, two approaches can be taken to treat the dilute acid. One approach is the acetic acid dehydration using simple distillation or heterogeneous azeotropic distillation as discussed in detail by Chien et al. (2004). A different route is to convert dilute acetic acid into useful chemicals such
as acetates, which has been explored by several re-searchers (Xu et al., 1999a, 1999b; Saha et al., 2000; Hung et al., 2005b). Generally, reactive distillation is used for converting dilute acid into acetate and the conversion of the acid ranges from 60-80% as shown in the studies of Saha et al. (2000) and Xu et al. (1999a; 1999b). Hung et al. (2005b) explore the pro-cess chemistries based on the total annual cost (TAC) and they conclude that amyl alcohol is an ideal sol-vent for converting the dilute acid to amyl acetate and this offers great economic potential as compared to the cost of acetic acid. Amyl acetate has been used in industries as a solvent, an extractant, a polishing agent etc. Design and control of amyl acetate using pure acetic acid has been studied by Chiang et al. (2002) and Huang and Yu (2003). The above men-tioned amyl acetate reactive distillation columns have been designed for “neat” operation. That is an exact stoichiometric amount of alcohol and acid is pro-cessed in one column such that high purity product can be obtained with an almost 100% conversion, as opposed to excess reactant design. This imposes strin-gent requirements on the control system design.
Despite the great economic potential of a steady-state perspective, the operability of four reactive dis-tillation columns with 100wt%, 75 wt%, 50wt%, and 30wt% is explored. First, process characteristics, such a s n o n l i n e a r i t y m e a s u r e a n d p o s s i b l e o u t p u t multiplicities, are studied. Next, a systematic design procedure is devised for dual-temperature control and potential advantage of feedforward control is also shown. In order to maintain acetate product specification, com-position control is also explored. The results indicate that acceptable control performance can be obtained for all different purity levels of acetic acid.
II. PROCESS ANALYSIS 1. Optimal Steady-State Design
Hung et al. (2005b) examines the process chem-istry for dilute acetic acid recovery using alcohols
ranging from methanol to n-pentanol (C1 to C5). The
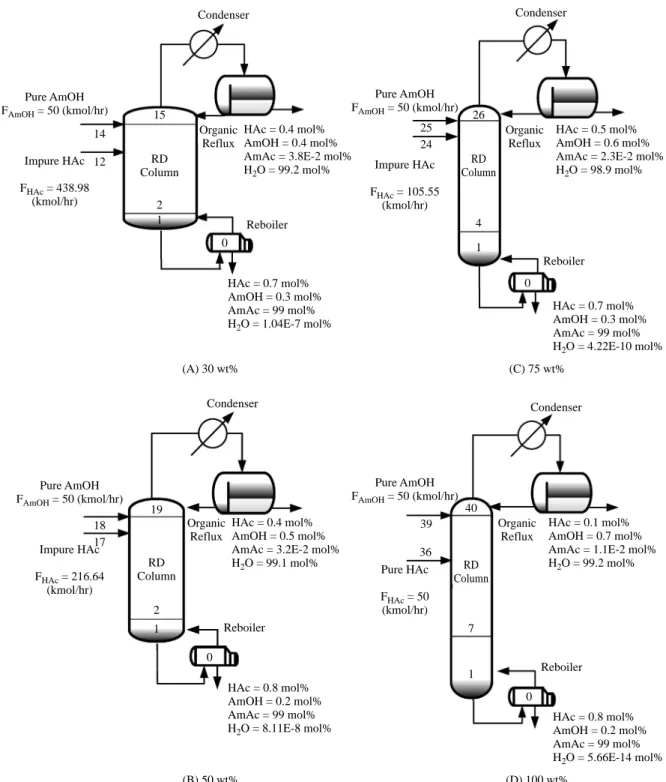
results indicate that amyl alcohol is the best solvent for recovery of dilute acetic acid using a single reac-tive distillation column (without pretreatment) based on steady-state economics. Following the steady-state design procedure of Tang et al. (2005), the optimum results are shown in Fig. 1. Table 1 summarizes the optimal steady-state design for four different acid purity levels: 30 wt%, 50 wt%, 75 wt%, and 100 wt%. Product specification for the acetates is set to 99 mol% with a production rate of 50 kmol/hr.
It is interesting to note that the column diam-eter increases as HAc becomes more and more dilute. The reason for that is the column diameter is set by the vapor rate. That implies that as HAc concentra-tion decreases, a reactive distillaconcentra-tion with larger re-actors with fewer equilibrium stages is preferred from a steady-state economic perspective for the amyl ac-etate system. But the Damköhler number (Da) actu-ally drops from 9.8 to 2, because of a larger vapor/ liquid traffic.
2. Nonlinearity and Output Multiplicity
The manipulated variables are determined to evaluate process nonlinearity for the amyl acetate process. The tray temperatures are treated as state variables. The manipulated variables are the heat
input QR and feed ratio FR, respectively. First, the
upper and lower bounds of the steady-state gains be-tween the tray temperatures and the manipulated
vari-ables (QR and FR) are obtained for a range of input
variations. In this work, –5% to +5% changes in the
heat input (QR) and –1% to +1% changes in the feed
ratio are made. Note that, for a truly linear system, the upper and lower bounds should coincide with each other. Fig. 2 clearly shows that dilute acetic acid
concentrations of 75 wt% and 50 wt% are more non-linear than the other two cases of 100 wt% and 30 wt%. Moreover, the “sign reversal” is also observed
for the four cases under either QR or FR change. The
results presented here are rather unconventional, be-cause chemical processes are known to be quite nonlinear, but not to this degree in such a consistent manner. Two measures are used to differentiate the degree of nonlinearity. One obvious choice is the fraction of sign reversal for all tray temperatures. In this regard, the case of 75 wt% HAc composition in-dicates that more than half of the trays show sign re-versal in which almost half of the tray temperatures exhibit the “sign reversal”. Table 2 summarizes the fraction of sign changes for all four cases. The
sec-ond nonlinearity indicator is φN
which was first pro-posed by Allgower for dynamic systems and further studied by Hernjak and Doyle (2003) under feedback. Schweickhardt and Allgower (2004; 2005) give an updated summary on nonlinearity measures. The
measure ranges from 0 to 1, φN
= 0 implies a linear
process and φN
= 1 means a highly nonlinear system. Following Hung et al. (2005a), we only consider steady-state (e.g., can be viewed as the nonlinearity measure for a static function) and the upper bound of the nonlinear measure can be computed from:
φN= G – G+ 2
G+ 2 =
G – G– 2
G– 2
The vector G corresponds to tray temperatures
throughout the column, G+ is the upper bound of the
static nonlinear function and G– is the lower bound.
Because we treat two manipulated inputs separately,
two φN
’s are available for a given system. In this
work, the 2-norm is used to compute φN
and each ma-nipulated variable is considered separately. The de-tailed definition and derivation are given in Hung et
al. (2005a).
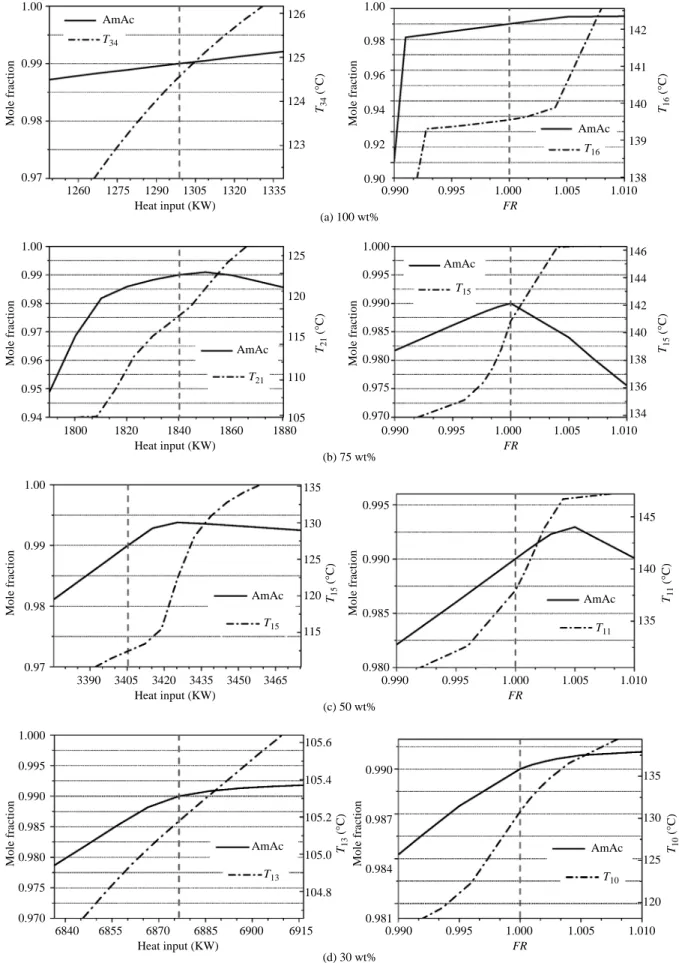
In addition to the trays’ temperatures, we are also interested in the behavior of product composi-tion for a range of input changes. Fig. 3 shows how temperatures and compositions change with the ma-nipulated inputs and the dashed line in Fig. 3 indi-cates the nominal steady-state. The compositions for the cases of 75 wt% and 50 wt% HAc feed exhibit input multiplicity for the feed ratio variation. If a
temperature, i.e., T15 or T10, is used instead, the
in-put multiplicity cannot be eliminated completely. The multiplicity analysis indicates that the composition control of the aqueous acetic acid of 75 wt% and 50 wt% can be difficult.
The analysis presented here clearly indicates that the reactive distillation systems exhibit severe open-loop nonlinearity which includes significant portions
of sign reversal, extremely large values of Allgower’s
nonlinearity measure, φN
, and input multiplicity. Under this circumstance, control structure design be-comes important.
III. DUAL - TEMPERATURE CONTROL 1. Control Structure Design
In this section, a systematic approach (Hung, 2005a) is used for the control structure design. In order to maintain the stoichiometric balance, two tem-peratures are controlled. One is used to maintain the acetate composition and the other is to prevent accu-mulation of unreacted reactants. Note the overhead water composition is determined by the phase-split of the liquid-liquid equilibrium while making the
or-Fig. 1 Optimized process flowsheets for aqueous acetic acid recovery via single reactive distillation column using amyl alcohol HAc = 0.7 mol% AmOH = 0.3 mol% AmAc = 99 mol% H2O = 1.04E-7 mol% HAc = 0.4 mol% AmOH = 0.4 mol% AmAc = 3.8E-2 mol% H2O = 99.2 mol% Condenser Reboiler Pure AmOH FAmOH = 50 (kmol/hr) Impure HAc FHAc = 438.98 (kmol/hr) 15 2 0 RD Column 1 14 12 Organic Reflux (A) 30 wt% HAc = 0.7 mol% AmOH = 0.3 mol% AmAc = 99 mol% H2O = 4.22E-10 mol% HAc = 0.5 mol% AmOH = 0.6 mol% AmAc = 2.3E-2 mol% H2O = 98.9 mol% Condenser Pure AmOH FAmOH = 50 (kmol/hr) Impure HAc FHAc = 105.55 (kmol/hr) 26 4 RD Column 1 0 25 24 Organic Reflux (C) 75 wt% Reboiler HAc = 0.8 mol% AmOH = 0.2 mol% AmAc = 99 mol% H2O = 8.11E-8 mol% HAc = 0.4 mol% AmOH = 0.5 mol% AmAc = 3.2E-2 mol% H2O = 99.1 mol% Condenser Reboiler Pure AmOH FAmOH = 50 (kmol/hr) Impure HAc FHAc = 216.64 (kmol/hr) 19 2 0 RD Column 1 18 17 Organic Reflux (B) 50 wt% HAc = 0.8 mol% AmOH = 0.2 mol% AmAc = 99 mol% H2O = 5.66E-14 mol% HAc = 0.1 mol% AmOH = 0.7 mol% AmAc = 1.1E-2 mol% H2O = 99.2 mol% Condenser Pure AmOH FAmOH = 50 (kmol/hr) Pure HAc FHAc = 50 (kmol/hr) 40 7 RD Column 1 0 39 36 Organic Reflux (D) 100 wt% Reboiler
ganic phase totally refluxed. So it is not necessary to control a temperature or composition in the top section of the column. Two candidate manipulated variables are the feed ratio (FR) and heat input to the reboiler (Q). Because of significant uncertainty, e.g., input multiplicities and potential sign reversals, associated with the process, we would like to mini-mize the model information required for control
sys-tem design. The decentralized control is preferred because we are not even certain about the sign of the gains for a given manipulated input, if the controlled variables are chosen appropriately. Then the non-square relative gain (NRG; Chang and Yu, 1990) is used to select temperature control trays. Next, the relative gain array (RGA; Bristol, 1966) is used for variable pairings. Finally, the relay feedback test (Shen
Table 1 Optimal steady-state operating conditions and total annual cost (TAC) for recovery acetic acid with reactive distillation
100wt% 75wt% 50wt% 30wt%
Case No of HAc fraction in the feed
(100 mol%) (47.4 mol%) (23.1 mol%) (11.4 mol%)
Total No. of trays including the reboiler 41 27 20 16
No. of trays in stripping section (NS) 6 3 1 1
No. of trays in reactive section (Nrxn) 33 22 17 13
No. of trays in rectifying section (NR) 1 1 1 1
Reactive trays 7~39 4~25 2~18 2~14
Acetic acid feed tray 36 24 17 12
Pentanol feed tray 39 25 18 14
Feed flow rate of acid (kmol/hr) 50 50 50 50
Feed flow rate of pentanol (kmol/hr) 50 50 50 50
Top product flow rate (kmol/hr) 49.96 105.91 217.43 440.63
Bottom product flow rate (kmol/hr) 50.03 49.64 49.21 48.35
Reflux flow rate (kmol/hr) 52.23 48.16 71.79 139.26
Bottom vapor flow rate (kmol/hr) 122.62 175.01 323.13 651.62
XD, aq acid 0.0010 0.00459 0.00385 0.00372 alcohol 0.00711 0.00645 0.00506 0.00411 acetate 0.00011 0.00023 0.00032 0.00038 water 0.99178 0.98873 0.99076 0.99179 XB acid 0.00805 0.00697 0.00765 0.00676 alcohol 0.00195 0.00302 0.00232 0.00323 acetate 0.99000 0.99000 0.99000 0.99000
water 5.66e-16 4.22e-12 8.11e-10 1.04e-09
Condenser duty (kW) -1283.00 -1845.36 -3396.69 -6789.01
Subcooling duty (kW) -186.67 -226.86 -416.42 -830.79
Reboiler duty (kW) 1295.15 1840.41 3405.30 6876.45
Column diameter (m) 1.225 1.454 2.018 2.957
Condenser heat transfer area (m2
) 23.85 35.70 71.21 144.22
Subcooling heat transfer area (m2
) 21.86 26.74 52.42 105.88
Reboiler heat transfer area (m2
) 36.49 51.86 95.95 193.76
Damköhler number (Da) 9.58 3.64 2.88 1.98
Total capital cost ($1000) 790.24 794.00 1048.71 1518.65
Column 404.26 343.39 378.66 470.85
Column trays 69.44 58.83 71.45 102.01
Heat exchangers 316.54 391.79 598.61 945.79
Total operating cost ($1000/year) 167.51 227.93 414.61 826.01
Catalyst cost 20.81 19.53 29.06 47.74
Energy cost 146.70 208.41 385.54 778.27
0.4 0.2 0.0 -0.2 -0.4 -0.6 -0.8 -1.0 AmAc upper lower linear 0 2 4 6 8 10 12 14 16 18 20 22 24 26 28 30 32 34 36 38 40 stages dT /dQ R 8 6 4 2 0 AmAc upper lower linear 0 2 4 6 8 10 12 14 16 18 20 22 24 26 28 30 32 34 36 38 40 stages dT /dFR (a) 100 wt% 6 5 4 3 2 1 0 -1 AmAc upper lower linear 0 2 4 6 8 10 12 14 16 18 20 22 24 26 stages dT /dQ R 13 12 11 10 9 8 7 6 5 4 3 2 1 0 -1 AmAc upper lower linear 0 2 4 6 8 10 12 14 16 18 20 22 24 26 stages dT /dFR (b) 75 wt% 11 10 9 8 7 6 5 4 3 2 1 0 AmAc upper lower linear 0 2 4 6 8 10 12 14 16 18 stages dT /dQ R 15 10 5 0 AmAc upper lower linear 0 2 4 6 8 10 12 14 16 18 stages dT /dFR (c) 50 wt% 25 20 15 10 5 0 AmAc upper lower linear 0 2 4 6 8 10 12 14 stages dT /dQ R 45 40 35 30 25 20 15 10 5 0 -5 AmAc upper lower linear 0 2 4 6 8 10 12 14 stages dT /dFR (d) 30 wt%
Fig. 2 Upper and lower bounds of steady-state gains of all tray temperatures for ±5% reboiler duty and ±1% feed ratio changes and the sign reversal indicated as shaded areas
and Yu, 1994; Yu, 1999) is used to find the ultimate
gain (Ku) and the ultimate period (Pu) followed by
the Tyreus-Luyben PI tuning rule. The tuning is carried out in a sequential manner on the process such that process interaction is taken into account in the identification-tuning steps. Table 2 summarizes the settings for all four cases. It can be seen that the heat input is paired with an upper section tray tempera-ture and a lower section tray temperatempera-ture is controlled
by the feed ratio (e.g., T34 – QR & T16 – FR for the
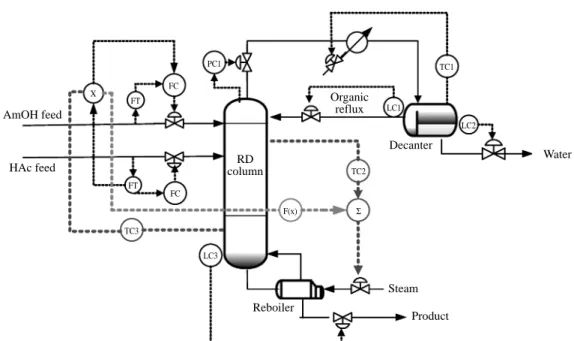
case of 100 wt% HAc feed). Also note that a large reset time is associated with the feed ratio (FR) loop and the reset time for the heat input loop is relatively small (Hung et al., 2005a; Cheng and Yu, 2005). This implies slow integration is employed to prevent pos-sible stoichiometric imbalance. So, we have a fast heat input loop to take care of the disturbance, initially, followed by a gradual effort to prevent accumulation of unused reactants. Fig. 4 shows a typical control structure for the dual-temperature control.
2. Results and Extensions
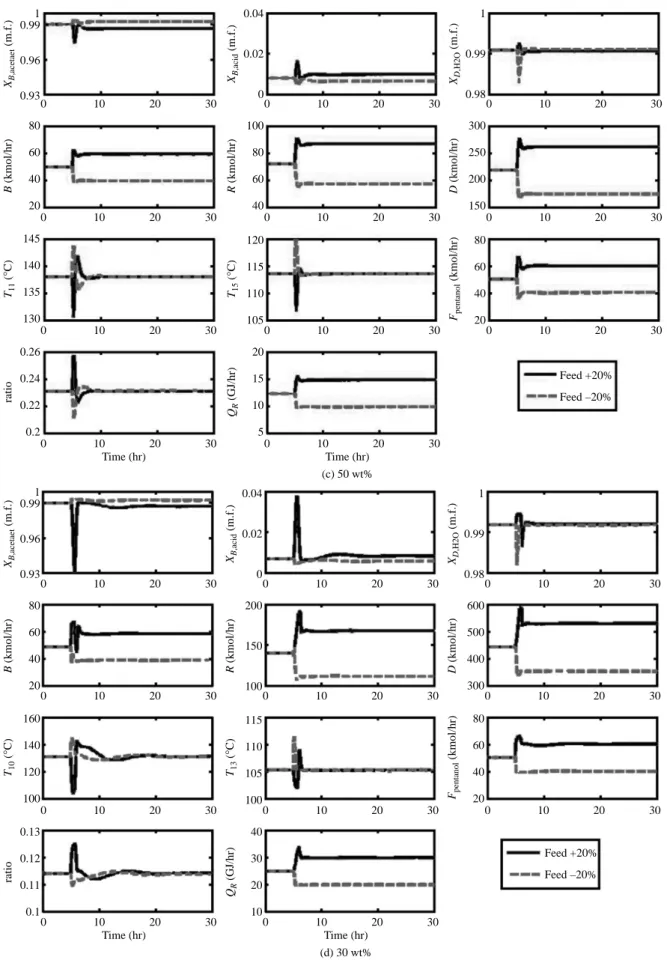
Feed flow disturbance is used to evaluate the control performance of the temperature control for the amyl acetate system. Fig. 5 shows the dynamic
responses for ± 20% production rate changes.
De-spite strong nonlinearity, at least in an open-loop sense, reasonable control can be achieved. It can be seen that significant transient product composition devia-tions (maximum deviation of 0.04 in mole fraction for 100 wt% and 0.06 m.f. for 30 wt%) are observed for the cases of 100 wt% and 30 wt% HAc feed, es-pecially for 20% feed flow rate increase. Large swings in the temperature controlled trays are also evident w i t h a s y m m e t r i c a l r e s p o n s e s . T h e p r o d u c t s
composition, XB,acetate, reaches steady-state in 15 hours.
The results actually can be foreseen in the nonlinear analysis. For cases of 75 wt% and 50 wt% HAc feed,
fast dynamics are attainable with a much smaller tran-sient deviation (maximum deviation of less than 0.02 m.f.) as shown in Fig. 5. Furthermore, the process settles in 5 hours. Fig. 5 also shows asymmetrical
responses in the product compositions (XB,acetate and
XD, H2O).
Because of large transient deviation for the cases of 100 wt% and 30 wt% HAc feed, the feedforward control is incorporated for, possibly, improved con-trol performance. In the feedforward configuration, Fig. 6, the feed flow rate is fed forward to the heat input via a ratio control. Thus, the heat input can be adjusted in advance to prevent large deviations in the temperature as well as composition. Again, feed flow disturbance is also used for comparing the perfor-mance of these two control configurations (with and without feedforward control). Fig. 7 compares the dynamic responses for these two control structures for the cases of 100 wt% and 30 wt% HAc feed. The results show that the peak errors are reduced by fac-tors of 3 and 10, respectively, as shown in Fig. 7. That implies that feedforward control is very effec-tive for these highly nonlinear reaceffec-tive distillation systems. Before leaving the section, it should be e m p h a s i z e d t h a t , d e s p i t e r e a s o n a b l e c o n t r o l performance, steady-state offsets in the acetate com-position can be observed in the dual temperature control. The steady-state offsets range from 0.013 m.f. for 75 wt% HAc feed to 0.0075 m.f. for 50 wt% HAc feed. In order to maintain product quality, com-position control is explored next.
IV. COMPOSITION CONTROL
Because of the steady-state offsets in the dual-temperature control, one may seek offset-free com-position control for amyl acetate production using dilute acetic acid. Here, we choose to control the acetate product quality via composition control while
Table 2. Fractions of sign reversal and nonlinearity measures for AmAc esterification with different feed compositions of acetic acid
HAc Nonlinearity measure
Fraction of sign Overall
System composition (Schweickhardt and
reversal Assessment***
in the feed Allgower)
AmAc QR FR Overall* QR FR Overall**
100 wt% 0.10 0.07 0.17 0.84 0.66 0.76 M
75 wt% 0.41 0.67 0.67 0.90 0.75 0.83 H
50 wt% 0.21 0.37 0.42 0.91 0.69 0.81 H
30 wt% 0 0 0 0.69 0.84 0.77 M
*delete overlapping (from each input) trays **taking as 2-norm of two inputs divided by two
***High (if the averaged value exceeds 0.5), Medium (if the averaged value exceeds 0.3), and Low (if the averaged value less than 0.3).
1.00 0.99 0.98 0.97 126 125 124 123 AmAc T34 1260 1275 1290 1305 1320 1335 Heat input (KW) FR Mole fraction T34 ( ° C) 1.00 0.98 0.96 0.94 0.92 0.90 142 141 140 139 138 AmAc T16 0.990 0.995 1.000 1.005 1.010 Mole fraction T16 ( ° C) (a) 100 wt% 1.00 0.99 0.98 0.97 0.96 0.95 0.94 125 120 115 110 105 AmAc T21 1800 1820 1840 1860 1880 Heat input (KW) FR Mole fraction T21 ( ° C) 1.000 0.995 0.990 0.985 0.980 0.975 0.970 146 144 142 140 138 136 134 0.990 0.995 1.000 1.005 1.010 Mole fraction T15 ( ° C) (b) 75 wt% AmAc T15 1.00 0.99 0.98 0.97 135 130 125 120 115 AmAc T15 3390 3405 3420 3435 3450 3465 Heat input (KW) FR Mole fraction T15 ( ° C) 0.995 0.990 0.985 0.980 145 140 135 0.990 0.995 1.000 1.005 1.010 Mole fraction T11 ( ° C) (c) 50 wt% AmAc T11 1.000 0.995 0.990 0.985 0.980 0.975 0.970 105.6 105.4 105.2 105.0 104.8 AmAc T13 6840 6855 6870 6885 6900 6915 Heat input (KW) FR Mole fraction T13 ( ° C) 0.990 0.987 0.984 0.981 135 130 125 120 0.990 0.995 1.000 1.005 1.010 Mole fraction T10 ( ° C) (d) 30 wt% AmAc T10
Fig. 3 Trends of product compositions and temperature responses for a range of changes in the manipulated variables (heat input and feed ratio) and nominal design indicated by the dashed line
keeping the stoichiometric balance using temperature as an indicator.
In the previous section, two temperature con-trol trays are selected from the NRG analysis. Be-cause the bottom product composition is one of the controlled variables, the other controlled variable is the temperature further away from the acetate with-drawal point. Therefore, a composition analyzer is substituted for the temperature in the lower section of the column. This becomes a temperature- one-composition control scheme as shown in Fig. 8. Once the manipulated variables and controlled variables are determined, the RGA is used to provide appropriate pairing for the decentralized control. Note that 4 minutes of analyzer dead time is assumed for the com-position loop. Next, the sequential relay feedback tests and autotuning are performed to find the PI con-troller settings. Table 4 gives the steady-state gain matrices, RGA, and PI setting all four cases. There are two manipulated variables, heat input and feed ratio, for one temperature and one composition control. The results reveal that the composition is controlled with the heat inputs and the feed ratio is used for temperature control. However, unlike the dual-temperature control scheme, the heat input loop is slowed down by the dead time associated with the analyzer dead time and the reset times now range from 40 minutes to 66 minutes as compared to that of a single digit in the dual-temperature control configu-ration while the reset time for the feed ratio loops remains quite large (Table 4). We expect that the control responses will be much slower than those of the dual-temperature control cases.
Feed flow disturbance is used to evaluate the
dynamic performance of one- temperature- one- com-position control for recovery of dilute acetic acid. Fig.
9 shows the dynamic responses for ±20% feed flow
rate changes. Asymmetric responses can be clearly seen for all four cases and they take, at least, 15 hours to reach steady-state. Despite offset free performance, the closed-loop performance is generally poorer than that of the dual-temperature control counterpart. This is especially true for the cases of 75 wt% and 50 wt% HAc feed where fast transient is replaced by slow dynamics, in order to eliminate steady-state offset. The results presented here clearly indicate the impor-tance of rapid response to disturbance of a control system for these highly nonlinear processes. Once the controlled variables drift away from set point, it takes a great effort to bring them back to set point. This is quite similar to what we have seen in extremely high-purity distillation columns.
V. CONCLUSIONS
This work explores the dynamics and control for the recovery of dilute acetic acid (ranging from 100 wt% to 30 wt%) via esterification using reactive distillation. Despite great economic incentives, it is not clear whether these reactive distillation systems possess good operability. First, two measures are used to analyze the degree of nonlinearity for all four cases. One is the fraction of sign reversal for all tray tem-peratures and the other is the Allgower’s nonlinearity
measure, φN. Results show that significant nonlinearity
and possible steady-state sign reversal are observed for all four systems. A systematic design procedure is used to design the control structures. Simulation
AmOH Feed HAc Feed Organic Reflux RD column Reboiler Decanter Steam Water Product LC2 TC1 LC1 PC1 FC X TC3 TC2 FT FC LC3 FT
Table 3
Controlled variables, manipulated variables, process gain matrices, relative gain array, and tuning parameters for these
five systems
under temperature control
Controlled
Manipulated
Steady state gain
RGA Tuning parameter variables variables AmAc T16 FR = FAmOH / FAcid QR FR QR – T34 : (100 wt%) T34 QR Kc : 0.237 τI : 8 (min) T16 T34 = – 0 .018 14. 980 0. 595 – 0 .656 QR , S FR Λ = – 0 .001 1. 001 1. 001 – 0 .001 FR – T16 : Kc = 0.1 τI : 38.467 (min) AmAc T15 FR = FAmOH /F Acid QR F R QR – T21 : (75 wt%) T21 QR Kc : 0.561 τI : 3.67 (min) T15 T21 = 3. 3 – 0. 115 5. 485 20 .295 QR , S FR Λ = 0. 009 0. 991 0. 991 0. 009 FR – T15 : Kc = 1.2 τI : 65 (min) AmAc T11 FR = FAmOH /F Acid QR F R QR – T15 : (50 wt%) T15 QR Kc : 1.656 τI : 8.76 (min) T11 T15 = 18 .605 16 .429 3. 899 0. 663 QR , S FR Λ = – 0 .239 1. 239 1. 239 – 0 .239 FR – T11 : Kc = 1.86 τI : 62.296 (min) AmAc T10 FR = FAmOH /F Acid QR F R QR – T13 : (30 wt%) T13 QR Kc : 0.31 τI : 1.128 (min) T10 T13 = 37 .399 15 .720 0. 785 – 0 .217 QR , S FR Λ = 0. 396 0. 604 0. 604 0. 396 FR – T10 : Kc = 0.337 τI : 71.49 (min)
* Transmitter span: twice of steady-state value of temperature in
°
C
** Valve gains: twice of the steady-state value for
QR
and
FR
T16 T34 T11 T15
Fig. 5 Temperature control responses for ±20% production rate changes for AmAc esterificaiton with different feed compositions of acetic acid 1 0.99 0.96 0.93 0 10 20 30 XB ,acetaet (m.f.) 80 60 40 20 0 10 20 30 B (kmol/hr) 160 150 140 0 10 20 30 T16 ( ° C) 1.05 1 0.95 0 10 20 Time (hr) 30 ratio 0.04 0.02 0 0 10 20 30 XB ,acid (m.f.) 80 60 40 20 0 10 20 30 R (kmol/hr) 140 130 120 110 0 10 20 30 T34 ( ° C) 1 0.99 0.98 0 10 20 30 XD ,H2O (m.f.) 80 60 40 20 0 10 20 30 D (kmol/hr) 80 60 40 20 Feed +20% Feed –20% 0 10 20 30 Fpentanol (kmol/hr) 6 5 4 3 0 10 20 Time (hr) (a) 100 wt% 30 QR (GJ/hr) 1 0.99 0.96 0.93 0 10 20 30 XB ,acetaet (m.f.) 80 60 40 20 0 10 20 30 B (kmol/hr) 150 140 130 0 10 20 30 T15 ( ° C) 0.6 0.5 0.4 0 10 20 Time (hr) 30 ratio 0.04 0.02 0 0 10 20 30 XB ,acid (m.f.) 80 60 40 20 0 10 20 30 R (kmol/hr) 130 120 110 100 0 10 20 30 T21 ( ° C) 1 0.99 0.98 0 10 20 30 XD ,H2O (m.f.) 150 100 50 0 10 20 30 D (kmol/hr) 80 60 40 20 Feed +20% Feed –20% 0 10 20 30 Fpentanol (kmol/hr) 10 8 6 4 0 10 20 Time (hr) (b) 75 wt% 30 QR (GJ/hr)
Fig. 5 Temperature control responses for ±20% production rate changes for AmAc esterificaiton with different feed compositions of acetic acid (Continue)
1 0.99 0.96 0.93 0 10 20 30 XB ,acetaet (m.f.) 80 60 40 20 0 10 20 30 B (kmol/hr) 145 140 135 130 0 10 20 30 T11 ( ° C) 0.26 0.24 0.22 0.2 0 10 20 Time (hr) 30 ratio 0.04 0.02 0 0 10 20 30 XB ,acid (m.f.) 100 80 60 40 0 10 20 30 R (kmol/hr) 120 115 110 105 0 10 20 30 T15 ( ° C) 1 0.99 0.98 0 10 20 30 XD ,H2O (m.f.) 300 250 200 150 0 10 20 30 D (kmol/hr) 80 60 40 20 Feed +20% Feed –20% 0 10 20 30 Fpentanol (kmol/hr) 20 15 10 5 0 10 20 Time (hr) (c) 50 wt% 30 QR (GJ/hr) 1 0.99 0.96 0.93 0 10 20 30 XB ,acetaet (m.f.) 80 60 40 20 0 10 20 30 B (kmol/hr) 160 140 120 100 0 10 20 30 T10 ( ° C) 0.13 0.12 0.11 0.1 0 10 20 Time (hr) 30 ratio 0.04 0.02 0 0 10 20 30 XB ,acid (m.f.) 200 150 100 0 10 20 30 R (kmol/hr) 115 110 105 100 0 10 20 30 T13 ( ° C) 1 0.99 0.98 0 10 20 30 XD ,H2O (m.f.) 600 500 400 300 0 10 20 30 D (kmol/hr) 80 60 40 20 Feed +20% Feed –20% 0 10 20 30 Fpentanol (kmol/hr) 40 30 20 10 0 10 20 Time (hr) (d) 30 wt% 30 QR (GJ/hr)
results reveal that a dual-temperature control structure works reasonably well for all four cases, especially for 75 wt% and 50 wt% HAc feed. A feedfoward scheme is incorporated to improve the control performance and the results clearly show much improved control can be obtained for 100 wt% and 30 wt% HAc feed compositions. Finally, the temperature- one-composition control scheme is proposed and the off-set-free composition responses are observed, however, with slower dynamics. A final word is that one can combine the advantages of the fast-and-less-accurate temperature control with slow-and-more-accurate com-position control for better control performance with a parallel cascade type of control structure.
ACKNOWLEDGMENTS
This paper is dedicated to the late Professor Y. P. Shih, a mentor for generations to follow and a pio-neer in process control research. His influence in chemical engineering research remains strong ten years after his passing. This work was supported by the Ministry of Economic Affairs under grant 93-EC-17-A-09-S1-019.
REFERENCE
Bristol, E. H., 1966, “On a New Measure of Interac-tion for Multivariable Process Control,” IEEE
Transactions on Automatic Control, Vol. AC-11
Vol. 1, pp. 133-134.
Chang, J. W., and Yu, C. C., 1990, “The Relative Gain for Non-Square Multivariable Systems,”
Chemi-cal Engineering Science, Vol. 45, pp. 1309-1323.
Cheng, Y. C., and Yu, C. C., 2005, “Effects of Feed Tray Locations to the Design of Reactive Distil-lation and Its Implication to Control,” Chemical
Engineering Science, Vol. 60, No. 17, pp.
4661-4677.
Chiang, S. F., Kuo, C. L., Yu, C. C., and Wong, D. S. H., 2002, “Design Alternatives for Amyl Acetate Process: Coupled Reactor/Column and Reactive Distillation,” Industrial and Engineering Chemistry
Research, Vol. 41, No. 13, pp. 3233-3246.
Chien, I. L., Zeng, K. L., Chao, H. Y., and Liu, J. H., 2004, “Design and Control of Acetic Acid Dehy-dration System via Heterogeneous Azeotropic Distillation,” Chemical Engineering Science, Vol. 59, No. 21, pp. 4547-4567.
Hernjak, N., and Doyle, F. J., 2003, “Correlation of Process Nonlinearity with Closed-Loop Distur-bance Rejection,” Industrial and Engineering
Chemistry Research, Vol. 42, No. 20, pp.
4611-4619.
Huang, S. G., and Yu, C. C., 2003, “Sensitivity of Thermodynamic Parameter to the Design of Het-erogeneous Reactive Distillation: Amyl Acetate Esterification,” Journal of the Chinese Institute
of Chemical Engineers, Vol. 34, No. 3, pp.
345-355.
Hung, S. B., Tang, Y. T., Chen, Y. W., Lai, I. K., and Hung, W. J., 2005a, “Dynamics and Control of Reactive Distillation Configurations for Acetic Acid Esterification,” AIChE Journal (in press). Hung, W. J., Lai, I. K., Hung, S. B., Chen, Y. W.,
Huang, H. P., Yu, C. C., and Lee, M. J., 2005b,
Fig. 6 Process flowsheet for feedforward control configuration
X FT FC PC1 FC TC3 LC3 F(x) Σ TC2 LC1 TC1 LC2 FT AmOH feed
HAc feed columnRD
Organic reflux Decanter Reboiler Water Steam Product
Fig. 7 Feedforward control responses for ±20% production rate changes for AmAc esterification with different feed compositions of acetic acid 1 0.98 0.96 0.94 0 10 20 30 40 0 10 20 30 40 0 10 20 30 40 0 10 20 30 40 0 10 20 30 40 0 10 20 30 40 0 10 20 30 40 0 10 20 30 40 0 10 20 30 40 0 10 20 30 40 0 10 20 30 40 XB ,acetaet (m.f.) 70 60 50 40 B (kmol/hr) 155 150 145 140 T16 ( ° C) 1.02 1 0.98 Time (hr) ratio 0.04 0.02 0 XB ,acid (m.f.) 65 60 55 50 R (kmol/hr) 130 120 110 T34 ( ° C) 0.994 0.992 0.99 XD ,H2O (m.f.) 70 60 50 40 D (kmol/hr) 70 60 50 40
Feed +20% with feedforward Feed –20% without feedforward
Fpentanol (kmol/hr) 6 5.5 5 4.5 Time (hr) (a) 100 wt% QR (GJ/hr) 1 0.95 0.9 0 10 20 30 XB ,acetaet (m.f.) 70 60 50 40 0 10 20 30 B (kmol/hr) 160 140 120 100 0 10 20 30 T10 ( ° C) 0.14 0.13 0.12 0.11 0 10 20 Time (hr) 30 ratio 0.04 0.02 0 0 10 20 30 XB ,acid (m.f.) 200 150 100 0 10 20 30 R (kmol/hr) 110 105 100 0 10 20 30 T13 ( ° C) 1 0.99 0.98 0 10 20 30 XD ,H2O (m.f.) 600 500 400 0 10 20 30 D (kmol/hr) 70 60 50
Feed +20% with feedforward Feed –20% without feedforward 0 10 20 30 Fpentanol (kmol/hr) 35 30 25 20 0 10 20 Time (hr) (b) 30 wt% 30 QR (GJ/hr)
“Process Chemistry and Design Alternatives for Recovery of Dilute Acetic Acid through Esterifi-cation in Reactive Distillation,” Industrial and
Engineering Chemistry Research (submitted).
Menold, P. H., Allgöwer, F., and Pearson, R. K., 1997, “Nonlinear Structure Identification of Chemical Processes,” Computers and Chemical Engineering, Vol. 21, pp. S137-S142.
Saha, B., Chopade, S. P., and Mahajani, S. M., 2000, “Recovery of Dilute Acetic Acid through Esteri-fication in a Reactive Distillation Column,”
Ca-talysis Today, Vol. 60, No. 1, pp. 147-157.
Schweickhardt, T., and Allgower, F., 2004, “Quantita-tive Nonlinearity Assessment: An Introduction to Nonlinearity Measure,” Integration of Process
De-sign and Control, P. Seferlis, and M. C. Georgiadis
eds., Elsevier, Amsterdam, the Netherlands. Schweickhardt, T., and Allgower, F., 2005, “Linear
Modeling Error and Steady-state Behaviour of Nonlinear Dynamical Systems,” Internal Report, Institute of System Theory in Engine-ering, Uni-versity of Stuttgart, Stuttgart, Germany.
Shen, S. H., and Yu, C. C., 1994, “Use of Relay-Feed-back Test for Automatic Tuning of Multivariable
Systems,” AIChE Journal, Vol. 40, No. 4, pp. 627-644.
Tang, Y. T., Hung, S. B., Chen, Y. W., Huang, H. P., Lee, M. J., and Yu, C. C., 2005, “Design of Re-active Distillations for Acetic Acid Esterification with Different Alcohols,” AIChE Journal, Vol. 51, No. 6, pp. 1683-1699.
Xu, Z. P., Afacan, A., and Chuang, K. T., 1999a, “Re-moval of Acetic Acid from Water by Catalytic Distillation. Part 1: Experimental Studies,” The
Canadian Journal of Chemical Engineering, Vol.
77, pp. 676-681.
Xu, Z. P., Afacan, A., and Chuang, K. T., 1999b, “Removal of Acetic Acid from Water by Cata-lytic Distillation. Part 2: Modeling and Simula-tion Studies,” The Canadian Journal of
Chemi-cal Engineering, Vol. 77, 682-687.
Yu, C. C., 1999, Autotuning of PID Controllers, Springer-Verlag, London, UK.
Manuscript Received: Dec. 05, 2005 and Accepted: Dec. 06, 2005
X FT FC PC1 FC TC2 LC3 CC LC1 TC1 LC2 FT AmOH Feed
HAc Feed columnRD
Organic Reflux Decanter Water Steam Product
Table 4.
Controlled variables, manipulated variables, process gain matrices, relative gain array, and tuning parameters for thes
e five systems
under one-temperature-one-composition control.
Controlled Manipulated Steady state gain R G A Tuning parameter variables variables AmAc T16 FR = Q R F R QR – XB, acetate : (100 wt%) XB, acetate FAmOH / FAcid T16 Kc : 1.54 τI : 54.36 (min) T16 XB , acetate = – 0 .018 14. 98 1. 000 19 .0 2 QR , S FR Λ = 0. 022 0. 978 0. 978 0. 022 QR XB, acetate FR – T16 : Kc = 0.86 τI : 109.45 (min) AmAc T15 FR = Q R FR QR – XB, acetate : (75 wt%) XB, acetate FAmOH /F Acid T15 Kc : 1.561 τI : 53.67 (min) T15 XB , acetate = 5. 49 20 .3 0 5.38 – 1 1 .73 QR , S FR Λ = 0. 371 0. 629 0. 629 0. 371 QR XB, acetate FR – T15 : Kc = 1.2 τI : 422 (min) AmAc T11 FR = Q R F R QR – XB, acetate : (50 wt%) XB, acetate FAmOH /F Acid T11 Kc : 0.171 τI : 66 (min) T11 XB , acetate = 18 .605 16 .429 20 .547 16 .027 QR , S FR Λ = – 7 .570 8. 570 8. 570 – 7 .570 QR XB, acetate FR – T11 : Kc = 0.884 τI : 979 (min) AmAc T10 FR = Q R F R QR – XB, acetate : (30 wt%) XB, acetate FAmOH /F Acid T10 Kc : 1.244 τI : 49.8 (min) T10 XB , acetate = 37 .399 15 .720 17 .498 6. 422 QR , S FR Λ = – 6 .882 7. 882 7. 882 – 6 .882 QR XB, acetate FR – T10 : Kc = 0.274 τI : 925 (min)
*Transmitter spans: twice steady-state value of temperature and 1 for mole fraction **Valve gains: twice steady-state value for QR
and
Fig. 9 Composition control responses for ±20% production rate changes for AmAc esterificaiton with different feed compositions of acetic acid 1 0.9 0.8 0 10 20 30 XB ,acetaet (m.f.) 80 60 40 20 0 10 20 30 B (kmol/hr) 160 150 140 130 0 10 20 30 T16 ( ° C) 6 5 4 3 0 10 20 Time (hr) 30 QR (GJ/hr) 0.1 0.05 0 0 10 20 30 XB ,acid (m.f.) 60 50 40 30 0 10 20 30 R (kmol/hr) 80 60 40 20 0 10 20 30 Fpentanol (kmol/hr) 1 0.95 0.9 0 10 20 30 XD ,H2O (m.f.) 80 60 40 20 0 10 20 30 D (kmol/hr) 1.2 1 0.8 Feed +20% Feed –20% 0 10 20 30 ratio (a) 100 wt% 1 0.9 0.8 0 10 20 30 40 50 0 10 20 30 40 50 0 10 20 30 40 50 0 10 20 30 40 50 0 10 20 30 40 50 0 10 20 30 40 50 0 10 20 30 40 50 0 10 20 30 40 50 0 10 20 30 40 50 0 10 20 30 40 50 XB ,acetaet (m.f.) 80 60 40 20 B (kmol/hr) 160 140 120 100 T15 ( ° C) 10 8 6 4 Time (hr) QR (GJ/hr) 0.1 0.05 0 XB ,acid (m.f.) 80 60 40 20 R (kmol/hr) 80 60 40 20 Fpentanol (kmol/hr) 1 0.95 0.9 XD ,H2O (m.f.) 150 100 50 D (kmol/hr) 0.7 0.6 0.5 0.4 Feed +20% Feed –20% ratio (b) 75 wt%
Fig. 9 Composition control responses for ±20% production rate changes for AmAc esterificaiton with different feed compositions of acetic acid (Continue)
1 0.9 0.8 0 10 20 30 40 50 0 10 20 30 40 50 0 10 20 30 40 50 0 10 20 30 40 50 0 10 20 30 40 50 0 10 20 30 40 50 0 10 20 30 40 50 0 10 20 30 40 50 0 10 20 30 40 50 0 10 20 30 40 50 XB ,acetaet (m.f.) 80 60 40 20 B (kmol/hr) 160 140 120 100 T11 ( ° C) 20 15 10 5 Time (hr) QR (GJ/hr) 0.1 0.05 0 XB ,acid (m.f.) 100 80 60 40 R (kmol/hr) 80 60 40 20 Fpentanol (kmol/hr) 1 0.95 0.9 XD ,H2O (m.f.) 300 250 200 150 D (kmol/hr) 0.26 0.24 0.22 0.2 Feed +20% Feed –20% ratio (c) 50 wt% 1 0.9 0.8 0 20 40 60 80 100 0 20 40 60 80 100 0 20 40 60 80 100 0 20 40 60 80 100 0 20 40 60 80 100 0 20 40 60 80 100 0 20 40 60 80 100 0 20 40 60 80 100 0 20 40 60 80 100 0 20 40 60 80 100 XB ,acetaet (m.f.) 80 60 40 20 B (kmol/hr) 160 140 120 100 T10 ( ° C) 40 30 20 10 Time (hr) QR (GJ/hr) 0.1 0.05 0 XB ,acid (m.f.) 200 150 100 R (kmol/hr) 80 60 40 20 Fpentanol (kmol/hr) 1 0.95 0.9 XD ,H2O (m.f.) 600 500 400 300 D (kmol/hr) 0.13 0.12 0.11 0.1 Feed +20% Feed –20% ratio (d) 30 wt%