國立臺灣大學醫學院腦與心智科學研究所 碩士論文
Graduate Institute of Brain and Mind Sciences College of Medicine
National Taiwan University Master Thesis
導航能動性提升空間環境之神經表徵 Navigational Agency Enhances
Neural Representations of Spatial Environments
林以莊 Yi-Chuang Lin
指導教授:吳恩賜 博士
Advisor: Joshua Oon Soo Goh, Ph.D.
中華民國109年7月 July, 2020
口試委員審定書
誌謝
我想感謝一切,感謝一切使我走到這裡的人與事。
綿長的故事往往難以起頭,健忘如我卻仍然清楚並欲長久地記得,這橫跨六
年的細碎選擇,當時是如何一一被拾起,鋪陳為這再難回頭的單行道。
為此,我必須勤奮地記錄下這一切,記下自己曾是如何在大一時不怕生地認
識了方雯,在大二電子學與陳毅及思宜學姊,一同嘗試製作EEG儀器,開啟對神 經生物的瞭解,同時在那年輻射中心的暑假決心告別了物理,在大三認知透過方 雯認識昀軒,終於在大四第一次踏進了如今熟悉的1554室,於此展開往後三年在 腦心所的日子。
道路是如此曲折,但沿途更加美麗。我不能不一併記下,深遠的天井,室友
雅郁,電話那頭的父母與子敬,夏日的微風,和抬起頭便總是熠熠的星光,撫平 我於無數個失眠在二十歲的夜晚。擺盪的車廂,晃晃的夕陽,失而復得的物理系 夥伴黃宣凱、王涵聖、陳映寰、陳映妤、彭達剴、小哲、周至恩,和總是殊途同 歸的家欣,大學四年裡的歡笑、淚水、放棄和選擇,皆與你們有關。在這短暫而 看似永恆的季節裡,道路交會又遠離,任我們不可自拔地沾染上彼此的氣息。
模糊的想像和焦慮不安的眼神,這是我走進恩賜老師辦公室抱有的全部,而
老師卻慷慨地贈予我以不短的三年,串起我在腦心實驗室的每個日子。一切知識 皆有老師的提點而構成深意,一切艱辛皆由老師的餘裕迎刃而解,一切快樂皆因 老師的溫馨成為鄉愁。在最敢於想像,也最有能力實現的夢想家如老師的身邊,
我彷彿也稍微距離成為夢想家的憧憬更近了一些。
三年前筆記本上雜亂的猜想,躍然紙上成為具體的假說和架構,形成文字,
形成段落,形成這本厚實的論文,有一路走來汗水的重量。其中的苦澀與欣喜,
總有雅婷與我一同品嘗,鈺軒與宛儒陪伴度過,曾經懞懂地踏入這片未知領域,
終於我們也能自豪地帶著永遠歸屬此處的美好記憶,繼續前方未可知的旅程。實 驗室的煜翔、玉臻、宛倫、啟權、俊毅、幸儀、哲宇、昀軒、一慈、軒齊、志瑜、
芝嘉、苡蓁、彥伶、易修、景伃、芷華、Charlotte、Alice、Jessie、Stephanie、
Rebecca、Tiffany、XiaoYu、Madeline,既日常又驚喜的生日蛋糕,總是沒有零錢 的受試者費,卡關的IRB,小房間的暖氣,潦草的白板,構築我越發眷慕的另一 個家鄉。
送出終稿前最後一次翻閱此文,如今想來已是雲淡風輕的日子,其實每一步
走來都並不輕鬆。艱困或欣喜,豐富而不悔,我小心翼翼地將所有時刻收藏在文 字裡。三十二位素昧平生的受試者,五位熟識,陪伴我以無數快樂時光的政大雅 婷、建勛、庭瑩,悉心幫助審閱的口試委員玉玲老師、植懋老師,熱心而溫暖的 所辦曉雯,總是有聊不完話題的室友家欣、巧翎,一切因你們而成為可能。我曾 熟悉的,在政大的晨曦與晚霞,造影中心過強的冷氣,充斥陽光或夜晚的老舊公 寓,以及奔馳其間的羅斯福幹線,如今都已顯得無比遙遠而教人格外思念。
這篇論文,謹獻給我的父親、我的母親、以及我的妹妹,所有美好皆由你們
開啟。當習慣流浪的我最終遺失了方向,我深深的嘆息卻自你們耳裡長出了翅
膀,成為能夠飛翔的夢想。親愛的爸媽,你們總喜歡說我是你們的驕傲,然而我 的一切都與你們相像,若有值得被愛之處,那必然來自於你們。總是知曉並接納 我的一切,親愛的子敬,沿途風景再晦暗,都因有你而能安心。與你一起,我已 是如此迫切地想看看,選擇的這條路會帶領我們走向哪裡,又會陪伴我們走向多 遠的彼方。
本研究發現,價值決策腦區與海馬迴,負責合作標定空間中別具意義的地
點,例如十字路口與顯目地標,都將被賦予更高的空間意義,最終完整我們對於 所在空間的理解。親愛的朋友,親愛的那些我所放棄的選擇,感謝你們成為路途 中意義非凡的交叉路口,為這趟未竟的旅程各自寫下註解。親愛的家人,感謝你 們成為旅途中的北極星,一如海馬迴所要見證的恆久記憶,是我生命裡永遠的權 重,在這飛逝而無法迴轉的單行道上,一頁頁都有你們的字跡。
中文摘要
位於海馬迴中之網格細胞與位置細胞是為建立認知地圖之空間表徵。於本研究 中,我們假設於導航期間,價值決策之能動性將加強發生於交界處與地標處之決 策事件之權重,進而提升導航表現。此發生於交界處與地標處,或稱空間節點之 編碼,提供了海馬迴神經細胞額外之權重,以編碼空間成為結構性之節點地圖。
基於此假設,我們檢驗了於學習及提取期間,空間地圖於內部(自由導航)與外 部(引導導航)產生之導航行為下之神經反應。我們招募了二十一位受試者於虛 擬迷宮中分別進行自由導航、與引導導航之功能性磁振造影(fMRI)實驗。學習 期間,於自由導航之情況下,受試者自由習得地標位置;於引導導航之情況下,
受試者觀看影片引導其習得地標位置。提取期間,受試者判定目的地標之方向、
距離、並且導航至目的地標始自不同之地點。我們觀察到於提取期間,引導導航 相較於自由導航,受試者需花費更多時間導航至目的地標,並且展現更頻繁之失 誤。關鍵腦區包含學習期間之輔助運動皮質區、與學習及提取期間之海馬迴,於 自由導航之下,展現較引導導航下更高對於空間節點之神經反應;學習期間之顳 中迴與提取期間之前、後扣帶迴皮質,於引導導航之下,展現較自由導航下更高 對於空間節點之神經反應。特別來說,前海馬迴於學習期間自由導航下,展現較 引導導航下更高對於空間節點之神經反應;後海馬迴則表現於提取期間引導導航 下,較自由導航下更高由距離誤判比率調控對於距離判斷之神經反應。總結而 言,我們展示於空間導航期間,價值決策能動性對於前海馬迴建構空間節點訊息 之重要性。
關鍵字:空間導航;價值決策;網格細胞;位置細胞;海馬迴;功能性磁振造影
Abstract
Grid and place cell activity in the hippocampus (HC) instantiate cognitive map representations of space. In this study, we hypothesized that agency in navigational decision-making enhances navigational performances via emphasis on decision events at junctions and landmarks. Such coding of junctions and landmarks, or spatial nodes, provides HC neurons with additional weighting to encode plain space into structured node maps. To this end, we evaluated neural responses during learning and retrieving spatial maps under conditions of internally (Free) vs. externally (Tour) generated navigational movements. Twenty-one participants underwent functional magnetic resonance imaging (fMRI) spatial navigational experiments in virtual mazes under Free and Tour conditions. In the Free condition, participants learned landmark locations by free navigation. During retrieval, participants determined directions and distances and navigated to target landmarks from various start locations. In the Tour condition, participants viewed videos guiding them through the landmarks then did the same retrieval test. Navigation to target landmarks during retrieval took longer and failed more often for Tour than Free conditions. Critically, supplementary motor area responses during learning and HC responses during learning and retrieval to spatial nodes were higher for Free than Tour conditions. Middle temporal gyrus responses during learning, anterior and posterior cingulate cortex responses during retrieval to spatial nodes were higher for Tour than Free conditions. In particular, anterior HC responses to spatial nodes during learning were higher for Free than Tour conditions. In addition, posterior HC response modulation by distance mis-estimation during retrieval was greater for Tour than Free conditions. In sum, we demonstrate that agency in making navigational decisions is important for spatial node formation in anterior HC.
Keyword: Spatial navigation; Decision making; Grid cell; Place cell; Hippocampus;
fMRI
Content
口試委員審定書 ...i
誌謝 ...ii
中文摘要 ...iv
Abstract ...v
Content ...vii
Introduction ...1
Grid and Place Cells Represent Space in Animal Hippocampus ...2
Grid and Place Cells are also in the Human Hippocampus ...4
Navigational Agency Modulates Spatial Map Representations ...7
Theory: Decision Making Circuits Provide Basis to Label Internal Brain Activity States in Navigational Agency ...9
Hypothesis: Map Learning with Navigational Decisions Enhances Spatial Representations ...11
Methods ...14
Participants ...14
Stimuli ...14
Virtual Environment Visuals, Interface, and Parameters ...14
Debriefing and Questionnaire ...16
Procedure ...16
Familiarization ...17
Formal Experiment ...19
Debriefing and Questionnaire ...20
Behavioral Error Rates During Retrieval Analysis ...20
Brain Imaging Acquisition ...21
fMRI Data Preprocessing ...22
First Level Model of Learning Phase Neural Responses ...23
First Level Model of Retrieval Phase Neural Responses ...24
Second Level Model of Neural Responses ...24
Region of Interest (ROI) Definition and Analysis ...25
Results ...26
Behavioral Results ...26
Learning Patterns in Free and Tour Conditions ...26
Better Map Retrieval Performances in Free than Tour ...26
Functional Imaging Results ...27
Differences of Neural Responses During Free and Tour Learning ...27
Differences of Neural Responses During Free and Tour Retrieval ...28
Specific Spatial Environments Represented in ROIs ...29
Specific Neural Responses in Hippocampal Subregions ...30
Correlations Between Hippocampal Responses and Behavioral Performances ...30
Discussion ...32
Navigational Agency Enhances Navigational Performances ...32
Decision Making Provides Basis to Label Internal Brain Activity States in Navigational Agency ...34
Dissociation Between Anterior and Posterior Hippocampus in Decision Making
Based Navigational Neural Representations ...36
Limitations and Implications ...37
References ...39
Figures ...47
Figure 1. Hypothesized Brain Activations During Learning ...47
Figure 2. Hypothesized Brain Activations During Retrieval ...48
Figure 3. Virtual Environment Settings ...49
Figure 4. Familiarization Procedure and Design ...50
Figure 5. Formal Experiment Procedure and Design ...51
Figure 6. a priori anatomical hippocampal ROIs ...52
Figure 7. Learning Paths in Free and Tour Conditions of Single Subject ...53
Figure 8. Learning Patterns in Free and Tour Conditions ...54
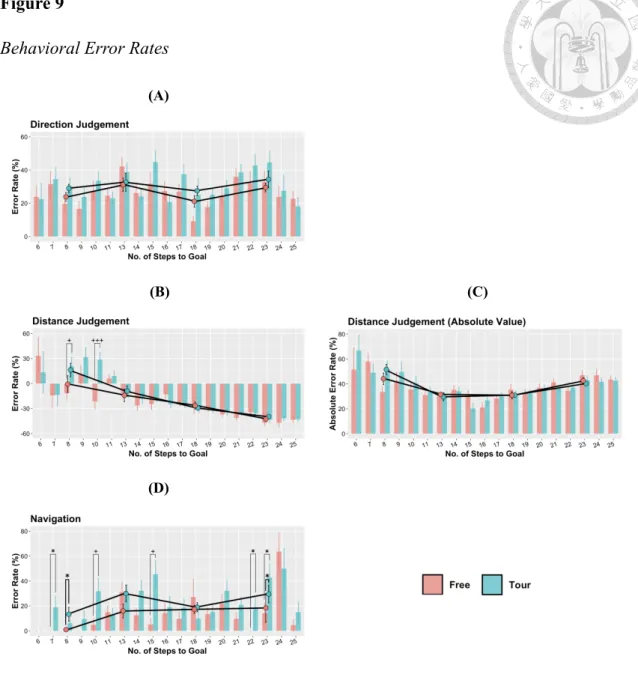
Figure 9. Behavioral Error Rates ...55
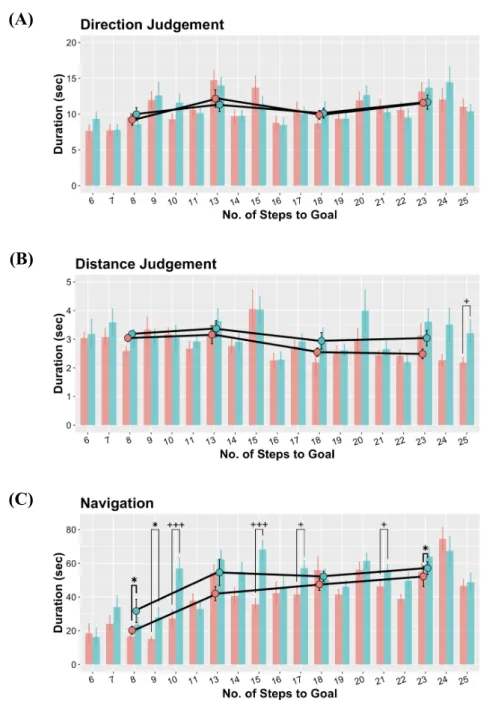
Figure 10. Behavioral Durations ...56
Figure 11. Differences of Neural Responses During Free and Tour Learning 57 .... Figure 12. Differences of Neural Responses at Different Location States During Free and Tour Learning ...58
Figure 13. Differences of Neural Responses at Different Location States During Free and Tour Retrieval ...59
Figure 14. Differences of Neural Responses During Free and Tour Retrieval Judgements ...60
Figure 15. Specific Spatial Environments Represented in ROIs ...61
Figure 16. Specific Neural Responses in Hippocampal Subregions ...62
Figure 17. Correlations Between Hippocampal Responses and Behavioral Performances ...63
Tables ...64
Table 1. Learning Patterns in Free and Tour Conditions ...64
Table 2. ANOVA Table of Error Rates ...65
Table 3. Paired T Test Table of Error Rates in Free and Tour Conditions ...66
Table 4. Paired T Test Table of Direction Judgement Error Rate ...67
Table 5. Paired T Test Table of Distance Judgement Error Rate ...68
Table 6. Paired T Test Table of Navigational Error Rate ...69
Table 7. ANOVA Table of Durations ...70
Table 8. Paired T Test Table of Durations in Free and Tour Conditions ...71
Table 9. Paired T Test Table of Direction Judgement Duration ...72
Table 10. Paired T Test Table of Distance Judgement Duration ...73
Table 11. Paired T Test Table of Navigational Duration ...74
Table 12. Differences of Neural Responses During Free and Tour Learning ...75
Table 13. Differences of Neural Responses At Different Location States During Free and Tour Learning ...76
Table 14. Differences of Neural Responses At Different Location States During Free and Tour Retrieval ...77
Table 15. Differences of Neural Responses During Free and Tour Retrieval Judgements ...78
Table 16. Specific Spatial Environments Represented in ROIs ...79
Table 17. Specific Neural Responses in Hippocampal Subregions ...80
Introduction
Spatial navigation has been an attention-receiving topic regarding its underlying neural mechanism and the factors modulating it. To date, it is well established that neural representations of spatial environments in animals are implicated in grid and place cells in and around hippocampus (HC) (Bjerknes, Moser, & Moser, 2014; Chen, Lin, Green, Barnes, & McNaughton, 1994; Hafting, Fyhn, Molden, Moser, & Moser, 2005; John O'Keefe & Burgess, 1996; John O'keefe & Nadel, 1978; Packard &
McGaugh, 1996; Taube, 1995; Taube, Muller, & Ranck, 1990; Tolman, 1948). The coding of spatial environments in grid and place cells have also been found in human HC as well, and particularly, the posterior compared to the anterior HC was found to encode more spatial information (Bellmund, Deuker, Navarro Schröder, & Doeller, 2016; Doeller, Barry, & Burgess, 2010; Duarte, Ferreira, Marques, & Castelo-Branco, 2014; Ekstrom et al., 2003; Jacobs et al., 2013; Maguire et al., 2000; Nadel, Hoscheidt,
& Ryan, 2013; Sherrill, Chrastil, Aselcioglu, Hasselmo, & Stern, 2018). That spatial maps are coded in grid and place neuronal responses (Marchette, Bakker, & Shelton, 2011; Morgan, Macevoy, Aguirre, & Epstein, 2011; Sherrill et al., 2018) serves as a tool to further investigate how these neural representations of space are modulated by navigational agency, the ability to decide how to move in an environment (Elizabeth R Chrastil & Warren, 2013; Geva-Sagiv, Las, Yovel, & Ulanovsky, 2015). Research on navigational agency, however, remains largely restricted to behavioral levels (Elizabeth R. Chrastil & Warren, 2015; Yamamoto, 2012). There has been scarce human brain imaging studies looking the role of decision making processes, which has been proposed as an important component in spatial navigational agency (Elizabeth R Chrastil & Warren, 2013; Geva-Sagiv et al., 2015), in modulating neural responses
during spatial navigation. In this study, we postulated that decision making regulates grid and place cell activity in the posterior HC by labeling critical spatial nodes with higher levels of weightings compared to non-node spatial locations. These specific weightings of spatial nodes in the posterior HC help to build a more accurately structured map of the environment under the regulation of decision making processes in other brain areas. This in turn should enhance spatial navigational behavioral performances. We address this hypothesis in a functional magnetic resonance imaging (fMRI) experiment to evaluate HC activation during spatial learning and retrieval under different conditions of navigational decision making agency for spatial map acquisition.
Grid and Place Cells Represent Space in Animal Hippocampus
The process by which animals move themselves from one location to another is termed as spatial navigation (Bowman, Davis, Hodges, & Badre, 1999). It has been found that when environmental settings are altered or original paths are blocked, mice remain capable of establishing novel traversals accordingly to adapt to the changes, instead of sticking to the originally learned routes. In light of such findings, Tolman (1948) proposed that there is a cognitive map inside the brains of mice that integrates spatial information to form a holistic map-like representation. Moreover, this concept of a cognitive map in the brain should exist in all navigating animals including humans.
This idea of a cognitive map in the brain conflicts with traditional views of the brain as a collection of basic stimulus-response mappings. This debate inspired many for the search for brain regions which might be responsible for instantiating a cognitive map of spatial environments. Using a cross-maze paradigm, Tolman (1948) observed how mice navigated between the double T-like four arms of the maze in which the starting points were altered to the opposite arms during retrieval session. Whereas the
cognitive map view predicts that mice should run to the correct opposite arm (place learning), the stimulus-response view predicted that mice should go to the incorrect originally learned arm (response learning). By putting mice with either HC or caudate lesions into the maze, it was revealed that HC lesion led to deficit in place learning, and caudate lesion to deficit in response learning (Packard & McGaugh, 1996). These findings demonstrate that both views about spatial representations in the brain had merit but involved mental operations implicated in different brain areas.
Continuing with the discovery of a strong relation between HC and cognitive maps (Morris, Garrud, Rawlins, & O'Keefe, 1982; J. O'Keefe & Dostrovsky, 1971), O’Keefe observed that single neuron firing patterns in the HC were localized to specific place fields. These localized place-sensitive neurons only fired when mice passed through specific places in the environment, thus the term place cells (John O'Keefe &
Burgess, 1996). Another type of place-sensitive neurons were later recorded in the dorsocaudal medial entorhinal cortex of mice by Edvard Moser’s group. Unlike place cells, these neurons were sensitive to multiple locations in the environment which combined together in a manner that resulted in a 6-fold equilateral triangle grid across the environment, hence the termed grid cells. Grid cells activity was found to represent real-world place fields (Gu et al., 2018) and are sensitive to orientation, modulating activity according to how environmental cues are rotated (Hafting et al., 2005).
Apart from the discovery of place and grid cells, head-direction cells, sensitive to specific head orientation and movement, have also been found in posterior subiculum (Taube et al., 1990), retrosplenial cortex (Chen et al., 1994), and anterior thalamic nuclei (Taube, 1995) in mice. Based on these navigational neurons, neural networks capable of simulating real-world navigation were developed (Barry & Burgess, 2007).
These simulations further suggested that a type of neurons responsible for obstacle borders should be present in the brain (Barry et al., 2006). Based on these neural network predictions, border-specific cells were subsequently discovered in the entorhinal cortex, and termed border cells (Bjerknes et al., 2014). It was also found that border cells were not the only neurons sensitive to barriers, as studies on grid cells also revealed distortions in the grid-like pattern around boundaries in the spatial environment. It is noteworthy that this finding further suggests that barriers in spatial environments can cause distortions to grid cell activity in spatial representations (Hägglund, Mørreaunet, Moser, & Moser, 2019). These combined findings of place, grid, head-direction, and border cells in and around the HC region constitutes a comprehensive view of how different types of spatial information is integrated and represented in the brain to achieve spatial navigation (Edvardsen, Bicanski, & Burgess, 2020).
According to this integrated discovery, O’Keefe and Nadal thus proposed the HC as being the primary locus of the cognitive map, the center of space representation in animals with an advanced central nervous system (John O'keefe & Nadel, 1978).
Indeed, similar neural responses have been found across species with place cells in bat HC (Ulanovsky & Moss, 2007), as well as place cells (Hazama & Tamura, 2019) and spatial view sensitive cells (E. Rolls et al., 1989; E. T. Rolls, 1999) in monkey HC.
Studies in birds also revealed that pigeons with HC lesion took significantly more time during homing behavior, indicating critical HC involvement in spatial navigation (Gagliardo, Ioalé, & Bingman, 1999; Kesner & Olton, 2014).
Grid and Place Cells are also in the Human Hippocampus
Whereas findings of grid cells and place cells in animals have been well
covered, it remained unclear whether such findings could be replicated and generalized to humans due to the gap in brain structure and function between animals and humans.
These constraints in human samples largely stemmed from ethical consideration in collecting direct single neuron firing data, as well as difficulty in acquiring such data under real-space navigational behavior. Despite these difficulties, a few studies have managed to implement similar experimental designs in patients undergoing brain surgeries. In addition, with improvements in technology real-space navigation could be tackled via establishing simulations in virtual environments in which visual stimuli of fixed fields of view are presented and body movements are represented by finger movements in computer interfaces. Using such setups, firing pattern similar to grid cells during spatial navigation have been observed in neurons in the entorhinal cortex, HC, and cingulate cortex of patients undergoing epileptic surgery. Such findings support the notion that human brains engage similar neural representations of spatial environments in grid and place cells for spatial navigation (Jacobs et al., 2013).
Past studies of spatial navigation were designed with more open-spaced environment containing an invisible goal. Such Morris Water Maze environments are far from resembling real-space navigation, such that there is necessity to investigate neural responses in more ecologically valid spatial environmental simulations. In studies with such design, dissociation between place-specific and view-specific neurons have been reported in HC and parahippocampal regions (paraHC) (Ekstrom et al., 2003). Place cells are found to create clusters in HC and are sensitive to goals such that they fire only when specific navigational goals are given. View-responsive cells have also been found to be clustered in the paraHC, and are also sensitive to given goals.
Such findings indicate that there is a complementary collaboration between HC and
paraHC regions during spatial navigation, and more importantly, that the representations of place cells are regulated by differential goal-related properties linked to locations.
Apart from direct single neuron recordings, experiments applying fMRI have also attempted to demonstrate grid cell firing patterns in HC regions using a more derivational approach. The firing pattern of grid cells predicts neural activation discrepancies under different heading directions, resulting in highest synchronized firing activation every 60° in movement directions with respect to the direction of the grid.
Based on this prediction, neural activation was examined in the whole brain for participants navigating in different directions. This approach revealed corresponding neural responses in the entorhinal cortex, suggesting clustered neurons with firing patterns similar to grid cells (Doeller et al., 2010). Studies employing more complex environments, such as virtual cities with buildings, have also obtained similar findings.
Entorhinal cortex activation was significantly modulated in accordance with 60°
heading rotations with respect to the overall grid when participants imagined directions between different landmarks (Bellmund et al., 2016). These findings applying fMRI are consistent with the engagement of grid and place cells for spatial representations in human medial temporal lobe. Critically, these demonstrations provide the possibility of reporting such medial temporal cell activation behavior without implementing invasive single neuron experimental designs.
Via employing these non-invasive methods, differentiated functions of HC subregions during spatial navigation were further examined. HC exhibited functional dichotomy along the longitudinal axis, with the posterior region more engaged in spatial navigation compared to anterior region. Structural ROI analysis revealed larger structural volumes of posterior HC, and smaller volumes of anterior HC in well-trained
taxi drivers than control participants. Within the taxi drivers, volumes of posterior HC and anterior HC were respectively positively and negatively correlated with the time the drivers spent in the industry (Maguire et al., 2000). More specifically, functional MRI showed that posterior HC was more engaged in spatial information, and anterior HC was more engaged in context encoding (Duarte et al., 2014; Nadel et al., 2013).
Navigational Agency Modulates Spatial Map Representations
Compared with the focus on grid and place cells in HC, there have been scarce discussion of how agency in navigation mediates spatial representations in the brain and subsequent navigational performance. The few studies evaluating how navigational agency modulates behavioral navigational performance have considered the neural correlates underlying processing of landmarks, and distances and directions between landmarks as well as routes as the critical informational elements necessary for spatial navigation. Structural MRI has shown significantly larger grey matter volume of HC, paraHC, and thalamus in participants with higher first-person navigational performances who showed lower error rates for landmark retrieval (Sherrill et al., 2018). Such findings are consistent with the notion that greater engagement of the above brain areas enhance landmark representations during spatial navigation (Epstein, Patai, Julian, & Spiers, 2017). The dissociation of place and response learning in HC and striatum previously found in animal studies have also been replicated in human samples vis-à-vis the involvement of HC in using landmarks to create novel routes (Marchette et al., 2011). Finally, landmarks separated by short distances engaged similar responses in the HC as similar representations, whereas landmarks separated by long distances engaged more distinct HC responses, reflecting the coding of distances (Morgan et al., 2011).
Considering that these elements of spatial navigation have been defined in human samples, we now turn to the elements of information that might comprise navigational agency in the brain. Information involved in spatial navigational agency can be categorized into external sensations such as visual and acoustic stimuli, and internal monitored states including proprioceptive, vestibular, attention, and decision states (Elizabeth R Chrastil & Warren, 2013; Geva-Sagiv et al., 2015). The influence of visual stimuli in spatial navigation is likely the primary source of navigational information coded in place cells, which integrate different fields of view of the sizes and shapes of visual geometric objects and boundaries and how they change (Muller &
Kubie, 1987; John O'Keefe & Burgess, 1996). Internal sources of navigational state provides a means to navigate independently from external stimuli such as homing behavior in which animals return to their nests despite the external navigational stimuli being absent or altered (Etienne, Teroni, Hurni, & Portenier, 1990). These animal studies, however, failed to differentiate contributions of attention and decision making in modulating the importance of these sources of navigational information (Etienne &
Jeffery, 2004). On this front, human studies have been more successful in discriminating the contribution of attention on spatial navigation. For instance, it was found that spatial navigational information would be distorted if participants engaged divided attention (Albert, Reinitz, Beusmans, & Gopal, 1999).
Overall, the above considerations review the roles of possible different sources of navigational information that animals and humans use to structure the relationships between different landmarks, directions and distances between landmarks, and routes that comprise the spatial environment. Importantly, these sources of navigational information might be used to accurately represent the real spatial relationships or they
might lead to distortions in the spatial relationships. In this present study, we were interested in investigating how a critical internal source of navigational information, navigational decisions internally generated by the agent, regulates spatial representations in the brain.
Theory: Decision Making Circuits Provide Basis to Label Internal Brain Activity States in Navigational Agency
Decision making, which we suggest here as one of the sources of spatial navigational information, has been a well investigated research topic on its own in other fields. Decision making is comprised of several different sub-processes some of which include error detection, goal evaluation, action selection, and reward tracking which are also important for successful spatial navigation. Key brain areas implicated in these above sub-processes in decision-making include the anterior cingulate cortex (ACC), orbitofrontal cortex (OFC), supplementary motor area (SMA), the striatum, and ventromedial prefrontal cortex (VMPFC). The ACC has been found to integrate information pertaining to errors and conflicts, and serves to guide future action selection in both animals and humans (De Martino, Kumaran, Seymour, & Dolan, 2006;
Kennerley, Walton, Behrens, Buckley, & Rushworth, 2006; Rushworth, Behrens, Rudebeck, & Walton, 2007). ACC responses are often tied with processing in the orbitofrontal cortex (OFC). Whereas ACC processing reflects more monitoring conflicts between experiences and decisions, OFC processing reflects more subjective states and affective reactions, particularly towards negative valences and uncertain values (Bechara, Damasio, & Damasio, 2000; De Martino et al., 2006; Elliott, Dolan, & Frith, 2000; Hsu, Bhatt, Adolphs, Tranel, & Camerer, 2005; Rushworth et al., 2007). The SMA is known to be involved in planning of motor movements and, in conjunction with
the striatum, deliberation during action selection (Wunderlich, Rangel, & O'Doherty, 2009). In addition, VMPFC is discovered to track the reward outcomes, and along with the striatum, involve in value-based decision making (Daw, O'doherty, Dayan, Seymour,
& Dolan, 2006; Haber & Knutson, 2010; Hare, Camerer, & Rangel, 2009; Knutson, Fong, Adams, Varner, & Hommer, 2001). In this study, we considered that these neural circuits including ACC, OFC, SMA, striatum, and VMPFC operate together when we make decisions about movement actions during spatial navigation.
Past studies viewing navigational decision making as reflecting internal agency, henceforth navigational agency, in spatial navigation demonstrated that decision making enhances behavioral navigational performances. Specifically, navigational agency reduced errors made in distance judgement and engaged more novel shortcut planning (Elizabeth R. Chrastil, Sherrill, Hasselmo, & Stern, 2015; Yamamoto, 2012).
Nevertheless, these studies were carried out without brain imaging data and therefore were unable to provide insight on the underlying neural basis for the benefit of navigational agency.
Previous findings of grid and place cells seem to treat all possible contributing inputs to spatial information as equally encoded in these neurons. Based on this, each spatial coordinate location is considered to be no different from others, so that navigational retrieval about each coordinate should also evince equal performance.
Clearly, this prediction contradicts at least with the findings of distorted grid cell firing patterns around borders (Hägglund et al., 2019), and the concept that landmarks are critical elements encoded spatial information relative to non-landmark spatial coordinates (Epstein et al., 2017). Based on the notion that spatial information is not consistent in every location in the environment, we theorized that during spatial
navigation, one operation that navigational decisions apply is to label certain locations with different weightings. Such location labelling results in certain spatial coordinate states instantiated by grid and place cells as having higher weighting in a given spatial representational context than non-labelled coordinates. In other words, decision labelling of coordinates results in the coding of nodes in the space, which are associated with enhanced grid and place cell activity relative to non-nodes, or edges in the space.
Importantly, navigational agency enhances the formation of nodes veridically represent real landmarks in space and should result in more structured map representations by grid and place cells in the HC, especially in the space-relevant posterior region, compared to navigation without agency of movement decisions.
Hypothesis: Map Learning with Navigational Decisions Enhances Spatial Representations
In this study, the engagement of navigational decision making or not is manipulated in the learning session, in which participants acquired the spatial environment under conditions of internally (Free) or externally (Tour) generated navigational movements. The structure of the acquired spatial map representations are then assessed during a later retrieval session focusing on participant perceptions and memory for landmarks, distances, and directions between landmarks (Epstein et al., 2017). The space presented to participants was established as virtual environment fMRI task resembling a complex real-world city to more ecologically simulate daily spatial navigational experiences (Ekstrom et al., 2003).
During the learning session, participants have to establish a cognitive map of the virtual spatial environment. This should comprise the encoding of spatial nodes including path junction and landmark locations at which changes in path taken results in
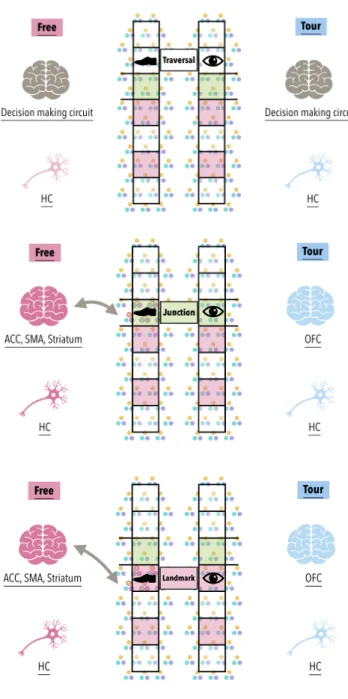
different subsequent navigational options to other locations. As such, junctions and landmarks should engage higher grid and place cell activity relative to basic path traversals. That is, we hypothesized that navigational decisions at junctions or landmarks serves to assign these spatial locations with different levels of weighting such that they can be construed as node coordinates whereas traversals can be construed as edge coordinates (see Figure 1).
Critically, participants are only allowed to make navigational decisions during learning in the Free but not Tour condition. As such, we expected the HC (with grid and place cells) to exhibit higher activation at these spatial nodes for Free than Tour conditions. In addition to HC responses, we also expected higher activity in Free than Tour conditions in decision making circuits, including ACC, SMA, striatum, and VMPFC (Daw et al., 2006; De Martino et al., 2006; Haber & Knutson, 2010; Hare et al., 2009; Kennerley et al., 2006; Knutson et al., 2001; Rushworth et al., 2007;
Wunderlich et al., 2009). By contrast, without regulation of decision making in the Tour condition, we expected that there would be less distinctive activation in the HC to junctions and landmarks relative to during basic traversals. That is, there would be reduced assignment of differential weightings such that there would be reduce node/
edge contrast in participants’ map representations. In addition, more affective reactive responses might be observed, such as in OFC because participants might instinctively want to choose a different path to take but are instead restricted from doing so (Bechara et al., 2000; De Martino et al., 2006; Elliott et al., 2000; Hsu et al., 2005; Rushworth et al., 2007).
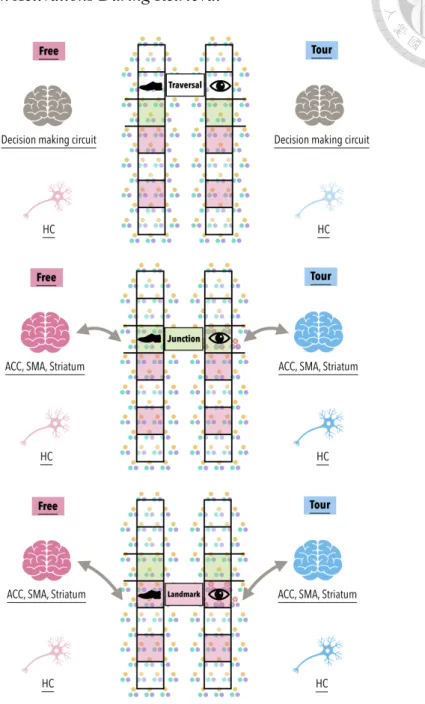
During retrieval session of the spatial navigation, we expected performance to show more complete understanding of environments learned under the Free relative to
the Tour condition. Specifically, participants should show less distance and direction judgement errors as well as have more successful navigational performance to target locations. Critically, we reasoned that node locations en route to target locations should be better learned in the Free than Tour conditions such that they should evoke less processing during retrieval. Instead, node locations might at least evoke more novel encoding for the Tour condition. As such, we expected that there would be higher level of activation in the HC in the Tour than Free condition reflecting better learned nodes in the latter. We expected minimal activation difference in the decision making circuits, as both Free and Tour conditions during retrieval equally require navigational decision making (see Figure 2). We also expected that the navigation-related HC responses more significant in posterior (space-related) than anterior (context-related) regions. We project our findings to contribute deeper insight into how decision making modulates grid and place cell activity in the HC that alters mental representations of the spatial environment with implications for HC function and spatial navigational performance.
Methods
Participants
A total of 21 participants (mean age of 23.7 years old, standard deviation of 2.3 years old, ranging from 21 to 28 years old, 11 females) were recruited for 2 8-run spatial navigation fMRI experiments. Advertisement was applied on an online bulletin board.
All participants were right-handed, with normal or corrected to normal vision, screened without neurological or psychological disorders, and suitable for fMRI scan. Informed consent, which had been approved by National Taiwan University Hospital Research Ethics Committee, was obtained in written form from all participants before the experiment.
Stimuli
Virtual Environment Visuals, Interface, and Parameters
Virtual environment used for the experimental design was constructed via Unreal Engine (Version: 4.18.3). and captured in Figure 3. Photographs of street views were captured around Taipei main station by Charlotte Maschke and Ya-Ting Chang, including photographs of 55 shops, 34 walls with windows, 60 walls with doors, and 1 sidewalk pavement. These photographs were then pasted on 3 x 3 x 3 m blank cubes to build unit buildings, creating in both of the mazes a total of 12 goal shops, 102 plain buildings, 80 roads, and 4 obstacles which were meant to increase the level of difficulty.
Eye-catching billboards were created by pasting logos on 3 x 3 x 0.6 m cubes, and were only presented on top of the 12 goal shops to mark these landmarks saliently. Non-goal surroundings were built to simulate Taipei street views, including potted plants, trees, sidewalks, and crosswalks generated by inbuilt materials.
A smaller maze used in the familiarization session was built in a 24 x 24 m environment consisting of 8 x 8 unit buildings, with only 1 goal shop which would not be used in the formal experiment. Two mazes used in the formal experiment were built in a 72 x 72 m environment consisting of 24 x 24 unit buildings, respectively with 12 goal shops not overlapping with each other. Both mazes consisted of 9 blocks (comprised of 16 to 32 unit buildings) identical in shape but different in locations, 13 or 14 junctions, the same number of between-goal paths, similar between-goal distances, and the same non-goal surroundings.
Screenshots of the street views were obtained after the construction of the maze environments using an inbuilt camera in Unreal Engine set at height of 1.5 m and field of view 120° spaced by distance of 6 m. A total of 80 locations with street views was captured, and for each location, distinct screenshots of 8 directions divided by 45° were obtained. Together these screenshots comprised all possible first-person views of the maze based on 45° view rotations at every possible path location in the mazes. For further details which would be needed in later direction judgement session, distinct screenshots of 16 directions divided by 22.5° were exclusively captured at the 12 goal shops. These screenshots would be directly shown as the street view when the participants travel the maze.
Screenshots were then presented as slides in the main experimental design using E-prime 2.0 software (Psychology Software Tools, Pittsburgh, PA). Background color of the slides was set to be black, font was set to be 24 pt white bold SimHei in traditional Chinese, and the textual instructions period proceeding at the participant’s own pace.
When used, the fixation stimuli was set to be 1 x 1 cm sized white cross in the center of the screen with duration jittered from 1.5 to 2.5 second.
Throughout the experiment, participants were required to use their right hand to make all of the judgements and movements. During logo familiarization, the index, middle, and pinky finger press indicated the left shop, the right shop, and answer confirmation, respectively. During direction judgement (Dir), the index, ring, and pinky finger press was for turning the view left, turning right, and answer confirmation, respectively. During distance judgement (Dis), the index, ring, and pinky finger presses indicated smaller distances, larger distances, and answer confirmation, respectively.
During navigation (Nav), the index, middle, ring, and pinky finger presses indicated left turn, forward, right turn, and backward movements in the maze, respectively, at one step unit per press. Due to time resolution constraints of the fMRI, movements made in the maze both via participants themselves and via preset videos were all restricted to 1 second per move to create low-speed navigation such that the neural responses could be modeled in a more trial-like manner with hemodynamic response function (HRF) convolution (see fMRI analysis below).
Debriefing and Questionnaire
A white A4 paper was provided to the participants for drawing the outline of the maze indicating the locations of the 12 goal shops for the learning phase. A self-report questionnaire was also delivered that probed demographics, monthly income, family medical history, and gaming experiences including frequency, usual time spent, type, and the relatedness of games played to spatial navigation.
Procedure
In order to achieve counterbalance within participants between Free and Tour conditions as well as the 2 mazes, the complete experiment required 2 participation periods at different days. On the first day, participants were randomly assigned to either
Free or Tour condition, and 1 of the 2 mazes. Participants were asked to return a few days later to complete the other condition in the other maze.
Familiarization
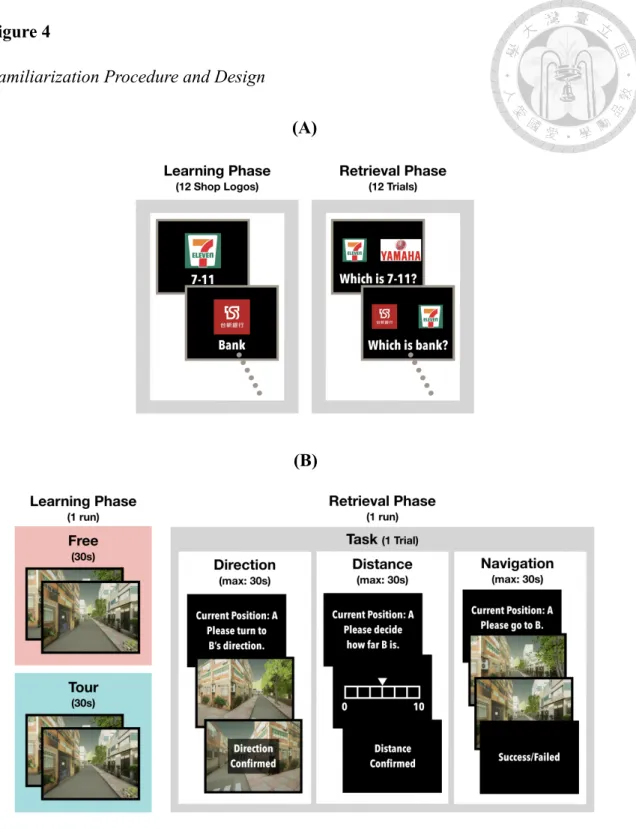
The complete procedure and design of the familiarization is illustrated in Figure 4. Familiarization was conducted on a laptop outside the scanning room before the formal experiment. The first part of the familiarization was goal shop differentiation.
Participants were requested to memorize the 12 distinct goal shops which were common in the streets of Taiwan, informed that these were the locations to remember in the later experiment sections, and then tested if all the goal shops were distinguishable. During goal shop differentiation, 1 of the 12 goal shop logos was presented on the center of the screen with its shop name under the logo. The next logo and name would be presented if participants pressed the informed button by their index finger once they got familiar with the logo. The 12 logos were presented in random sequence, and ended when each of the 12 logos was presented once. Later, 2 logos were simultaneously presented evenly spaced aside the center on the screen. Participants were then requested to answer which of the 2 logos presented was the correct logo of the designated goal shop. The sequence of this differentiation task was also random, and the task would end when all of the 12 logos as questions were asked. If errors were made during the differentiation task, the whole procedure of goal shop differentiation would start automatically again, and this procedure would continue to repeat until all of the answers were correctly given.
The second part of familiarization was experimental environmental familiarization, which was conducted to ensure the smooth motion of participants inside the scanning room. The procedure of this environmental familiarization consisted of
merely 1 learning run and 1 retrieval run each with 1 trial in the small maze. Only the learning run with learning fashion matched with the designated condition would be conducted, and the design of different conditions was remained confidential to the participants. The 2 learning fashions were the Free condition, in which participants learned and travelled the environment on their own decision, and the Tour condition, in which participants learned and travelled the environment by a pre-recorded video clip.
Retrieval run, which was not affected by different learning condition, would be conducted repeatedly until the participants reported themselves familiar with the motion control.
During learning run, textual instructions were first made to inform the participants that they would be traveling in a virtual maze, and that they would need to press their fingers to make movements in the maze. A small movement practice followed to ensure that the motions was clearly explained to the participants. One last textual instruction was presented to require participants to memorize the location of the only goal shop in the following maze either through navigation by themselves, which was the Free condition, or by a video clip according to the condition designated, which was the Tour condition. The navigation or video clip started right after the instructions and a fixation. In both self navigation and video clip, participants started at the same starting point, and the session would automatically end after 30 seconds.
During retrieval run, the same textual instructions and small practice related to motion control were repeated to ensure the smooth movement of participants inside the maze. Solely the last textual instruction was different to inform the participants to make Dir, Dis, and Nav to the goal shops in the following session. Dir began with a textual question describing that if participants were now at the start, which direction would the
goal shop be. The description was followed by a fixation and a street view of the starting point. Participants would then change the street view to the point they thought the view looked straight forward to the goal shop, and eventually confirm the answer.
Dis started with a textual question describing that if participants were currently at the start, how many steps would the goal shop be away from the starting point. The description would be followed by a fixation and a scale ranging from 0 to 10, which was the smallest and largest distance in the maze, with the mouse centered at 5. Participants would then change the steps they think were away from the goal shop, and eventually confirm the answer. Nav instructions next requested participants to navigate directly to the goal shop with smallest steps, and reminded them of a 30-second time limit. A fixation was then presented, and participants would find themselves at the starting point in the maze. Nav would be ended either if the participants navigated to the goal shop or surpassed the time limit of 30 seconds.
Formal Experiment
As outlined in Figure 5, the experiment began inside the scanning room with 4 learning runs which matched with the designated learning condition, and was followed by 4 retrieval runs each with 6 trials, comprising a total of 24 trials within the retrieval.
Short breaks no more than 2 minutes were available for participants between each run to alleviate fatigue.
During learning in the formal session, textual instructions similar to learning in environmental familiarization were again made, with differences that participants were required to memorize the location of the 12 goal shops in the upcoming mazes, and that the duration of learning was changed to 240 seconds. In both Free and Tour conditions, the 4 learning runs all started at the same locations.
During retrieval in the formal session, textual instructions similar to retrieval of familiarization were made, with differences that participants were placed at 1 of the goal shops during Dir, the scale during Dis was changed from 0 to 25 centered at 13 at the beginning, and that the time limit of Nav was changed to 90 seconds. An end was put to the Nav either when the participants succeeded to find the goal shop or the 90-second time limit was reached.
Debriefing and Questionnaire
Participants were required to draw the outline of the maze, and mark the locations of the goal shops outside the scanning room right after the experiment.
Strategies used to learn the maze, and difficulties met during learning were reported by the participants during the debriefing session. Self-report questionnaire including game and spatial navigation experiences were also required to be completed.
Behavioral Error Rates During Retrieval Analysis
Behavioral data only in formal experiment and debriefing was obtained. During learning, position, direction the participants were facing during navigation, and onset time for each slide were collected for both conditions. During retrieval, error rates and durations during Dir, Dis, along with position, direction, onset time, and reaction time during Nav were collected. Error rate of direction judgement (ErrDir), or direction mis- estimation was produced by
.
On the other hand, error rate of distance judgement (ErrDis), or distance mis-estimation was produced by
.
Additional absolute error rate of distance judgement (ErrDis, Abs) given by
is added to evaluate the magnitude of EDis. Error rate of navigation (ErrNav) was set to be 1 if participant failed in finding the goal shop in each trial, and was set to be 0 if succeeded.
Statistical analyses were carried out via R software environment (R Core Team, 2013). Type III analysis of variances (ANOVA) was conducted to evaluate the effect of decision making during spatial learning. Paired t tests were executed to investigate post- hoc effects, and p values were adjusted using false discovery rate (FDR). ANOVA and post-hoc tests were tested under the model with dependent variables including error rates and durations of Dir, Dis, and Nav. The 2 learning condition: (1) Free and Tour, and (2) objective between-goal distance values (GDV), also as number of steps to goal, were together set to be independent variables in the model to observe the effect of decision making on different difficulty levels of spatial navigation. In ANOVA analysis, error caused by individual difference was considered in the model. GDV were categorized into 4 groups: near (N), middle (M), far (F), and super far (SF) as discrete levels of distance values (DDV) for analysis because of the slight different number of trials within each GDV. Given the asymmetry in these distances, paired t tests were performed on the trials with symmetry, and independent t tests were performed to demonstrate the behavior with details.
Brain Imaging Acquisition
Brain imaging data was acquired from the 3T SIEMENS MAGNETOM Skyra scanner with a 32-channel head coil at Taiwan Mind and Brain Imaging Center,
National Cheng-Chi University, Taiwan. Field map was collected in the purpose of participant-wise spatial correction, and coplanar to the following functional images with axial slice = 38 slices, resolution = 2.8 x 2.8 x 3 mm, in-plane matrix = 78 x 78, field of view (FOV) = 220 x 220 mm, repetition time (TR) = 488 ms, echo time (TE) = 4.92 ms, and flip angle (FA) = 60°. T2-weighted structural image was collected in the purpose of participant-wise spatial co-registration, and coplanar to the following functional images with axial slice = 38 slices, resolution = 1 x 1 x 4 mm, in-plane matrix = 256 x 256, FOV = 256 x 256 mm, TR = 7480 ms, TE = 102 ms, and FA = 150°. Functional images of 8 runs were collected using echo-planar imaging (EPI) sequence parallel to the anterior-posterior commissural plane, with axial slice = 38 slices, resolution = 2.8 x 2.8 x 3 mm, in-plane matrix = 78 x 78, FOV = 220 x 220 mm, TR = 2400 ms, TE = 30 ms, and FA = 80. T1-weighted magnetization prepared rapid gradient echo (MPRAGE) image was collected in the purpose of group spatial normalization, with sagittal slice = 192 slices, resolution = 1 x 1 x 1 mm, in-plane matrix = 256 x 256, FOV = 256 x 256 mm, TR = 2500 ms, TE = 4.37 ms, and FA = 7°.
fMRI Data Preprocessing
Brain imaging data preprocessing was conducted using SPM12 (Penny, Friston, Ashburner, Kiebel, & Nichols, 2011) in MATLAB environment (The Math Works, Inc., 2020). At individual level, functional images were first spatially corrected for head motion via realignment, and then temporally corrected between different slices via slice- timing. For co-registration, T2-weighted structural image was applied to functional images, and T1-weighted detailed structural image was next applied to T2-weighted image which was previously adjusted by functional images. These co-registered individual images were then normalized to the East Asian brain template in Montreal
Neurological Institute (MNI) space (Mazziotta et al., 2001). Normalized images were lastly smoothed via a 3D 8 mm full width at half maximum (FWHM) of Gaussian kernel.
First Level Model of Learning Phase Neural Responses
First level analysis was applied on individual smoothed brain image to evaluate the effects of decision making on spatial navigation through general linear model (GLM). All of the regressors were obtained through convolving canonical HRF according to the temporal variables which were of the study’s interests. The analysis was achieved through first separating individual images into 2 1st level analyses as learning and retrieval sessions, each including Free and Tour conditions. The separation was aimed to downsize the amount of regressors through dividing the particularly distinct processes of learning and retrieval. During learning, task-related regressors consisted of location states including junctions (J), goal shops (S), traversals (T). and navigating dummies (D), which were defined when participants were stuck at a single location without any movement for more than 5 seconds, in both Free and Tour 4 learning runs. Non-task-related regressors consisted of 6 motion correction regressors in both Free and Tour 4 learning runs. In this analysis, 32 task-related regressors ((2 Free- Tour conditions x 4 J-S-T-D location states) x 4 runs) and 48 non-task-related ((2 Free- Tour conditions x 6 motion correction) x 4 runs) regressors were produced. Task-related regressors were onset delta functions modulated with duration, as the duration of location states differ from trial to trial according to the participants’ locations in the environment. Onset delta functions of task-related and non-task-related regressors were together convolved with HRF.
First Level Model of Retrieval Phase Neural Responses
During retrieval, task-related regressors consisted of Dir, Dis, and Nav with locations states including J, S, T, goals (G), and D in both Free and Tour 4 learning runs.
Non-task-related regressors consisted of 6 motion correction regressors in both Free and Tour 4 learning runs. In this analysis, 56 task-related regressors ((2 Free-Tour conditions x (Dir + Dis + 5 J-S-T-G-D location states)) x 4 runs) and 48 non-task-related ((2 Free- Tour conditions x 6 motion correction) x 4 runs) regressors were produced. For each participant, trial-wise GDV and trial-wise error rate of this subjective between-goal distance judgement (EDV), or trial-wise distance mis-estimation, were modulated as 2 non-orthogonalized 1st order parameters on Dir and Dis. This parameter modulation analysis was to examine the influences which objective and subjective distance perception could make on direction and distance judgments. Task-related regressors were onset delta functions modulated with duration, as the duration of location states differ from trial to trial according to the participants’ locations in the environment.
Onset delta functions of task-related and non-task-related regressors were together convolved with HRF.
Second Level Model of Neural Responses
In second level analysis, we produced paired t tests of different contrasts based on previous task-related regressors. The analysis was performed on the whole-brain group level to examine the contrasts of different location states under the regulation of decision making within individuals. During learning, contrasts between different location states (J-S-T) and decision making (Free-Tour) were produced. For Dir and Dis, 3 second level analyses (none- GDV-EDV parameter modulations) were generated.
During each of the 3 second level analyses of Dir and Dis, contrasts between decision
making (Free-Tour) were produced. During Nav, contrasts between different location states (J-S-T-G) and decision making (Free-Tour) were produced. D was excluded from these analyses due to its lack of information. Significant whole-brain contrasts were reported with threshold surpassing p < .001, and masked by grey matter template. For each contrast, threshold of cluster size were corrected by AlphaSim, with iteration = 1000 and correction by family-wise error (FWE) p < .05 (Yan, Wang, Zuo, & Zang, 2016).
Region of Interest (ROI) Definition and Analysis
Region of Interest (ROI) was further defined in order to have a detailed look into the activation pattern the subregions were demonstrating across the experiment. For functionally defined ROIs, spheres of 6 mm radius were established as ROIs centered at the previously found second level contrasts showing significant (Free > Tour) or (Tour >
Free) differences.
Based on our conceptualization, we also applied a priori anatomical ROIs focusing on bilateral HC. The HC was first outlined via the template provided in Marsbar AAL ROI, and divided into 8 smaller subregions with 2 sagittal curved slices, 2 axial curved slices, and 2 coronal flat slices as visualized in Figure 6. The curved slices were defined through a 2nd order linear regression with 2 variables to model the centroid axes along the hippocampal structure based on the coordinates in the template ROI. Voxel data masked by the ROIs was averaged through the assigned condition (e.g Free-Tour, J-S-T-G), and then extracted from all of the 21 participants. Statistical analyses of these extracted voxel values were conducted in R software environment (R Core Team, 2013), same as the behavioral analysis, using paired t test.
Results
Behavioral Results
Learning Patterns in Free and Tour Conditions
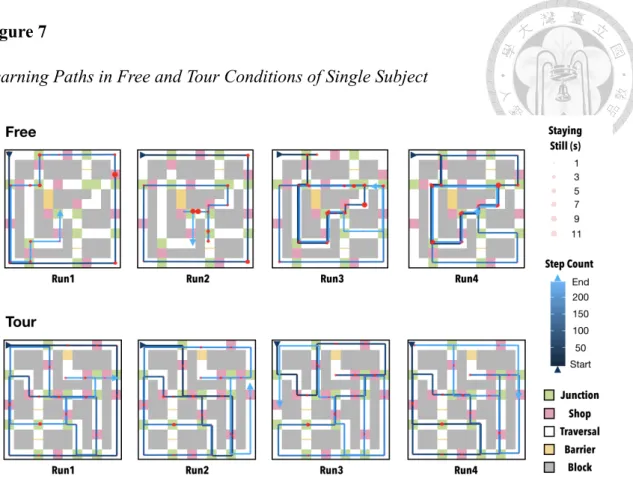
Compared with the fixed route given in the Tour condition, participants learned the maze by their own decision in a different pattern in the Free condition. Figure 7 demonstrated an example learning pattern from a participant during learning with 1 Free run and 1 Tour run. This pattern was further examined in Table 1, and visualized in Figure 8. Participants in the Free condition, compared to the Tour condition, travelled significantly less distinct S (t(20) = -2.26, p < .05). The less travelled S in the Free condition reflected shorter duration spent at S (t(20) = -43.43, p < .001). Free participants were found spending more time at J (t(20) = 8.82, p < .001) and T (t(20) = 12.74, p < .001) than the Tour participants.
Better Map Retrieval Performances in Free than Tour
Although participants travelled less S, behavioral results exhibited overall better retrieval performance in the Free than Tour condition. As shown in Table 2, 7, main effect between Free and Tour condition was revealed in the error rate (F(1, 20) = 4.76, p
< .05) and duration F(1, 20) = 6.04, p < .05) during Nav. During Nav, Free participants reached the goal with roughly less failure (t(20) = -2.05, p = .05) and significantly less time (t(20) = -2.39, p < .05) in Table 3, 8. In order to get a clearer view of this decision- making-based contrasts under different GDV, we performed t tests shown in Figure 9, 10. This analysis revealed multiple significant contrasts, in which error rates and durations were smaller in the Free than Tour condition under multiple GDV.
DDV was also found to have main effect on all retrieval performances including error rate of Dir (F(3, 60) = 9.58, p < .001), Dis (F(3, 60) = 55.17, p < .001), absolute
value of Dis (F(3, 60) = 17.01, p < .001), and Nav (F(3, 60) = 9.42, p < .001), shown in Table 2, 4, 5, 6. During Dis, error rates were at minimum in moderate distances, overestimated in short distances, and underestimated in long distances. Duration was as well under the influence of DDV with main effect found in duration of Dir (F(3, 60) = 6.36, p < .001), Dis (F(3, 60) = 4.54, p < .001), and Nav (F(3, 60) = 85.26, p < .001), shown in Table 7, 9, 10, 11.
Functional Imaging Results
Differences of Neural Responses During Free and Tour Learning
During learning, navigational agency modulated the decision-making-related brain regions, shown in Figure 11 and Table 12. In the (Free > Tour) contrast, significant activations were found in brain regions responsible for motion planning including primary motor area (PMA), supplementary area (SMA), cerebellum, and other brain regions including insula and somatosensory cortex. In the (Tour > Free) contrast, significant neural responses were found in middle temporal gyrus (MTG), and the expected medial OFC reflecting subjective states and affective reactions.
To examine our hypothesis about the labelling of critical spatial nodes, contrasts regarding different location states between Free and Tour condition were examined in Figure 12 and Table 13. In the (Free > Tour) contrasts, higher neural activations were found in motion planning and sensory regions at both spatial nodes and non-node locations, including PMA and SMA in (JFree > JTour), (SFree > STour), (TFree > TTour), insula and somatosensory cortex in (JFree > JTour), (TFree > TTour), cerebellum in (JFree > JTour), and frontal region including middle frontal gyrus in [(S > T)Free > (S > T)Tour]. The (Tour
> Free) contrast, on the other hand, demonstrated more temporal and frontal engagement at the spatial nodes, exhibiting inferior temporal gyrus in (JTour > JFree),
middle temporal gyrus (MTG) and medial OFC in (STour > SFree), and premotor cortex in [(S > T)Tour > (S > T)Free].
Differences of Neural Responses During Free and Tour Retrieval
During retrieval, no significant brain activation was found in the (Free > Tour) and the (Tour > Free) contrasts. Contrasts at different location states between Free and Tour condition were tested in Figure 13 and Table 14, as well to examine our hypothesis about the labelling of critical spatial nodes. In the (Free > Tour) contrasts especially at spatial nodes, significant neural activations were found, including HC activation supporting our hypothesis in [(S > T)Free > (S > T)Tour] and [(S > J)Free > (S > J)Tour], and intraparietal cortex in [(S > J)Free > (S > J)Tour]. The significant HC activation in support of our postulation suggested the spatial nodes as the critical labels during spatial navigation. In the (Tour > Free) contrast, higher brain responses were found at conflict monitoring ACC in [(S > T)Tour > (S > T)Free], and motion planning PMA in [(J > T)Tour >
(J > T)Free].
Imaging contrasts during Dir and Dis were illustrated in Figure 14 and summarized in Table 15. During Dir, no significant brain activation was found in the (Free > Tour) and the (Tour > Free) contrasts. During Dis, only 1 significant brain activation was found in the (Tour > Free) contrast. MTG and posterior cingulate cortex (PCC) were found significant activated in the EDV modulated (DisFree > DisTour) contrast, suggesting that greater distance mis-estimation engaged greater neural activity in these distance processing area in the Tour compared to Free condition. As we observed participants spending significant more time during Dir compared to Dis (t(20)
= 13.935, p < .001), we postulated a processing difference between the 2 judgement periods, and moved on to examine the neural activation contrasts. In the (Dir > Dis)
contrast, brain responses were found in paraHC, HC, primary visual cortex (V1), PCC, and temporoparietal junction. The higher involvement of HC could suggest that participants were more engaged with the spatial information retrieval of the goal during Dir compared to Dis. In the (Dis > Dir) contrast, higher brain activations were found in bilateral postcentral gyri and MTG.
Specific Spatial Environments Represented in ROIs
To further examine the neural responses under different contrasts, we defined functional ROIs at peak voxels found in the previous (Free > Tour) and (Tour > Free) contrasts (see methods). Parameter estimations of different contrasts were extracted and shown in Figure 15 and Table 16. In Free compared to the Tour condition, higher bilateral HC responses were found at the spatial nodes and Dir. Specifically, right HC was more engaged during learning in (J > T) (t(20) = 4.89, p < .001), and (S > T) (t(20)
= 2.61, p < .05). Left HC was more engaged during retrieval in (S > T) (t(20) = 3.28, p
< .01), and Dir(t(20) = 2.86, p < .01). These results strongly supported our hypothesis that navigational agency enhanced the labelling of the spatial nodes in grid and place cells in HC. In Tour compared to Free condition, higher neural responses were found at the spatial nodes, Dir, Dis in PCC, and Dis in right HC. We reported these higher activations during retrieval in PCC in (S > T) (t(20) = 2.55, p < .05), objective between- goal distance modulated Dis (t(20) = 2.48, p < .05), and subjective distance mis- estimation modulated Dir (t(20) = 2.44, p < .05) and Dis (t(20) = 3.46, p < .01). Right HC showed higher activation in the Tour compared to Free condition in subjective distance mis-estimation modulated Dis (t(20) = 2.67, p < .05). These results could suggest that greater distance and distance mis-estimation involved in higher neural responses mainly in PCC and right HC in the Tour than Free condition.